Sports Analytics Market Report Scope & Overview:
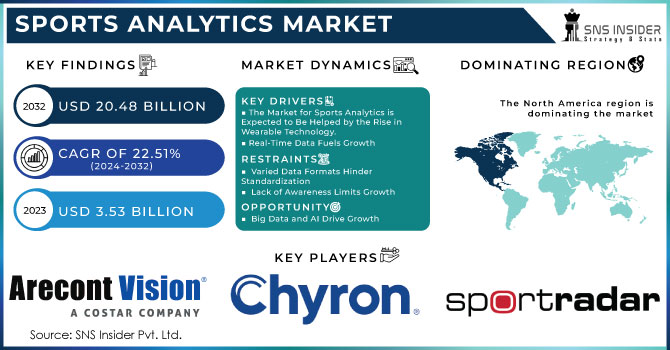
The Sports Analytics Market Size was valued at USD 3.53 billion in 2023 and is witnessed to reach USD 20.48 billion by 2032 and grow at a CAGR of 22.51% over the forecast period 2024-2032.
The ubiquity of wearable technology, and thus sensors is allowing athletes to be tracked in real-time - capturing a vast amount of data on their mechanical movement metrics, physiological measures as well as performance. Besides providing training information to coaches and sports scientists, the detail helps teams make performance decisions mid-game. As such, the market has shifted towards using data to enhance spectator engagement via tailored content interactive applications and augmented reality experiences for teams.
A HANS device (Head and Neck Support) is a U-shaped, carbon fiber collar fitted behind the neck by manufacturers of such technology. It is constructed of composite material and made up of two main sections. Helmet support and Neck and shoulder Support It stops your head from flogging backward and forward during an accident, too much twisting is also kept in check by the device. Also, sports equipment manufacturers have incorporated GPS in devices such as golf and cricket balls for tracking their real-time positions and transmitting the same to user's cell phones. The GPS also enables automatic scoring and analyses players' strengths/weaknesses for better development. For example, the GPS chip in a golf ball can detect various information such as shot height and timing from application to mobile phone.
Get more information on Sports Analytics Market - Request Sample Report
This leads to the growth of the Market due to the demand for high accuracy in decision-making. The introduction of advanced tracking technologies and mass utilization of wearables means massive amounts is player movement, fitness metrics as well as physiological data can now be captured in real time. This information greatly helps coaches and sports scientists to make smarter decisions in their training, injury prevention strategies, or during the game. This enhances the performance of athletes and helps teams do better by providing data-supported patterns that may not have been visible through traditional means. The most recent is the partnership between Oracle Corporation and Red Bull Racing to create a new team called Oracle Red Bull Racing in February 2022. Using Oracle Cloud analytics Expero refactored the technology to drive better coaching and engagement with fans.
MARKET DYNAMICS:
KEY DRIVERS:
- The Market for Sports Analytics is Expected to Be Helped by the Rise in Wearable Technology.
- Raising Focus on Real-Time Data for Organizing Training Sessions and Realizing Strategic Developments in Games is Propelling Sports Analytics Market Growth.
RESTRAINTS:
- Different Formats of Data and Metrics for Different Sports/Leagues is a Hindrance in Creating "Standardized" Analytics Solutions.
- Lack of Awareness Regarding the Significance of Sports Analytics Solutions is Hampering the Growth of The Market.
OPPORTUNITY:
- Rising Adoption of Big Data Analytics, M as well as AI Technologies are Offering a Lucrative Growth Opportunity for Sports Analytics Systems.
- Rising Investment by Sports Organizations in the Novel Solutions Expected to Propel the Growth of The Market for Sports Analytics Solutions.
KEY MARKET SEGMENTATION:
By Component
- Software
- Services
Based on components, the software segment captured 45% of the market revenue share in 2023. The increasing utilization of analytics software in major sports organizations to analyze and evaluate the performance capabilities enables their players, which is likely one key factor driving this market; Sports data analysis can be generated through software applications such as pre/post-game analysis, motion/video and statistical algorithm-based analytics platform-either offline or in real-time. Marketers create personalized software based on team and individual needs. The software segment is revolutionized by advancements in AR/VR, 2D/3D imaging, biometrics, video-based sensing, and big data analytics.
By Analysis Type
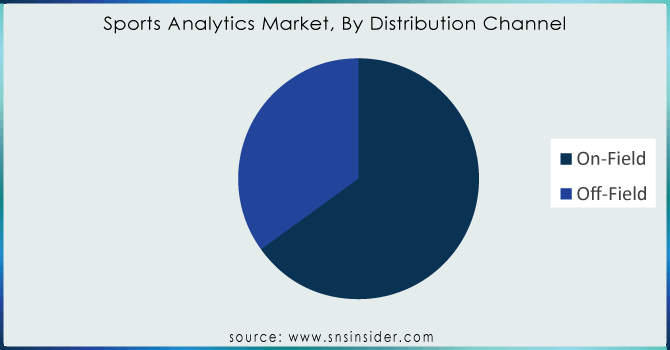
- On-Field
- Players & Team Analysis
- Video Analysis
- Health Assessment
- Off-Filed
- Fan Engagement
- Ticket Pricing
Based on the analysis, the on-field analysis segment held 71% of 2023 largest revenue share in the market. Off-field data metrics help teams construct compelling in-game strategies, nutrition plans, and other modalities that can raise their game. There is expected to be a greater demand for efficient evaluation of the health of athletes owing to an increasing emphasis on enhancing performance and optimizing injury prevention among players. There are several on-field analytical tools used in different sports, which help teams analyze the data and provide actionable results to sports organizations and coaching led by professionals.
Need any customization research/data on Sports Analytics Market - Enquiry Now
By End-Use
- Sports Teams
- Sports Leagues/Associations
- Individual Players/Coaches
- Media Organization
- Sports Betting
- Others
By end-use, the sports betting segment is expected to be a larger market in terms of revenue which is 24% in 2023. The sports betting sector is witnessing overarching market developments. The industry experiences a radical change in behavior towards data-driven decision-making as technology improves. With the intricate new age tools in analytics, bettors and organizations can analyze player performances as well team dynamics alongside their statistical records of yesterday adding more value for better prediction making. Further to this, the incorporation of artificial intelligence and machine learning is fuelling predictive modeling even more so, giving companies an advantage.
By Sports
- Football
- Cricket
- Baseball
- Basketball
- Rugby
-
Others
REGIONAL ANALYSIS:
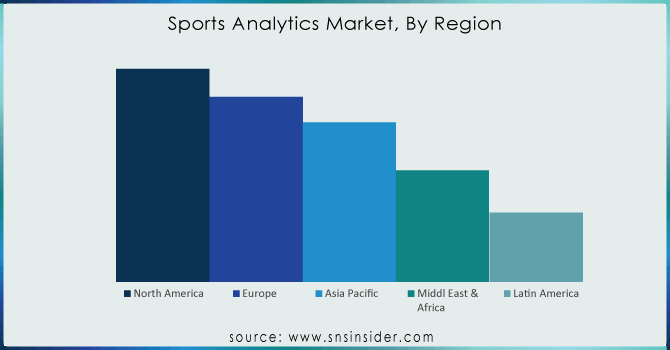
In 2023, the North American market has over 30% of the revenue share. The growth potential of the market is driven by a high adoption rate for new technologies such as smart infrastructure, sports data analytics, and digital signage in sports stadiums to attract more fans & enhance team performance. Top sports leagues like the NFL, NBA, MLB, and NHL, are turning to sports analytics solutions more than ever before for data-driven decisions that will drive growth opportunities as they seek differentiation among rival club teams.
REGIONAL COVERAGE:
- North America
- US
- Canada
- Mexico
- Europe
- Eastern Europe
- Poland
- Romania
- Hungary
- Turkey
- Rest of Eastern Europe
- Western Europe
- Germany
- France
- UK
- Italy
- Spain
- Netherlands
- Switzerland
- Austria
- Rest of Western Europe
- Eastern Europe
- Asia Pacific
- China
- India
- Japan
- South Korea
- Vietnam
- Singapore
- Australia
- Rest of Asia Pacific
- Middle East & Africa
- Middle East
- UAE
- Egypt
- Saudi Arabia
- Qatar
- Rest of Middle East
- Africa
- Nigeria
- South Africa
- Rest of Africa
- Middle East
- Latin America
- Brazil
- Argentina
- Colombia
- Rest of Latin America
KEY PLAYERS:
The Sports Analytics market players include Arecont Vision Coaster LLC, Agile Sports Analytics LLC, The Sportradar Group, ChyroHego Corporation, Genius Sports Group, International Business Machine (IBM) Corporation, Experfy, Inc., Oracle Corporation, SAP SE, Deltatre S.p.A., Stats LLC, Catapult Group International Ltd. & other players.
RECENT DEVELOPMENTS
- In October 2023, Texas A&M Athletics Sports Science Red Mountain, Texas (NRCCS) has reached an agreement for Gemini Sports Analytics will provide the Aggies with their AI software platform specifically made for sports to enable the staff of Aggie's access to Predictive analytics as well as metrics in help supporting student-athletes. The Gemini application empowers stakeholders with proactive data analytics, enhances collective cross-disciplinary professionals’ productivity, and enables top-level decision-makers to make strategic decisions sooner.
- In February 2023: Gemini Sports Analytics an AI and Automated Machine Learning tool, in conjunction with SIS (Sports Info Solutions) announced a partnership to pre-integrate SIS data directly into the Gemini app. In addition to the data integration, this partnership would leverage their respective footprints and offerings to develop solutions for clients of each company. Gemini is on a mission to globalize sports predictive and analytics by providing your sporting organization the ability to make quicker, easier decisions about recruitment, player development personnel health, and performance management choices.
| Report Attributes | Details |
| Market Size in 2023 | US$ 3.53 Billion |
| Market Size by 2032 | US$ 20.48 Billion |
| CAGR | CAGR of 22.51% From 2024 to 2032 |
| Base Year | 2023 |
| Forecast Period | 2024-2032 |
| Historical Data | 2020-2022 |
| Report Scope & Coverage | Market Size, Segments Analysis, Competitive Landscape, Regional Analysis, DROC & SWOT Analysis, Forecast Outlook |
| Key Segments | •By Component (Software & Services) •By Analysis (On-Field & Off-Field) •By Sports (Football, Cricket, Baseball, Basketball, Rugby & Others) •By End-use (Sports Team, Sports Leagues/Associations, Individual Players/Coaches, Media Organization, Sports Betting, Others) |
| Regional Analysis/Coverage | North America (US, Canada, Mexico), Europe (Eastern Europe [Poland, Romania, Hungary, Turkey, Rest of Eastern Europe] Western Europe] Germany, France, UK, Italy, Spain, Netherlands, Switzerland, Austria, Rest of Western Europe]), Asia Pacific (China, India, Japan, South Korea, Vietnam, Singapore, Australia, Rest of Asia Pacific), Middle East & Africa (Middle East [UAE, Egypt, Saudi Arabia, Qatar, Rest of Middle East], Africa [Nigeria, South Africa, Rest of Africa], Latin America (Brazil, Argentina, Colombia, Rest of Latin America) |
| Company Profiles | Arecont Vision Coaster LLC, Agile Sports Analytics LLC, The Sportradar Group, ChyroHego Corporation, Genius Sports Group, International Business Machine (IBM) Corporation, Experfy, Inc., Oracle Corporation, SAP SE, Deltatre S.p.A., Stats LLC, Catapult Group International Ltd. & other players |
| Key Drivers | •The Market for Sports Analytics is Expected to Be Helped by the Rise in Wearable Technology. •Raising Focus on Real-Time Data for Organizing Training Sessions and Realizing Strategic Developments in Games is Propelling Sports Analytics Market Growth. |
| RESTRAINTS | •Different Formats of Data and Metrics for Different Sports/Leagues is a Hindrance in Creating "Standardized" Analytics Solutions. •Lack of Awareness Regarding the Significance of Sports Analytics Solutions is Hampering the Growth of The Market. |
Get in Touch
