image

Transit Packaging Market Report Scope & Overview:

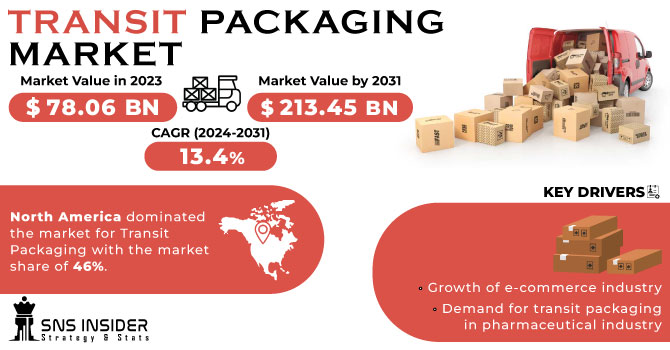
The Transit Packaging Market size was USD 68.84 billion in 2022 and is expected to Reach USD 185.61 billion by 2030 and grow at a CAGR of 13.2 % over the forecast period of 2023-2030.

Driven by the global expansion of e-commerce, the transit packaging market has witnessed steady growth. As companies increasingly rely on safe and cost-effective methods to ship their products, the need for innovative packaging solutions also increases. Manufacturers and suppliers to industries such as consumer goods, electronics, pharmaceuticals, and automobiles rely heavily on transit packaging to maintain goods integrity throughout the supply chain.

Transit Packaging Market Revenue Analysis

Get More Information on Transit Packaging Market - Request Sample Report

The market offers a multitude of transit packaging options, including corrugated boxes, pallets, crates and protective packaging. These solutions are designed to meet the specific requirements of different products, taking into account factors such as weight, fragility and mode of transport. As sustainability becomes more and more important, there is an increasing focus on environmentally friendly materials and packaging designs that reduce waste and promote recycling.

An important trend in the transit packaging industry is technology integration. Smart packaging solutions, equipped with sensors and tracking devices, enable real-time tracking of shipment status, including factors such as temperature, humidity and potential impacts. This improves transparency and accountability in the supply chain, allowing companies to solve problems quickly and maintain product quality.

The established packaging companies are constantly developing their products, introducing innovative materials and designs. At the same time, new entrants are focusing on disruptive technologies and sustainable materials to establish a foothold in the market.

Regulations and standards imposed by various industry and government bodies will continue to shape the market. Packaging must meet international guidelines for safe transport, which affect design, material selection and testing processes. This regulatory framework ensures that packaging can adequately protect products from damage and protect them from potential hazards during transit. 

MARKET DYNAMICS

KEY DRIVERS: 

  • Growth of e-commerce industry

The online shopping environment has transformed the retailing landscape and triggered a marked increase in demand for transit packaging. The security and reliability of packaging is needed in order to assure that a product stays intact at customers' doorsteps during online shopping.

  • Demand for transit packaging in pharmaceutical industry

RESTRAIN:

  • Increased cost pressure is hampering the market growth

It is a constant challenge to find balance between the need for efficient packaging and budgetary constraints. The cost of high-quality protective packaging materials and technologies can be higher, which in turn has a negative impact on total costs for the supply chain.

OPPORTUNITY:

  • Customized Packaging Solutions can increase the demand for the market

Customized packaging solutions are requested by industries with specific requirements, such as electronics and pharmaceuticals. Designing customizable packaging that meets specific needs can lead to partnerships and long-term contracts.

  • Global Trade Expansion across the globe is driving the market.

CHALLENGES:

  • Volatilities in the cost of materials

Packaging costs can be affected by price fluctuations of raw materials such as cardboard, plastic and metal. Maintaining competitiveness is an ongoing challenge to deal with these cost variations.

IMPACT OF RUSSIAN UKRAINE WAR

Russia-Ukraine conflict had a negative impact on the transit packaging market. Due to the war, the Russia is limited the export of oil to other regions, due to which the prices of the oil have increased and this has caused increase in prices of the raw materials and also the shortage of the polymers and plastics. Petroleum is the major raw material for making the polymers. A shortage of pallets for shipping products is also faced, along with polymers needed to manufacture plastic components and parts as well as steel that needs to be made into plastics. In total, Ukraine is the biggest wooden pallet producer and supplies about 15 million pallets annually to Europe alone. This would slow down global shipments by reducing the number of pallets in circulation, thus leading to raw materials sitting in warehouses waiting for shipment.

Severe economic sanctions, including a ban on American oil imports from Russia, were imposed after the outbreak of the war. The price of oil quickly rose to more than $100 a barrel, indicating that the prices for plastics were on the rise.

IMPACT OF ONGOING RECESSION

The market for transit packaging is expected to be adversely affected by the current recession. In 2023, the market is projected to decline by 3.5%. Delays in transportation and logistics, which can increase costs and delay the delivery of goods. Price increases for raw materials, which will lead to increased costs of transit packaging. Due to heavy recession North American transit packaging market is expected to see 4 % decrease.

KEY MARKET SEGMENTS

By Material

By Product Type

  • Crates

  • Pallets

  • Corrugated Boxes

  • Others

By Packaging Type

  • Transit Cartons

  • Transit Containers

  • Transit Intermediate Bulk Containers

  • Transit Wooden Crates

  • Transit Barrels

  • Transit Corrugates Boxes

  • Transit Strapping, Others

By End Use

  • Food & Beverages

  • Consumer Goods

  • E-commerce

  • Third Party Logistics

  • Chemicals

  • Industrial Machinery & Equipment

  • Automotive

  • Electrical & Electronics

  • Building & Construction

  • Pharmaceuticals

Transit Packaging Market Segmentation Analysis

Get Customized Report as per Your Business Requirement - Request For Customized Report

REGIONAL ANALYSIS

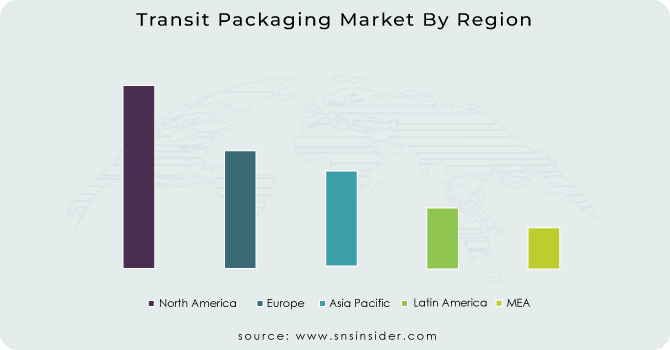
North America dominated the market for Transit Packaging with the market share of 46%. This is due to the presence of the major Pharmaceutical, Food & Beverage, and Automotive manufacturers in the US, Canada and Mexico. The use of the plastic reusable containers which give more robustness, and is lightweight gave the market growth in this region. US, dominated the market with the highest market share followed by Canada which is fastest growing market.

Europe transit packaging market is growing positively. The expansion  of e-commerce sector in the region, is growing the market for logistics giving rise to the transit packaging. In addition, the increasing demand for the durable packaging for fragile products, and increasing import and export are booming the market in the European region.

The Asia Pacific region will show the significant growth over the forecast period. This is due to the rapid developing industrial sector in the region. The presence of the raw materials such as the metal and plastic are increasing the market growth. China market is the dominating the transit packaging followed by the Indian  market which is the fastest growing market over the forecast period.

REGIONAL COVERAGE:

North America

  • US

  • Canada

  • Mexico

Europe

  • Eastern Europe

    • Poland

    • Romania

    • Hungary

    • Turkey

    • Rest of Eastern Europe

  • Western Europe

    • Germany
    • France
    • UK
    • Italy
    • Spain
    • Netherlands
    • Switzerland
    • Austria
    • Rest of Western Europe

Asia Pacific

  • China

  • India

  • Japan

  • South Korea

  • Vietnam

  • Singapore

  • Australia

  • Rest of Asia Pacific

Middle East & Africa

  • Middle East

    • UAE

    • Egypt

    • Saudi Arabia

    • Qatar

    • Rest of Middle East

  • Africa

    • Nigeria

    • South Africa

    • Rest of Africa

Latin America

  • Brazil

  • Argentina

  • Colombia

  • Rest of Latin America     

Key players

Some major key players in the Transit Packaging market are Smurfit Kappa, West Rock Company, Flex-Pak Corporation, International Paper, El Dorado Packaging, Multifab Packaging, Pak-Line Limited, Louisiana Pacific Corporation, Polymax, Inc, Celanese Corporation and other players.

West Rock Company-Company Financial Analysis

Company Landscape Analysis

RECENT DEVELOPMENT

  • In order to save an average of 249 tonnes of CO2 per year, Jgermeister has adapted its shipping containers to be manufactured from cardboard and is said to include more than 90% recycled paper, amongst other changes.

  • To meet the needs of modern pharmaceutical companies, and to help their products move safely into the supply chain, a Magnum Optimum Hopper 1208 has been added to Schoeller Allibert's widest range of foldable containers.

Transit Packaging Market Report Scope:
Report Attributes Details
Market Size in 2022  US$ 68.84 Bn
Market Size by 2030  US$ 185.61 Bn
CAGR   CAGR of 13.2 % From 2023 to 2030
Base Year 2022
Forecast Period  2023-2030
Historical Data  2019-2021
Report Scope & Coverage Market Size, Segments Analysis, Competitive  Landscape, Regional Analysis, DROC & SWOT Analysis, Forecast Outlook
Key Segments • by Material (Polyethylene, Polyethylene Terephthalate, Polypropylene, Polyurethane, Ethylene Vinyl Alcohol, Polyvinyl Chloride, Paper & Paperboard, Wood, Metal)
• by Product Type (Crates, Pallets, Corrugated Boxes, Others)
• by Packaging Type (Transit Cartons, Transit Containers, Transit Intermediate Bulk Containers, Transit Wooden Crates, Transit Barrels, Transit Corrugates Boxes, Transit Strapping, Others)
• by End Use (Food & Beverages, Consumer Goods, E-commerce, Third Party Logistics, Chemicals, Industrial Machinery & Equipment, Automotive, Electrical & Electronics, Building & Construction, Pharmaceuticals)
Regional Analysis/Coverage North America (US, Canada, Mexico), Europe (Eastern Europe [Poland, Romania, Hungary, Turkey, Rest of Eastern Europe] Western Europe] Germany, France, UK, Italy, Spain, Netherlands, Switzerland, Austria, Rest of Western Europe]), Asia Pacific (China, India, Japan, South Korea, Vietnam, Singapore, Australia, Rest of Asia Pacific), Middle East & Africa (Middle East [UAE, Egypt, Saudi Arabia, Qatar, Rest of Middle East], Africa [Nigeria, South Africa, Rest of Africa], Latin America (Brazil, Argentina, Colombia Rest of Latin America)
Company Profiles Smurfit Kappa, West Rock Company, Flex-Pak Corporation, International Paper, El Dorado Packaging, Multifab Packaging, Pak-Line Limited, Louisiana Pacific Corporation, Polymax, Inc, Celanese Corporation
Key Drivers • Growth of e-commerce industry
• Demand for transit packaging in pharmaceutical industry
Market Restraints • Increased cost pressure is hampering the market growth 


Frequently Asked Questions

The Compound Annual Growth rate for Transit Packaging Market over the forecast period is 5.5 %.

USD 12.58  Billion is the projected Transit Packaging market Size of market by 2030.

North America is the dominating and the fastest growing region of the Transit Packaging Market.

The major key players are Smurfit Kappa, West Rock Company, Flex-Pak Corporation, International Paper, El Dorado Packaging.

Ans. Growth of e-commerce industry is driving the market growth.

TABLE OF CONTENT

1. Introduction

1.1 Market Definition

1.2 Scope

1.3 Research Assumptions

2. Research Methodology


3. Market Dynamics

3.1 Drivers

3.2 Restraints

3.3 Opportunities

3.4 Challenges

4. Impact Analysis

4.1 Impact of the Russia-Ukraine War

4.2 Impact of Ongoing Recession

4.2.1 Introduction

4.2.2 Impact on major economies

4.2.2.1 US

4.2.2.2 Canada

4.2.2.3 Germany

4.2.2.4 France

4.2.2.5 United Kingdom

4.2.2.6 China

4.2.2.7 Japan

4.2.2.8 South Korea

4.2.2.9 Rest of the World

4.3 Supply Demand Gap Analysis

5. Value Chain Analysis


6. Porter’s 5 forces model


7. PEST Analysis

8. Transit Packaging Market Segmentation, by Material

8.1 Polyethylene

8.2 Polyethylene Terephthalate

8.3 Polypropylene

8.4 Polyurethane

8.5 Ethylene Vinyl Alcohol

8.6 Polyvinyl Chloride

8.7 Paper & Paperboard

8.8 Wood

8.9 Metal

9. Transit Packaging Market Segmentation, by Product Type

9.1 Crates

9.2 Pallets

9.3 Corrugated Boxes

9.4 Others

10. Transit Packaging Market Segmentation, by Packaging Type

10.1 Transit Cartons

10.2 Transit Containers

10.3 Transit Intermediate Bulk Containers

10.4 Transit Wooden Crates

10. 5 Transit Barrels

10.6 Transit Corrugates Boxes

10.7 Transit Strapping

10.8 Others

11. Transit Packaging Market Segmentation, by End Use

11.1 Food & Beverages

11.2 Consumer Goods

11.3 E-commerce

11.4 Third Party Logistics

11.5 Chemicals

11.6 Industrial Machinery & Equipment

11.7 Automotive

11.8 Electrical & Electronics

11.9 Building & Construction

11.10 Pharmaceuticals

12. Regional Analysis

12.1 Introduction

12.2 North America

12.2.1 North America Transit Packaging Market by Country

12.2.2North America Transit Packaging Market by Material

12.2.3 North America Transit Packaging Market by Product Type

12.2.4 North America Transit Packaging Market by Packaging Type

12.2.5 North America Transit Packaging Market by End Use

12.2.6 USA

12.2.6.1 USA Transit Packaging Market by Material

12.2.6.2 USA Transit Packaging Market by Product Type

12.2.6.3 USA Transit Packaging Market by Packaging Type

12.2.6.4 USA Transit Packaging Market by End Use

12.2.7 Canada

12.2.7.1 Canada Transit Packaging Market by Material

12.2.7.2 Canada Transit Packaging Market by Product Type

12.2.7.3 Canada Transit Packaging Market by Packaging Type

12.2.7.4 Canada Transit Packaging Market by End Use

12.2.8 Mexico

12.2.8.1 Mexico Transit Packaging Market by Raw Packaging Type

12.2.8.2 Mexico Transit Packaging Market by Product Type

12.2.8.3 Mexico Transit Packaging Market by Packaging Type

12.2.8.4 Mexico Transit Packaging Market by End Use

12.3 Europe

12.3.1 Eastern Europe

12.3.1.1 Eastern Europe Transit Packaging Market by Country

12.3.1.2 Eastern Europe Transit Packaging Market by Material

12.3.1.3 Eastern Europe Transit Packaging Market by Product Type

12.3.1.4 Eastern Europe Transit Packaging Market by Packaging Type

12.3.1.5 Eastern Europe Transit Packaging Market by End Use

12.3.1.6 Poland

 12.3.1.6.1 Poland Transit Packaging Market by Material

12.3.1.6.2 Poland Transit Packaging Market by Product Type

12.3.1.6.3 Poland Transit Packaging Market by Packaging Type

12.3.1.6.4 Poland Transit Packaging Market by End Use

12.3.1.7 Romania

12.3.1.7.1 Romania Transit Packaging Market by Material

12.3.1.7.2 Romania Transit Packaging Market by Product Type

12.3.1.7.3 Romania Transit Packaging Market by Packaging Type

12.3.1.7.4 Romania Transit Packaging Market by End Use

12.3.1.8 Hungary

12.3.1.8.1 Hungary Transit Packaging Market by Material

12.3.1.8.2 Hungary Transit Packaging Market by Product Type

12.3.1.8.3 Hungary Transit Packaging Market by Packaging Type

12.3.1.8.4 Hungary Transit Packaging Market by End Use

12.3.1.9 Turkey

12.3.1.9.1 Turkey Transit Packaging Market by Material

12.3.1.9.2 Turkey Transit Packaging Market by Product Type

12.3.1.9.3 Turkey Transit Packaging Market by Packaging Type

12.3.1.9.4 Turkey Transit Packaging Market by End Use

12.3.1.10 Rest of Eastern Europe

12.3.1.10.1 Rest of Eastern Europe Transit Packaging Market by Material

12.3.1.10.2 Rest of Eastern Europe Transit Packaging Market by Product Type

12.3.1.10.3 Rest of Eastern Europe Transit Packaging Market by Packaging Type

12.3.1.10.4 Rest of Eastern Europe Transit Packaging Market by End Use

12.3.2 Western Europe

12.3.2.1 Western Europe Transit Packaging Market by Country

12.3.2.2 Western Europe Transit Packaging Market by Material

12.3.2.3 Western Europe Transit Packaging Market by Product Type

12.3.2.4 Western Europe Transit Packaging Market by Packaging Type

12.3.2.5 Western Europe Transit Packaging Market by End Use

12.3.2.6 Germany

12.3.2.6.1 Germany Transit Packaging Market by Material

12.3.2.6.2 Germany Transit Packaging Market by Product Type

12.3.2.6.3 Germany Transit Packaging Market by Packaging Type

12.3.2.6.4 Germany Transit Packaging Market by End Use

12.3.2.7 France

12.3.2.7.1 France Transit Packaging Market by Material

12.3.2.7.2 France Transit Packaging Market by Product Type

12.3.2.7.3 France Transit Packaging Market by Packaging Type

12.3.2.7.4 France Transit Packaging Market by End Use

12.3.2.8 UK

12.3.2.8.1 UK Transit Packaging Market by Material

12.3.2.8.2 UK Transit Packaging Market by Product Type

12.3.2.8.3 UK Transit Packaging Market by Packaging Type

12.3.2.8.4 UK Transit Packaging Market by End Use

12.3.2.9 Italy

12.3.2.9.1 Italy Transit Packaging Market by Material

12.3.2.9.2 Italy Transit Packaging Market by Product Type

12.3.2.9.3 Italy Transit Packaging Market by Packaging Type

12.3.2.9.4 Italy Transit Packaging Market by End Use

12.3.2.10 Spain

12.3.2.10.1 Spain Transit Packaging Market by Material

12.3.2.10.2 Spain Transit Packaging Market by Product Type

12.3.2.10.3 Spain Transit Packaging Market by Packaging Type

12.3.2.10.4 Spain Transit Packaging Market by End Use

12.3.2.11 Netherlands

12.3.2.11.1 Netherlands Transit Packaging Market by Material

12.3.2.11.2 Netherlands Transit Packaging Market by Product Type

12.3.2.11.3 Netherlands Transit Packaging Market by Packaging Type

12.3.2.11.4 Netherlands Transit Packaging Market by End Use

12.3.2.12 Switzerland

12.3.2.12.1 Switzerland Transit Packaging Market by Material

12.3.2.12.2 Switzerland Transit Packaging Market by Product Type

12.3.2.12.3 Switzerland Transit Packaging Market by Packaging Type

12.3.2.12.4 Switzerland Transit Packaging Market by End Use

12.3.2.13 Austria

12.3.2.13.1 Austria Transit Packaging Market by Material

12.3.2.13.2 Austria Transit Packaging Market by Product Type

12.3.2.13.3 Austria Transit Packaging Market by Packaging Type

12.3.2.13.4 Austria Transit Packaging Market by End Use

12.3.2.14 Rest of Western Europe

12.3.2.14.1 Rest of Western Europe Transit Packaging Market by Material

12.3.2.14.2 Rest of Western Europe Transit Packaging Market by Product Type

12.3.2.14.3 Rest of Western Europe Transit Packaging Market by Packaging Type

12.3.2.14.4 Rest of Western Europe Transit Packaging Market by End Use

12.4 Asia-Pacific

12.4.1 Asia Pacific Transit Packaging Market by Country

12.4.2 Asia Pacific Transit Packaging Market by Material

12.4.3 Asia Pacific Transit Packaging Market by Product Type

12.4.4 Asia Pacific Transit Packaging Market by Packaging Type

12.4.5 Asia Pacific Transit Packaging Market by End Use

12.4.6 China

12.4.6.1 China Transit Packaging Market by Material

12.4.6.2 China Transit Packaging Market by Product Type

12.4.6.3 China Transit Packaging Market by Packaging Type

12.4.6.4 China Transit Packaging Market by End Use

12.4.7 India

12.4.7.1 India Transit Packaging Market by Material

12.4.7.2 India Transit Packaging Market by Product Type

12.4.7.3 India Transit Packaging Market by Packaging Type

12.4.7.4 India Transit Packaging Market by End Use

12.4.8 Japan

12.4.8.1 Japan Transit Packaging Market by Material

12.4.8.2 Japan Transit Packaging Market by Product Type

12.4.8.3 Japan Transit Packaging Market by Packaging Type

12.4.8.4 Japan Transit Packaging Market by End Use

12.4.9 South Korea

12.4.9.1 South Korea Transit Packaging Market by Material

12.4.9.2 South Korea Transit Packaging Market by Product Type

12.4.9.3 South Korea Transit Packaging Market by Packaging Type

12.4.9.4 South Korea Transit Packaging Market by End Use

12.4.10 Vietnam

12.4.10.1 Vietnam Transit Packaging Market by Material

12.4.10.2 Vietnam Transit Packaging Market by Product Type

12.4.10.3 Vietnam Transit Packaging Market by Packaging Type

12.4.10.4 Vietnam Transit Packaging Market by End Use

12.4.11 Singapore

12.4.11.1 Singapore Transit Packaging Market by Material

12.4.11.2 Singapore Transit Packaging Market by Product Type

12.4.11.3 Singapore Transit Packaging Market by Packaging Type

12.4.11.4 Singapore Transit Packaging Market by End Use

12.4.12 Australia

12.4.12.1 Australia Transit Packaging Market by Material

12.4.12.2 Australia Transit Packaging Market by Product Type

12.4.12.3 Australia Transit Packaging Market by Packaging Type

12.4.12.4 Australia Transit Packaging Market by End Use

12.4.13 Rest of Asia-Pacific

12.4.13.1 Rest of Asia-Pacific Transit Packaging Market by Material

12.4.13.2 Rest of Asia-Pacific APAC Transit Packaging Market by Product Type

12.4.13.3 Rest of Asia-Pacific Transit Packaging Market by Packaging Type

12.4.13.4 Rest of Asia-Pacific Transit Packaging Market by End Use

12.5 Middle East & Africa

12.5.1 Middle East

12.5.1.1 Middle East Transit Packaging Market by country

12.5.1.2 Middle East Transit Packaging Market by Material

12.5.1.3 Middle East Transit Packaging Market by Product Type

12.5.1.4 Middle East Transit Packaging Market by Packaging Type

12.5.1.5 Middle East Transit Packaging Market by End Use

12.5.1.6 UAE

12.5.1.6.1 UAE Transit Packaging Market by Material

12.5.1.6.2 UAE Transit Packaging Market by Product Type

12.5.1.6.3 UAE Transit Packaging Market by Packaging Type

12.5.1.6.4 UAE Transit Packaging Market by End Use

12.5.1.7 Egypt

12.5.1.7.1 Egypt Transit Packaging Market by Material

12.5.1.7.2 Egypt Transit Packaging Market by Product Type

12.5.1.7.3 Egypt Transit Packaging Market by Packaging Type

12.5.1.7.4 Egypt Transit Packaging Market by End Use

12.5.1.8 Saudi Arabia

12.5.1.8.1 Saudi Arabia Transit Packaging Market by Material

12.5.1.8.2 Saudi Arabia Transit Packaging Market by Product Type

12.5.1.8.3 Saudi Arabia Transit Packaging Market by Packaging Type

12.5.1.8.4 Saudi Arabia Transit Packaging Market by End Use

12.5.1.9 Qatar

12.5.1.9.1 Qatar Transit Packaging Market by Material

12.5.1.9.2 Qatar Transit Packaging Market by Product Type

12.5.1.9.3 Qatar Transit Packaging Market by Packaging Type

12.5.1.9.4 Qatar Transit Packaging Market by End Use

12.5.1.10 Rest of Middle East

12.5.1.10.1 Rest of Middle East Transit Packaging Market by Material

12.5.1.10.2 Rest of Middle East Transit Packaging Market by Product Type

12.5.1.10.3 Rest of Middle East Transit Packaging Market by Packaging Type

12.5.1.10.4 Rest of Middle East Transit Packaging Market by End Use

12.5.2. Africa

12.5.2.1 Africa Transit Packaging Market by country

12.5.2.2 Africa Transit Packaging Market by Material

12.5.2.3 Africa Transit Packaging Market by Product Type

12.5.2.4 Africa Transit Packaging Market by Packaging Type

12.5.2.5 Africa Transit Packaging Market by End Use

12.5.2.6 Nigeria

12.5.2.6.1 Nigeria Transit Packaging Market by Material

12.5.2.6.2 Nigeria Transit Packaging Market by Product Type

12.5.2.6.3 Nigeria Transit Packaging Market by Packaging Type

12.5.2.6.4 Nigeria Transit Packaging Market by End Use

12.5.2.7 South Africa

12.5.2.7.1 South Africa Transit Packaging Market by Material

12.5.2.7.2 South Africa Transit Packaging Market by Product Type

12.5.2.7.3 South Africa Transit Packaging Market by Packaging Type

12.5.2.7.4 South Africa Transit Packaging Market by End Use

12.5.2.8 Rest of Africa

12.5.2.8.1 Rest of Africa Transit Packaging Market by Material

12.5.2.8.2 Rest of Africa Transit Packaging Market by Product Type

12.5.2.8.3 Rest of Africa Transit Packaging Market by Packaging Type

12.5.2.8.4 Rest of Africa Transit Packaging Market by End Use

12.6. Latin America

12.6.1 Latin America Transit Packaging Market by country

12.6.2 Latin America Transit Packaging Market by Material

12.6.3 Latin America Transit Packaging Market by Product Type

12.6.4 Latin America Transit Packaging Market by Packaging Type

12.6.5 Latin America Transit Packaging Market by End Use

12.6.6 Brazil

12.6.6.1 Brazil Transit Packaging Market by Material

12.6.6.2 Brazil Africa Transit Packaging Market by Product Type

12.6.6.3 Brazil Transit Packaging Market by Packaging Type

12.6.6.4 Brazil Transit Packaging Market by End Use

12.6.7 Argentina

12.6.7.1 Argentina Transit Packaging Market by Material

12.6.7.2 Argentina Transit Packaging Market by Product Type

12.6.7.3 Argentina Transit Packaging Market by Packaging Type

12.6.7.4 Argentina Transit Packaging Market by End Use

12.6.8 Colombia

12.6.8.1 Colombia Transit Packaging Market by Material

12.6.8.2 Colombia Transit Packaging Market by Product Type

12.6.8.3 Colombia Transit Packaging Market by Packaging Type

12.6.8.4 Colombia Transit Packaging Market by End Use

12.6.9 Rest of Latin America

12.6.9.1 Rest of Latin America Transit Packaging Market by Material

12.6.9.2 Rest of Latin America Transit Packaging Market by Product Type

12.6.9.3 Rest of Latin America Transit Packaging Market by Packaging Type

12.6.9.4 Rest of Latin America Transit Packaging Market by End Use

13 Company Profile

13.1 Smurfit Kappa

13.1.1 Company Overview

13.1.2 Financials

13.1.3 Product/ Services Offered

13.1.4 SWOT Analysis

13.1.5 The SNS View

13.2 West Rock Company

13.2.1 Company Overview

13.2.2 Financials

13.2.3 Product/ Services Offered

13.2.4 SWOT Analysis

13.2.5 The SNS View

13.3 Flex-Pak Corporation

13.3.1 Company Overview

13.3.2 Financials

13.3.3 Product/ Services Offered

13.3.4 SWOT Analysis

13.3.5 The SNS View

13.4 International Paper

13.4 Company Overview

13.4.2 Financials

13.4.3 Product/ Services Offered

13.4.4 SWOT Analysis

13.4.5 The SNS View

13.5 El Dorado Packaging

13.5.1 Company Overview

13.5.2 Financials

13.5.3 Product/ Services Offered

13.5.4 SWOT Analysis

13.5.5 The SNS View

13.6 Multifab Packaging

13.6.1 Company Overview

13.6.2 Financials

13.6.3 Product/ Services Offered

13.6.4 SWOT Analysis

13.6.5 The SNS View

13.7 Pak-Line Limited

13.7.1 Company Overview

13.7.2 Financials

13.7.3 Product/ Services Offered

13.7.4 SWOT Analysis

13.7.5 The SNS View

13.8 Louisiana Pacific Corporation

13.8.1 Company Overview

13.8.2 Financials

13.8.3 Product/ Services Offered

13.8.4 SWOT Analysis

13.8.5 The SNS View

13.9 Polymax Inc

13.9.1 Company Overview

13.9.2 Financials

13.9.3 Product/Services Offered

13.9.4 SWOT Analysis

13.9.5 The SNS View

13.10 Celanese Corporation

13.10.1 Company Overview

13.10.2 Financials

13.10.3 Product/Services Offered

13.10.4 SWOT Analysis

13.10.5 The SNS View

14. Competitive Landscape

14. Competitive Landscape

14.1 Competitive Bench marking

14.2 Market Share Analysis

14.3 Recent Developments

14.3.1 Industry News

14.3.2 Company News

14.3.3 Mergers & Acquisition

15. USE Cases and Best Practices

16. Conclusion

An accurate research report requires proper strategizing as well as implementation. There are multiple factors involved in the completion of good and accurate research report and selecting the best methodology to compete the research is the toughest part. Since the research reports we provide play a crucial role in any company’s decision-making process, therefore we at SNS Insider always believe that we should choose the best method which gives us results closer to reality. This allows us to reach at a stage wherein we can provide our clients best and accurate investment to output ratio.

Each report that we prepare takes a timeframe of 350-400 business hours for production. Starting from the selection of titles through a couple of in-depth brain storming session to the final QC process before uploading our titles on our website we dedicate around 350 working hours. The titles are selected based on their current market cap and the foreseen CAGR and growth.


The 5 steps process:

Step 1: Secondary Research:

Secondary Research or Desk Research is as the name suggests is a research process wherein, we collect data through the readily available information. In this process we use various paid and unpaid databases which our team has access to and gather data through the same. This includes examining of listed companies’ annual reports, Journals, SEC filling etc. Apart from this our team has access to various associations across the globe across different industries. Lastly, we have exchange relationships with various university as well as individual libraries.

Secondary Research

Step 2: Primary Research

When we talk about primary research, it is a type of study in which the researchers collect relevant data samples directly, rather than relying on previously collected data.  This type of research is focused on gaining content specific facts that can be sued to solve specific problems. Since the collected data is fresh and first hand therefore it makes the study more accurate and genuine.

We at SNS Insider have divided Primary Research into 2 parts.

Part 1 wherein we interview the KOLs of major players as well as the upcoming ones across various geographic regions. This allows us to have their view over the market scenario and acts as an important tool to come closer to the accurate market numbers. As many as 45 paid and unpaid primary interviews are taken from both the demand and supply side of the industry to make sure we land at an accurate judgement and analysis of the market.

This step involves the triangulation of data wherein our team analyses the interview transcripts, online survey responses and observation of on filed participants. The below mentioned chart should give a better understanding of the part 1 of the primary interview.

Primary Research

Part 2: In this part of primary research the data collected via secondary research and the part 1 of the primary research is validated with the interviews from individual consultants and subject matter experts.

Consultants are those set of people who have at least 12 years of experience and expertise within the industry whereas Subject Matter Experts are those with at least 15 years of experience behind their back within the same space. The data with the help of two main processes i.e., FGDs (Focused Group Discussions) and IDs (Individual Discussions). This gives us a 3rd party nonbiased primary view of the market scenario making it a more dependable one while collation of the data pointers.

Step 3: Data Bank Validation

Once all the information is collected via primary and secondary sources, we run that information for data validation. At our intelligence centre our research heads track a lot of information related to the market which includes the quarterly reports, the daily stock prices, and other relevant information. Our data bank server gets updated every fortnight and that is how the information which we collected using our primary and secondary information is revalidated in real time.

Data Bank Validation

Step 4: QA/QC Process

After all the data collection and validation our team does a final level of quality check and quality assurance to get rid of any unwanted or undesired mistakes. This might include but not limited to getting rid of the any typos, duplication of numbers or missing of any important information. The people involved in this process include technical content writers, research heads and graphics people. Once this process is completed the title gets uploader on our platform for our clients to read it.

Step 5: Final QC/QA Process:

This is the last process and comes when the client has ordered the study. In this process a final QA/QC is done before the study is emailed to the client. Since we believe in giving our clients a good experience of our research studies, therefore, to make sure that we do not lack at our end in any way humanly possible we do a final round of quality check and then dispatch the study to the client.

Start a Conversation

Hi! Click one of our member below to chat on Phone