Conductivity Meter Market Size Analysis:
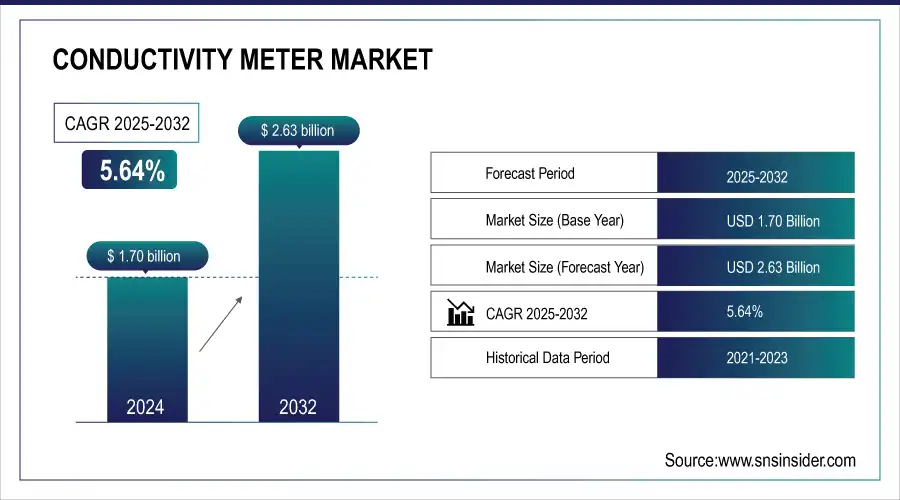
The Conductivity Meter Market size was valued at USD 1.70 billion in 2024 and is expected to reach USD 2.63 billion by 2032 growing at a CAGR of 5.64% over the forecast period of 2025-2032.
To Get more information On Conductivity Meter Market - Request Free Sample Report
The global conductivity meter market has been showing a high growth rate due to an increasing demand for accurate fluid test systems in water quality control, chemical, pharmaceutical, and power industries. Rising investments in infrastructure and stringent guidelines for water quality monitoring are also adding to the growth of the market. Introduction of more advanced sensor technologies and better digital integration further increase the performance and accuracy of the conductivity measurement.
According to research, over 5 million people die annually globally due to waterborne diseases, emphasizing the critical need for real-time water quality monitoring systems including conductivity meters.
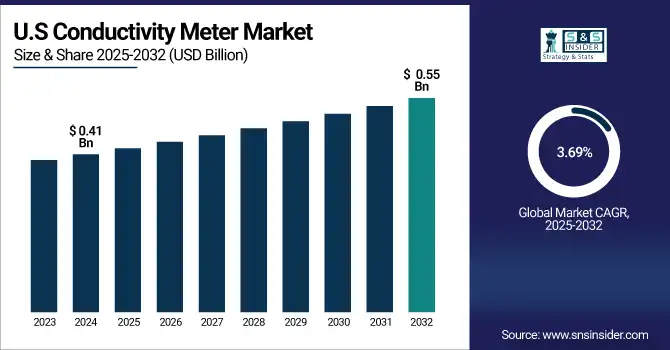
The U.S. conductivity meter market size was USD 0.41 billion in 2024 and is expected to reach USD 0.55 billion by 2032, expanding at a CAGR of 3.69% over the forecast period of 2025–2032.
The U.S. market for conductivity meters is set to experience a steady rise as demand for accurate water quality analysis in numerous industries grows. Developments in sensor technology and digital integration are boosting measurement accuracy and efficiency. Enforcing environmental standards and implementation of automation in production processes add to the market growth over the forecast period.
According to the U.S. Geological Survey (USGS), 34 billion gallons of municipal wastewater are collected daily in the United States, necessitating extensive treatment processes to ensure environmental safety.
Conductivity Meter Market Dynamics:
Key Drivers:
-
Rising Demand for Accurate Water Quality Monitoring Across Industries Fuels Growth in the Market
Rising awareness for water quality management in various industries, such as waste water treatment, pharmaceuticals, and food & beverage, is driving the market for the conductivity meters. Increasing stringent environmental regulations and the necessity to adhere to regulatory standards are driving industries to employ more sophisticated solutions for water monitoring. Conductivity meters, from determining the purity of water to salinity to chemical composition, conductivity meters are both a cost-effective and accurate way to measure changes in water quality that can affect everything from revenue to the safety of products and compliance with environmental regulations.
According to the World Health Organization the electrical conductivity of drinking water should not exceed 400 μS/cm (0.4 mS/cm) to ensure safety and palatability.
Restraints:
-
Limited Awareness and Understanding of Conductivity Meter Benefits Hinders Market Growth in Developing Regions
Lack of awareness and knowledge about the advantages of the conductivity meters in various developing regions is a major factor impeding the market expansion. In these areas, industries may not realize the significance in measuring water quality accurately, or may simply be using archaic technologies to check for conductivity. The lack of awareness regarding the benefits of using such products requiring higher accuracy and speed, is limiting the sales of conductivity meters. Moreover, the lack of education or marketing campaigns contribute to the slow adoption of advanced measurement solutions and consequently decreasing penetration in these regions.
Opportunities:
-
Integration of Conductivity Meters with IoT and Automation Solutions Offers Growth Potential
Conductivity meters linked to the Internet of Things (IoT) and automation systems is another factor providing ample growth prospects for the market. Additionally, conductivity meters that are IoT-enabled can offer real-time monitoring and remote diagnostics and automated data logging, which makes them more attractive to those industries, which are looking to increase efficiency and performance, and reduce downtime. For instance, industrial automation in wastewater treatment, chemical industry, or food manufacturing can significantly profit from these high-end tools by providing improved decision making and superior system reliability. Ongoing data acquisition and immediate refinements increase operating efficacy and lower cost, leading to greater precision, and market growth and innovation.
Challenges:
-
Lack of Skilled Personnel to Operate Advanced Conductivity Meter Systems in Emerging Markets Challenge Growth
There is a lot of shortage of trained staff to work with and maintain modern conductivity meters, particularly in developing countries. Conductivity Meters including IoT and automation enable one’s need for expertise in calibration, troubleshooting, and data analysis. In areas where access is limited to training programs, this deficiency in skills impedes the wider adoption and appropriate use of the technology. Without the relevant expertise, industries could suffer from operational inefficiencies, downtime, and imprecisions, which slow the market progress. In addition, the shortage of trained personnel makes the companies dependent on outside help, which is costly and hinders the introduction of more modern monitoring approaches.
Conductivity Meter Market Segment Analysis:
By Type
The portable conductivity meters segment led the market with 71.83% share in 2024 as they are easy to use, portable, and suitable for field applications. They are becoming increasingly popular in environmental monitoring, agriculture, and point-of-care industrial assays. New features, such as USB data logging and auto-lock, present in products, such as Trans Instruments’ WalkLAB HC9021, are resulting in greater user efficiency. An additional incentive for their use is the inclusion of wireless and internet of thing (IoT) functionalities, which allows real-time monitoring and space-use that comply with environmental requirements. While diverse industries make accurate and versatile water quality testing more popular, the portable meters are projected to hold a leading position in the conductivity meter market.
The in- line conductivity meters segment is estimated to witness the fastest CAGR of 7.95% during 2025-2032 on account of rising requirement for real-time monitoring in automated industrial processes. These meters are vital in real-time adjustment of conductivity (electrolyte concentration) in industries, such as water treatment, food processing and pharmaceuticals. Major players including Thermo Fisher Scientific and Endress+Hauser are developing models that accommodate multi-parameter measurement and easy integration with automation. The growing development of Industry 4.0 and stricter regulations is likely to speed up the adoption of in-line conductivity meter and in turn the focal point of increasing the process reliability and the operational efficiency through in-line conductivity meters is expected to gain attraction.
By End-user
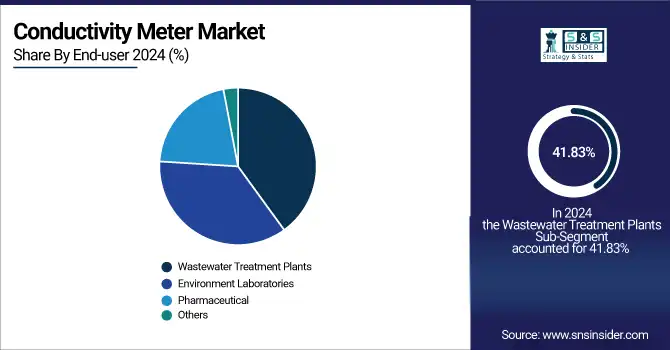
The Wastewater Treatment Plants segment dominated in the conductivity meter market in 2024, accounting for 41.83% share of the total revenue. The demand for accurate water quality assessment to satisfy the stricter environmental regulations encourage this domination. Xylem Inc. grown its solution base through targeted acquisitions including Evoqua Water Technologies increasing its competency to deliver significantly advanced water treatments. Improvements, such as Sensorex’s Chemical Resistant Toroidal Conductivity Sensor, developed for severe chemical environments, are also fostering conductivity meter industry development. The incorporation of such sophisticated technologies allows for effective monitoring and enforcement, further establishing the segment with market dominance.
The pharmaceutical segment is anticipated to witness the fastest CAGR of 6.91% between 2025 and 2032 due to the strict quality standards and growing demand for ultrapure water in the manufacturing of drugs. Where aseptic production areas and strict demand for clean room processes are a high priority, accurate conductivity measurement is another necessity. Conductivity meter market companies, such as ABB, Emerson Electric Co. and HORIBA are growing their range of products with smart, compact and ultra-sensitive meters with capabilities for real-time data tracking and digital calibration. These improvements enabling pharma manufacturers to increase process control, decrease the risk of contamination and gain compliance with global regulatory requirements, and are driving growth of the segment in the market.
Conductivity Meter Market Regional Outlook:
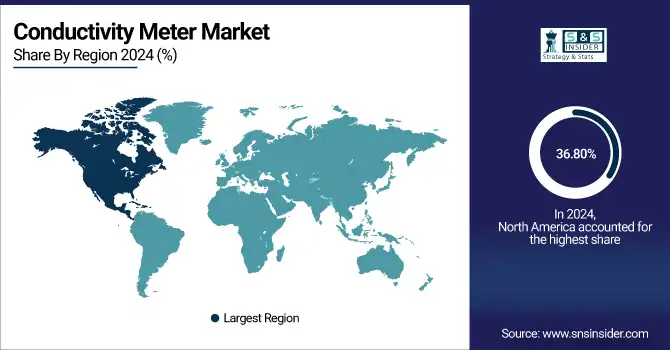
North America led the market in 2024, contributing to a 36.80% share, which was the highest proportion of revenue, in 2024, due to stringent environmental norms and technological progress. The region’s industries, which include water treatment and pharmaceuticals, are significant players in this growth. Greater requirement of precision water quality monitoring tools to meet the regulatory standards is still providing momentum to the market growth. The adoption of new technologies is a key factor in improving efficiency and meeting environmental regulations, and the availability of next-generation conductivity meters has become a valuable asset.
Get Customized Report as per Your Business Requirement - Enquiry Now
The U.S. dominates the North American market as it has well-developed industries, such as water treatment, pharmaceuticals, and environmental monitoring. The strict regulations in the country and emphasis on sustainability and efficiency in operations also fuel the uptake of sophisticated conductivity meters, locking its market position.
Asia Pacific is expected to expand at a fastest CAGR of 7.14% from 2025 to 2032 on account of the fast pace of industrialization, urbanization, and surge in investments in water treatment infrastructure. As environmental awareness and legislation become more stringent, there is a need for accurate water quality monitoring systems. This factor is expected to lead to the increased acceptance of sophisticated conductivity meters resulting in the market growth of the region.
China leads the Asia Pacific market due to its fast-paced industrial growth and heavy investments in water treatment and environmental management. The robust manufacturing industry of the country, along with stringent regulatory standards for water quality monitoring, creates demand for high-end conductivity meters in multiple industries.
Europe has a strong conductivity meter market share in the global market due to stringent environmental regulations, industrial requirements, and sustainability initiatives. Top nations, such as Germany, the U.K., and France focus on water treatment, pharmaceuticals, and food processing. Digital interfaces and wireless connectivity are some of the technological developments that further enhance conductivity meter market growth.
Germany dominates the market for conductivity meters in Europe due to its highly developed industrial segments, such as water treatment and pharmaceuticals. Germany's high environmental regulations and technology advancements, coupled with excellent sustainability focus, are the key reasons for its market leadership.
In Middle East & Africa, the UAE, and Saudi Arabia hold the highest share in the conductivity meter market with the fast-paced infrastructure development and emphasis on water treatment and environmental management. In Latin America, Brazil is the leader in the market with its massive water management and agriculture sectors, followed by Argentina with high growth rate.
Conductivity Meter Companies are:
Major players operating in the conductivity meter market are OMEGA Engineering, Baumer, ThermoFisher Scientific, DKK-TOA Corporation, Emerson Automation Solutions, Anderson-Negele, JUMO, Foerster Instruments, ABB, and ATLANA.
Recent Development:
-
June 2024, JUMO introduced the JUMO digiLine CR HT10, enabling connection of conductive conductivity sensors to the intelligent and bus-capable JUMO digiLine system with IO-Link interface.
-
December 2024, DKK-TOA Corporation offers the CM-31P-W portable conductivity meter, designed for pure water measurement with a wide measurement range and waterproof structure.
| Report Attributes | Details |
|---|---|
| Market Size in 2024 | USD 1.70 Billion |
| Market Size by 2032 | USD 2.63 Billion |
| CAGR | CAGR of 5.64% From 2025 to 2032 |
| Base Year | 2024 |
| Forecast Period | 2025-2032 |
| Historical Data | 2021-2023 |
| Report Scope & Coverage | Market Size, Segments Analysis, Competitive Landscape, Regional Analysis, DROC & SWOT Analysis, Forecast Outlook |
| Key Segments | •By Type (Bench-Top Conductivity Meters, Portable Conductivity Meters, In-Line Conductivity Meters) •By End User (Wastewater Treatment Plants, Environment Laboratories, Pharmaceutical, Others) |
| Regional Analysis/Coverage | North America (US, Canada, Mexico), Europe (Germany, France, UK, Italy, Spain, Poland, Turkey, Rest of Europe), Asia Pacific (China, India, Japan, South Korea, Singapore, Australia, Rest of Asia Pacific), Middle East & Africa (UAE, Saudi Arabia, Qatar, South Africa, Rest of Middle East & Africa), Latin America (Brazil, Argentina, Rest of Latin America) |
| Company Profiles | OMEGA Engineering, Baumer, ThermoFisher Scientific, DKK-TOA Corporation, Emerson Automation Solutions, Anderson-Negele, JUMO, Foerster Instruments, ABB, ATLANA. |
Frequently Asked Questions
North America dominated the Conductivity Meter Market in 2024.
Portable Conductivity Meters segment dominated the Conductivity Meter Market.
The major growth factor of the Conductivity Meter Market is the increasing demand for accurate water quality monitoring across industries.
The Conductivity Meter Market size was USD 1.70 billion in 2024 and is expected to reach USD 2.63 billion by 2032.
The Conductivity Meter Market is expected to grow at a CAGR of 5.64% from 2025-2032.
Get in Touch
