Vehicle Analytics Market Size & Overview:
Get More Information on Vehicle Analytics Market - Request Sample Report
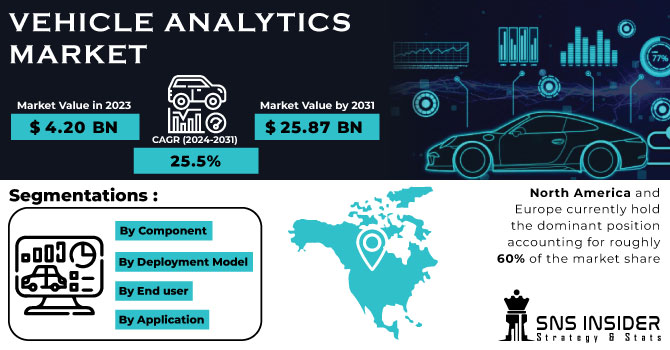
The Vehicle Analytics Market Size was valued at USD 4.20 billion in 2023, and expected to reach USD 25.87 billion by 2031, and grow at a CAGR of 25.5% over the forecast period 2024-2031.
Driven by the ever-growing presence of connected vehicles, the Vehicle Analytics Market is experiencing a surge in demand. A 2023 study revealed that 91.9% of new cars sold in the US were equipped with connectivity features, highlighting the rapid shift towards data-driven automobiles. This translates to a vast amount of real-time information being collected, including vehicle location, engine performance, and driver behaviour. Capitalizing on this data deluge, fleet management companies are witnessing a significant rise in demand for analytics solutions. According to the predictive analysis done by SNS Insider, it estimates that by 2025, over 70% of fleet operators will leverage vehicle analytics to optimize routes, reduce fuel consumption, and ensure preventative maintenance.
Government initiatives like the European Union's mandate for emergency SOS systems in all new vehicles from 2020 are further promoting the market. These regulations necessitate advanced analytics capabilities to process data from emergency calls and deploy assistance effectively. As the focus on safety and efficiency intensifies, vehicle analytics is poised to become an indispensable tool for various stakeholders in the automotive landscape.
MARKET DYNAMICS:
KEY DRIVERS:
-
The growing requirement for real-time analysis of data received from sensors and GPS tracking devices is a major driver
-
Another key element fueling the growth of the vehicle analytic market is technological advances
-
Use of cloud-based technology for smart fleet management systems is increasing.
The vehicle analytics market is witnessing a rise in cloud-based smart fleet management systems. This technology allows fleet managers to leverage real-time data for improved decision-making. Studies show a significant rise in adoption, with a projected growth of 17.91% in the Asia-Pacific region alone. This trend is driven by government initiatives promoting fuel efficiency and environmental sustainability. For instance, regulations mandating lower carbon emissions are pushing fleet operators towards cloud-based solutions that optimize routes and fuel consumption.
RESTRAINTS:
-
The market's growth is hampered by high installation costs and data security concerns
-
Growing concerns about cybersecurity could stifle market expansion
OPPORTUNITIES:
-
More advanced technologies are being implemented
-
To obtain a competitive advantage, market participants are forming strategic relationships with OEMs, insurers, and fleet operators
-
Semi-autonomous and autonomous vehicles are gaining popularity
-
One of the factors likely to boost market expansion is a rise in demand from developing countries.
Consumer demand for these vehicles is driven by a focus on safety. Technologies like automatic emergency braking and lane departure warnings are making the way for a future with fewer accidents. Additionally, studies suggest autonomous vehicles can improve fuel efficiency by up to 20%, aligning with government initiatives for sustainable transportation.
CHALLENGES:
-
High installation costs
-
long-term requirements in vehicle analytic systems
-
The ongoing need to upgrade vehicle analytic systems
IMPACT OF RUSSIA UKRAINE WAR:
Disruptions in the supply chain, particularly for parts sourced from Ukraine and Russia, led to a significant decrease in vehicle production. LMC Automotive experienced a 400,000 unit drop in global production in 2022, a shortfall of nearly 8% from potential sales. This, coupled with rising material costs due to the war and sanctions, inflated new car prices by double digits.
Consumer demand also dipped as these price hikes coincided with increasing fuel costs and interest rates. While the exact figures are still emerging, analysts predict a potential demand decline of 5-10% in 2022, further pressuring the Vehicle Analytics market. This market relies on new vehicle sales for data collection and development, and the slowdown has hampered its growth potential.
IMPACT OF ECONOMIC SLOWDOWN:
An economic slowdown can cause intense effect within the Vehicle Analytics Market. Consumer spending on new vehicles plummets by as much as 20% during such periods, mirroring the decline witnessed in the past recession. This directly translates to a reduced demand for advanced in-vehicle features that rely on analytics, like connected car services and driver monitoring systems. Furthermore, businesses tighten their budgets, leading to a potential 15% dip in investments for fleet management solutions that utilize vehicle analytics for route optimization and fuel efficiency.
However, this slowdown can also present an opportunity. As car sales stagnate, existing vehicles stay on the road longer, creating a potential upsurge in demand for aftermarket analytics solutions that diagnose maintenance issues and extend vehicle lifespan. This can help the Vehicle Analytics Market weather the economic storm and make the way for future growth.
Market Segmentation:
By Application:
-
Predictive Maintenance
-
Warranty Analytic
-
Usage-based Insurance
-
Safety and Security Management
-
Driver and User Behaviour Analysis
-
Dealer Performance Analysis
-
Road Charging
By Component:
-
Software
-
Services
Software, often including diagnostic tools and data visualization platforms, hold a larger market share around 60% due to its scalability and potential for recurring revenue. Services, which include data analysis and consultation, might constitute the remaining 40%, but offer higher margins due to the specialized expertise they provide.
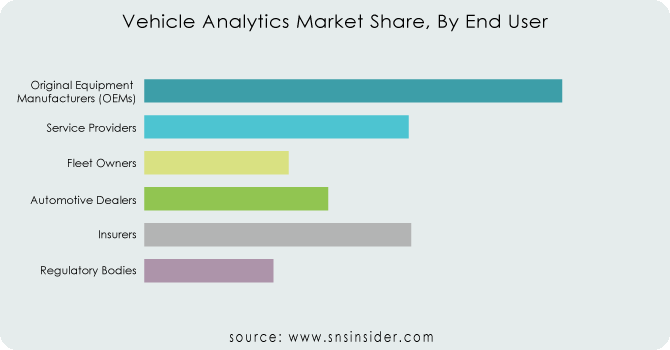
By End user:
-
Original Equipment Manufacturers (OEMs)
-
Service Providers
-
Fleet Owners
-
Automotive Dealers
-
Insurers
-
Regulatory Bodies
The vehicle analytics market provides to a diverse range of end-users, each with distinct needs. Original Equipment Manufacturers (OEMs), holding the largest share around 31%, leverage analytics to improve vehicle design, optimize logistics, and enhance customer service. Fleet owners, the fastest-growing segment projected CAGR exceeding 26%, utilize analytics to optimize fuel efficiency, track driver behaviour, and streamline maintenance schedules.
Conversely, automotive dealers hold approximately 10% share focus on sales performance analysis, while insurers hold around 15% share employ analytics for risk assessment and usage-based insurance programs. Regulatory bodies hold approximately 8% share utilize vehicle data to monitor safety compliance and enforce emission regulations.
Get Customized Report as per your Business Requirement - Request For Customized Report
By Deployment Model:
-
On-Premises
-
On-Demand
On-premises solutions reside on a company's own servers, offering greater control over data security. However, this approach requires significant upfront investment in hardware and IT expertise for maintenance. On the other hand, on-demand, or cloud-based, solutions offer scalability and remote accessibility at a lower upfront cost. This flexibility, coupled with the growing popularity of cloud services, is expected to drive significant market share. Industry forecasts predict the on-demand segment to hold around 84% of the total market value by 2031, compared to a diminishing share for on-premises solutions.
REGIONAL ANALYSIS:
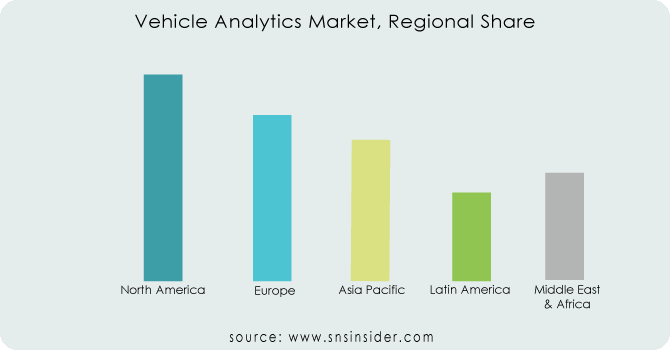
The vehicle analytics market is a scene of dynamic regional growth. While North America and Europe currently hold the dominant position, accounting for roughly 60% of the market share, a significant shift is underway. The Asia-Pacific region, driven by the expanding automotive industries in China growing at a 25% CAGR and India with 30% CAGR, is anticipated to be the fastest growing market, reaching nearly 23% of the global share by 2031. This rapid rise is driven by factors like a growing appetite for high-tech vehicles, government initiatives promoting connected car technology, and the expanding 5G network infrastructure.
Southeast Asian nations are also expected to contribute significantly, with the ASEAN bloc projected to witness a collective CAGR of 27%.
REGIONAL COVERAGE:
North America
-
US
-
Canada
-
Mexico
Europe
-
Eastern Europe
-
Poland
-
Romania
-
Hungary
-
Turkey
-
Rest of Eastern Europe
-
-
Western Europe
-
Germany
-
France
-
UK
-
Italy
-
Spain
-
Netherlands
-
Switzerland
-
Austria
-
Rest of Western Europe
-
Asia Pacific
-
China
-
India
-
Japan
-
South Korea
-
Vietnam
-
Singapore
-
Australia
-
Rest of Asia Pacific
Middle East & Africa
-
Middle East
-
UAE
-
Egypt
-
Saudi Arabia
-
Qatar
-
Rest of the Middle East
-
-
Africa
-
Nigeria
-
South Africa
-
Rest of Africa
-
Latin America
-
Brazil
-
Argentina
-
Colombia
Rest of Latin America
KEY PLAYERS:
SAP SE (Germany), Genetec (Canada), Microsoft Corporation (US), IBM Corporation (US), Inseego (US), CloudMade (Ukraine), Agnik LLC (US), Intelligent Mechatronic Systems (Canada), Harman International Industries, Inc. (US), Teletrac Navman (US), Inquiron (US), Automotive Rentals (US), and others are among the leading players in the vehicle analytics market.
RECENT DEVELOPMENTS:
-
Major players like IBM [IBM] with its Maximo Asset Management solution and Microsoft with Azure Fleet Management are heavily investing in AI and ML for predictive maintenance and optimized fleet operations.
-
Cloud-based Analytics Platforms: Companies like Oracle with its Oracle IoT Cloud and SAP with SAP Vehicle Management are offering cloud-based platforms for collecting and analyzing vehicle data, enabling better scalability and accessibility.
-
Integration with Telematics and Connected Vehicles: Players like Verizon with their Verizon Connect platform and Harman [Harman] with its connected car solutions are integrating vehicle analytics with telematics data to provide a more holistic view of vehicle performance and driver behavior.
Microsoft Corporation (US)-Company Financial Analysis
| Report Attributes | Details |
|---|---|
| Market Size in 2023 | US$ 4.20 Billion |
| Market Size by 2031 | US$ 25.87 Billion |
| CAGR | CAGR of 25.5% From 2024 to 2031 |
| Base Year | 2023 |
| Forecast Period | 2024-2031 |
| Historical Data | 2020-2022 |
| Report Scope & Coverage | Market Size, Segments Analysis, Competitive Landscape, Regional Analysis, DROC & SWOT Analysis, Forecast Outlook |
| Key Segments | by Application (Predictive Maintenance, Warranty Analytic, Traffic Management, Usage-based Insurance, Safety and Security Management, Infotainment Driver and User Behaviour Analysis, Dealer Performance Analysis, Road Charging), by Component (Software, Services), by End user (Original Equipment Manufacturers (OEMs), Service Providers, Fleet Owners, Automotive Dealers, Insurers, Regulatory Bodies), By Deployment Model (On-Premises, On-Demand) |
| Regional Analysis/Coverage | North America (US, Canada, Mexico), Europe (Eastern Europe [Poland, Romania, Hungary, Turkey, Rest of Eastern Europe] Western Europe] Germany, France, UK, Italy, Spain, Netherlands, Switzerland, Austria, Rest of Western Europe]), Asia Pacific (China, India, Japan, South Korea, Vietnam, Singapore, Australia, Rest of Asia Pacific), Middle East & Africa (Middle East [UAE, Egypt, Saudi Arabia, Qatar, Rest of Middle East], Africa [Nigeria, South Africa, Rest of Africa], Latin America (Brazil, Argentina, Colombia, Rest of Latin America) |
| Company Profiles | SAP SE (Germany), Genetec (Canada), Microsoft Corporation (US), IBM Corporation (US), Inseego (US), CloudMade (Ukraine), Agnik LLC (US), Intelligent Mechatronic Systems (Canada), Harman International Industries, Inc. (US), Teletrac Navman (US), Inquiron (US), Automotive Rentals (US), and others are among the leading players in the vehicle analytics market. |
| Key Drivers | • The growing requirement for real-time analysis of data received from sensors and GPS tracking devices is a major driver. • Another key element fueling the growth of the vehicle analytic market is technological advances. • Use of cloud-based technology for smart fleet management systems is increasing. |
| RESTRAINTS | The market's growth is hampered by high installation costs and data security concerns. Growing concerns about cybersecurity could stifle market expansion. |
Frequently Asked Questions
Ans:- North American region is anticipated to be the primary driver of the market.
Ans:- Yes.
Ans:- By End User, the OEMs category is anticipated to gain traction throughout the projected period and dominate the worldwide Vehicle Analytics market.
Ans:- The global market for automotive analytics is strongly influenced by the affordability and cloud-based nature of this technology.
Ans:- The market size is expected to reach USD 25.87 billion by 2031.
Get in Touch
