image

Water Pump Market Size, Share & Segmentation, By Type (Centrifugal Pumps and Positive Displacement Pumps), Business (Pumps and Aftermarket [Parts & Components, Repair & Maintenance]), Distribution Channel (Direct Sales, Distributor Sales and Online Sales & E-Commerce), End-Use (Municipal, Construction, Agriculture, Mining, Oil & Gas, Industrial, and Others), and Region | Global Forecast for 2025-2032

Date: June 2025 Report Code: SNS/EQIP/7408 Page 260

Water Pump Market Report Scope & Overview:

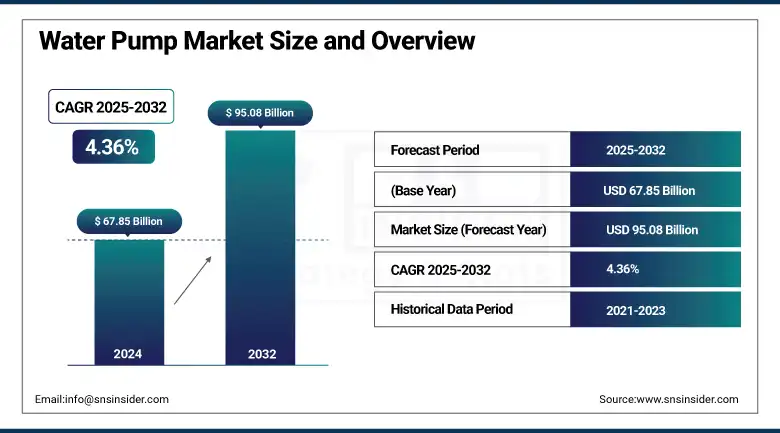
The water pump market size was valued at USD 67.85 billion in 2024 and is expected to reach USD 95.08 billion by 2032, growing at a CAGR of 4.36% over the forecast period of 2025-2032.

The global water pump market growth is driven by the demand for efficient water management systems across the agriculture, industrial, and municipal sectors. Trends are determined largely through technological advancements, increasing urbanization, and infrastructure development. The report further provides a thorough Water Pump Market Analysis of this business sphere, alongside emerging opportunities, competitive landscape, and innovations around energy-efficient and sustainable water solutions.

“For instance, in February 2024, KSB is adding high-efficiency water pumps to its portfolio, improving performance in water supply and pressure boosting applications for municipal and industrial customers.”

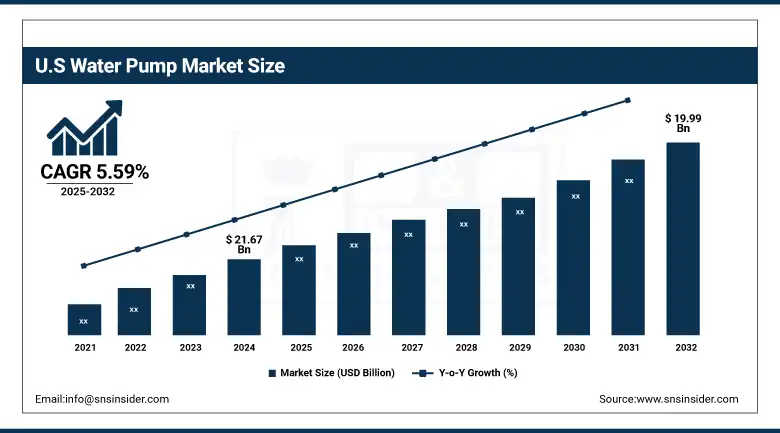
The U.S. water pump market size was valued at USD 21.67 billion in 2024 and is expected to reach USD 19.99 billion by 2032, growing at a CAGR of 5.59% over the forecast period of 2025-2032.

The trends in the U.S. water pump market signify an increasing implementation of energy-efficient and smart pump systems in agriculture, construction, and municipal sectors. The increasing demand, owing to rising infrastructure upgrades, concerns over water procession and sustainability, promulgating green building mandates are prompting key companies to engage in innovation to come up with effective water pumps solutions.

Market Dynamics:

Drivers:

  • Increasing Adoption of Smart Irrigation Systems and Infrastructure Modernization Drives the Water Pump Market Growth

Smart irrigation technologies are expected to be integrated into agriculture, along with modernization plans of municipal infrastructure that are playing an important role in driving the growth of the market. Efficient water management systems are being pursued by governments globally, particularly in developing regions, which are expected to drive the demand for water pumps. Electric water pumps provide energy efficiency, high reliability, and low maintenance costs, which is driving the popularity of electric water pumps in the market. These developments are in line with the water pump market trends that are obtained through the help of stages of sustainable water use. The growing trend provides high scope for water pump companies to expand their portfolio and exploit developing Technology.

“In March 2025, Flowserve introduces next-generation energy-efficient and high-performance water pumps for municipal and industrial applications to support clean water needs and sustainability targets globally.”

  • Rising Industrialization and Demand for High-Efficiency Pumping Solutions Accelerate the Centrifugal Water Pump Industry

Increased industrialization within various sectors, comprising manufacturing, mining, and construction, has propelled the demand for effective water handling systems. As this demand boom occurs, the centrifugal water pump industry profits also benefit, due to rising demand for quality solutions that can handle different flow rates and types of brittle fluid. This is especially the case in areas with growing industrial landscapes and water-dependent uses. The clean water delivery systems are also being upgraded, adding centrifugal pumps for operational sustainability and reliability. Considering the trends of global industrial pumps usage, the continued technological innovations and cost-effective pumping solutions will be the foundation for ongoing adoption, as revealed by the water pump market analysis.

Restraints:

  • High Operational and Maintenance Costs of Advanced Pumping Systems May Hinder Market Expansion in Developing Regions

Even with new advancements in technology that allow for lower power water pumping systems, the cost of development and then ongoing systems are still high, putting a barrier to entry for large-scale plants in price-sensitive markets. In developing countries where the budgets are tight and there is not much technical infrastructure, deployment of complex solutions usually takes a long time. This hinders penetration in the market and slows down the general adoption. In addition, skilled manpower required for the operations and maintenance of these systems is not always available easily. Together, these drivers affect the overall market growth, and while there is a push for modernization and sustainability on the global stage, it proves difficult for water pump companies to penetrate new and emerging economies.

Segmentation Analysis:

By Type

In 2024, the Centrifugal Pumps segment generated the highest revenue share of approximately 65.22% in the water pump market as they are simple and efficient, and they can manage high flow rates, which makes them the most preferred kind of pumps in residential, agricultural, and municipal sectors. Since centrifugal pumps are indispensable components of clean water delivery systems and they provide constant water flow at lower operational costs.  In addition, water pump companies have more rapidly optimized centrifugal pumps in response to growing demands for sustainable and cost-effective pumping technologies.

The positive displacement pumps segment is expected to grow at a considerable CAGR of nearly 4.27% over 2025–2032. The slip ring market is benefiting from expanded demand in applications that revolve around dealing with viscous, abrasive, or chemically reactive fluids, such as the pharmaceuticals, oil & gas sectors. But it also includes pumps designed to achieve precise flow control irrespective of pressure differences, which are vital in complex systems. The typology is moving toward electric water pumps as a result of technological advancements and the desire for high-functioning solutions in niche applications.

By Business

The pumps segment accounted for the largest revenue share, being 59% in 2024 as water pumps find extensive applications in major end-use industries such as agriculture, residential, and utilities. The companies in the water pumps market are pushing for the development of variations of electric water pumps for improved efficiency, reliability, and sustainability. In addition to proving that they dominate the market with the fact that they can easily be directly used in the clean water delivery systems, which will lend itself to their domination in markets in North America that are facing water shortages or markets needing irrigation solutions, or even wastewater management solutions.

The aftermarket segment is expected to experience rapidly expanding growth from 2025–2032. This growth is supported by the expanding installation base of water pumps, which creates demand for maintenance, parts replacements, and upgrades as they age. With aging systems, efficiency decreases while the need for retrofit solutions increases. End users are focusing on operational continuity and energy savings, leading to growth in the aftermarket as per a water pumps market analysis. Increasing environmental regulations will drive the demand for sustainable electric water pumps, which in turn will spur aftermarket services.

By Distribution Channel

Direct sales generated the most revenue in 2024. With this channel, water pump companies can sell customized solutions, exercise better price control, and provide timely technical support. Project-specific electric water pump delivery creates a solid customer base, brand value, and loyalty. In particular, clean water delivery systems projects require a high level of technical accuracy and need on-the-spot guidance to ensure the success of the project and the sustained, reliable performance over time.

Distributor sales segment to grow fastest by 2025–2032. The growing demand for water pumps in rural and emerging markets has helped the water pumps to grow. With the growing infrastructure development in remote and rural areas, localized distribution networks enable greater product availability and faster delivery, as suggested by water pump market trends. Distributors, similarly, provide local education, increasing adoption rates. Distributor partnerships will be essential for water pump companies to reach the underserved regions of the globe where they are expanding.
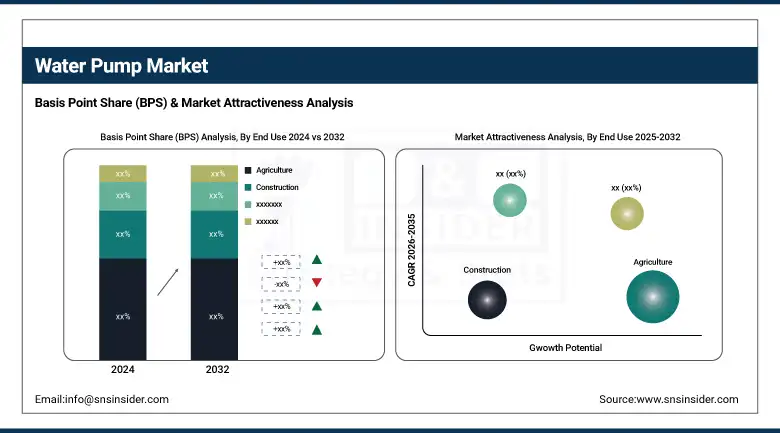
By End-Use

As of 2024, the largest revenue share of the water pump market was held by the agriculture sector. This dominance is mainly attributed to the importance of water pumps to irrigation and drainage systems. As the world is increasingly emphasising food security along with water conservation, farmers are now leaning towards Electric water pumps for optimum water usage. Water pump companies have started catering to this segment by providing high-durable, energy-efficient, clean water/drought delivery systems, which are getting more attention, especially in water-stressed areas.

The Industrial vertical is anticipated to register a healthy CAGR over 2025-2032. The reason for this growth is attributed to the increasing demand for water in the manufacturing, energy, and chemical processing sectors. Increasing industrial infrastructure development across the globe, especially in the Asia Pacific and North America region, is anticipated to boost the demand for its manufacturing sector. The water pump market analysis shows that electric water pumps are increasingly adopted, especially automated and smart electric water pumps, which help in increasing the efficiency of the process and minimizing the downtime. As industries turn towards more sustainable operational models, the need for efficient pumping systems will continue to grow steadily.
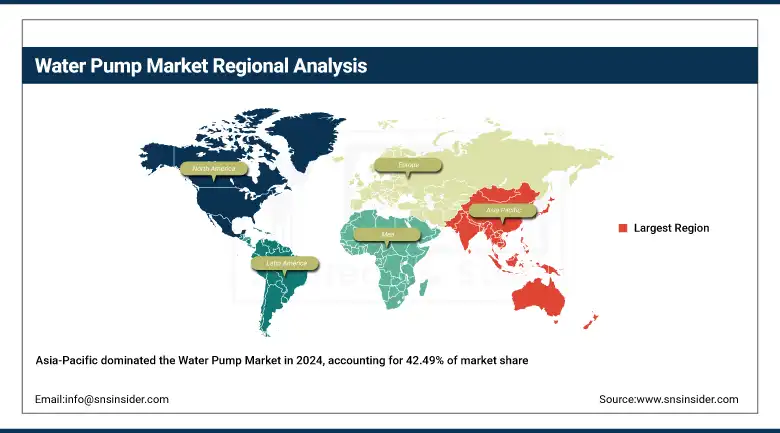
Regional Analysis:

The Asia Pacific water pump market accounted for the largest revenue share, approximately 42.49%, which can be attributed to the rapid urbanization, growth in cultivation, and large-scale infrastructure development in countries including China, India, and the regional nations of Southeast Asia. Pump ownership and adoption have rapidly increased since the Indian government launched local-level groundwater governance initiatives linking water conservation with irrigation planning. Moreover, the high availability of essential water pump companies and increased demand for clean water delivery systems and electric water pumps from residential and industrial end-users are further factors enabling the region to retain its leading position in the global water pumps market.

North America is expected to register a relatively steady CAGR of approximately 5.95%, owing to the growing investments in the refurbishment of aged water infrastructure, surging industrial activities across the region, and a growing focus on energy-efficient technologies. High focus on sustainable solutions has propelled the growth of advanced electric water pumps in the region. North America is experiencing a similar upward trend, with a growing inclination toward automation and smart pumping systems, along with government regulations on clean water access and improved industrial efficiency.

Rising demand for energy-efficient solutions & sustainable clean water delivery systems is fuelling the growth of the European water pump market. The region itself is led by none other than Germany, thanks to its sophisticated industrial plant. For instance, one of the inventions is the Electric water pumps, which are smart and use the IOT to connect and monitor performance remotely, providing a quick solution to improve operational efficiency in municipal and industrial applications.

Key Players:

The major companies operating in the market are KSB SE & Co. KGaA, Flowserve, ITT Inc., Gorman-Rupp, Pentair, Xylem, WILO SE, Grundfos, EBARA CORPORATION, ANDRITZ AG.

Recent Developments:

  • July 2024 - Grundfos launched an innovative solar-powered water ATM solution in India, providing clean drinking water through smart dispensing technology to underserved communities, supporting sustainability and improving access to safe water.

  • January 2025 - Pentair was honored for innovation by the Business Intelligence Group, recognizing its advanced water solutions and commitment to sustainability in the water pump market.


Water Pump Market Report Scope

Report Attributes Details
Market Size in 2024 USD 67.85 Billion
Market Size by 2032 USD 95.08 Billion
CAGR CAGR of 4.36% From 2025 to 2032
Base Year 2024
Forecast Period 2025-2032
Historical Data 2021-2023
Report Scope & Coverage Market Size, Segments Analysis, Competitive  Landscape, Regional Analysis, DROC & SWOT Analysis, Forecast Outlook
Key Segments • By Type (Centrifugal Pumps, Positive Displacement Pumps)
• By Business (Pumps, Aftermarket [Parts & Components, Repair & Maintenance])
• By Distribution Channel (Direct Sales, Distributor Sales, Online Sales & E-Commerce)
• By End Use (Municipal, Construction, Agriculture, Mining, Oil & Gas, Industrial, Others)
Regional Analysis/Coverage North America (US, Canada, Mexico), Europe (Germany, France, UK, Italy, Spain, Poland, Turkey, Rest of Europe), Asia Pacific (China, India, Japan, South Korea, Singapore, Australia, Rest of Asia Pacific), Middle East & Africa (UAE, Saudi Arabia, Qatar, South Africa, Rest of Middle East & Africa), Latin America (Brazil, Argentina, Rest of Latin America)
Company Profiles KSB SE & Co. KGaA, Flowserve, ITT Inc., Gorman-Rupp, Pentair, Xylem, WILO SE, Grundfos, EBARA CORPORATION, ANDRITZ AG

Frequently Asked Questions

Ans: The Water Pump Market is expected to grow at a CAGR of 4.36% from 2025-2032.

Ans: The Water Pump Market size was USD 67.85 billion in 2024 and is expected to reach USD 95.08 billion by 2032.

Ans: The major growth factor of the Water Pump Market is the increasing demand for energy-efficient and sustainable water management solutions across agriculture, industry, and urban infrastructure.

Ans: The Centrifugal Pumps segment dominated the Water Pump Market.

Ans: Asia-Pacific dominated the Water Pump Market in 2024.

Table Of Contents

1. Introduction

1.1 Market Definition

1.2 Scope (Inclusion and Exclusions)

1.3 Research Assumptions

2. Executive Summary

2.1 Market Overview

2.2 Regional Synopsis

2.3 Competitive Summary

3. Research Methodology

3.1 Top-Down Approach

3.2 Bottom-up Approach

3.3. Data Validation

3.4 Primary Interviews

4. Market Dynamics Impact Analysis

4.1 Market Driving Factors Analysis

4.1.1 Drivers

4.1.2 Restraints

4.1.3 Opportunities

4.1.4 Challenges

4.2 PESTLE Analysis

4.3 Porter’s Five Forces Model

5. Statistical Insights and Trends Reporting

5.1 Market Production Volume, by Region (2021–2024)

5.2 Capital Investment Trends in Pump Manufacturing Facilities, by Region

5.3 Average Selling Price (ASP), by Region and Pump Type

5.4 Export/Import Volumes, by Region

6. Competitive Landscape

6.1 List of Major Companies By Region

6.2 Market Share Analysis By Region

6.3 Product Benchmarking

6.3.1 Product specifications and features

6.3.2 Pricing

6.4 Strategic Initiatives

6.4.1 Marketing and promotional activities

6.4.2 Distribution and Supply Chain Strategies

6.4.3 Expansion plans and new product launches

6.4.4 Strategic partnerships and collaborations

6.5 Technological Advancements

6.6 Market Positioning and Branding

7. Water Pump Market Segmentation By Type

7.1 Chapter Overview

7.2 Centrifugal Pumps

7.2.1 Centrifugal Pumps Market Trends Analysis (2020-2032)

7.2.2 Centrifugal Pumps Market Size Estimates and Forecasts to 2032 (USD Trillion)

7.3 Positive Displacement Pumps

7.3.1 Positive Displacement Pumps Market Trends Analysis (2020-2032)

7.3.2 Positive Displacement Pumps Market Size Estimates and Forecasts to 2032 (USD Trillion)

8. Water Pump Market Segmentation By Business

8.1 Chapter Overview

8.2 Pumps

8.2.1 Pumps Market Trends Analysis (2020-2032)

8.2.2 Pumps Market Size Estimates and Forecasts to 2032 (USD Trillion)

8.3 Aftermarket

8.3.1 Aftermarket Market Trends Analysis (2020-2032)

8.3.2 Aftermarket Market Size Estimates and Forecasts to 2032 (USD Trillion)

8.3.3 Parts & Components

8.3.3.1 Parts & Components Market Trends Analysis (2020-2032)

8.3.3.2 Parts & Components Market Size Estimates and Forecasts to 2032 (USD Trillion)

8.3.4 Repair & Maintenance

8.3.4.1 Repair & Maintenance Market Trends Analysis (2020-2032)

8.3.4.2 Repair & Maintenance Market Size Estimates and Forecasts to 2032 (USD Trillion)

9. Water Pump Market Segmentation By Distribution Channel

9.1 Chapter Overview

9.2 Direct Sales

9.2.1 Direct Sales Market Trends Analysis (2020-2032)

9.2.2 Direct Sales Market Size Estimates and Forecasts to 2032 (USD Trillion)

9.3 Distributor Sales

9.3.1 Distributor Sales Market Trends Analysis (2020-2032)

9.3.2 Distributor Sales Market Size Estimates and Forecasts to 2032 (USD Trillion)

9.4 Online Sales & E-Commerce

9.4.1 Online Sales & E-Commerce Market Trends Analysis (2020-2032)

9.4.2 Online Sales & E-Commerce Market Size Estimates and Forecasts to 2032 (USD Trillion)

10. Water Pump Market Segmentation by End-Use

10.1 Chapter Overview

10.2 Municipal

10.2.1 Municipal Market Trends Analysis (2020-2032)

10.2.2 Municipal Market Size Estimates and Forecasts to 2032 (USD Trillion)

10.3 Construction

10.3.1 Construction Market Trend Analysis (2020-2032)

10.3.2 Construction Market Size Estimates and Forecasts to 2032 (USD Trillion)

10.4 Agriculture

10.4.1 Agriculture Market Trends Analysis (2020-2032)

10.4.2 Agriculture Market Size Estimates and Forecasts to 2032 (USD Trillion)

10.5 Mining

10.5.1 Mining Market Trends Analysis (2020-2032)

10.5.2 Mining Market Size Estimates and Forecasts to 2032 (USD Trillion)

10.6 Oil & Gas

10.6.1 Oil & Gas Market Trends Analysis (2020-2032)

10.6.2 Oil & Gas Market Size Estimates and Forecasts to 2032 (USD Trillion)

10.7 Industrial

10.7.1 Industrial Market Trends Analysis (2020-2032)

10.7.2 Industrial Market Size Estimates and Forecasts to 2032 (USD Trillion)

10.8 Others

10.8.1 Others Market Trends Analysis (2020-2032)

10.8.2 Others Market Size Estimates and Forecasts to 2032 (USD Trillion)

11. Regional Analysis

11.1 Chapter Overview

11.2 North America

11.2.1 Trend Analysis

11.2.2 North America Water Pump Market Estimates and Forecasts by Country (2020-2032) (USD Trillion)

11.2.3 North America Water Pump Market Estimates and Forecasts By Type (2020-2032) (USD Trillion) 

11.2.4 North America Water Pump Market Estimates and Forecasts By Business (2020-2032) (USD Trillion)

11.2.5 North America Water Pump Market Estimates and Forecasts By Distribution Channel (2020-2032) (USD Trillion)

11.2.6 North America Water Pump Market Estimates and Forecasts by End-Use (2020-2032) (USD Trillion)

11.2.7 USA

11.2.7.1 USA Water Pump Market Estimates and Forecasts By Type (2020-2032) (USD Trillion)

11.2.7.2 USA Water Pump Market Estimates and Forecasts By Business (2020-2032) (USD Trillion)

11.2.7.3 USA Water Pump Market Estimates and Forecasts By Distribution Channel (2020-2032) (USD Trillion)

11.2.7.4 USA Water Pump Market Estimates and Forecasts by End-Use (2020-2032) (USD Trillion)

11.2.8 Canada

11.2.8.1 Canada Water Pump Market Estimates and Forecasts By Type (2020-2032) (USD Trillion)

11.2.8.2 Canada Water Pump Market Estimates and Forecasts By Business (2020-2032) (USD Trillion)

11.2.8.3 Canada Water Pump Market Estimates and Forecasts By Distribution Channel (2020-2032) (USD Trillion)

11.2.8.4 Canada Water Pump Market Estimates and Forecasts by End-Use (2020-2032) (USD Trillion)

11.2.9 Mexico

11.2.9.1 Mexico Water Pump Market Estimates and Forecasts By Type (2020-2032) (USD Trillion)

11.2.9.2 Mexico Water Pump Market Estimates and Forecasts By Business (2020-2032) (USD Trillion)

11.2.9.3 Mexico Water Pump Market Estimates and Forecasts By Distribution Channel (2020-2032) (USD Trillion)

11.2.9.4 Mexico Water Pump Market Estimates and Forecasts by End-Use (2020-2032) (USD Trillion)

11.3 Europe

11.3.1 Trend Analysis

11.3.2 Europe Water Pump Market Estimates and Forecasts by Country (2020-2032) (USD Trillion)

11.3.3 Europe Water Pump Market Estimates and Forecasts By Type (2020-2032) (USD Trillion) 

11.3.4 Europe Water Pump Market Estimates and Forecasts By Business (2020-2032) (USD Trillion)

11.3.5 Europe Water Pump Market Estimates and Forecasts By Distribution Channel (2020-2032) (USD Trillion)

11.3.6 Europe Water Pump Market Estimates and Forecasts by End-Use (2020-2032) (USD Trillion)

11.3.7 Germany

11.3.7.1 Germany Water Pump Market Estimates and Forecasts By Type (2020-2032) (USD Trillion)

11.3.7.2 Germany Water Pump Market Estimates and Forecasts By Business (2020-2032) (USD Trillion)

11.3.7.3 Germany Water Pump Market Estimates and Forecasts By Distribution Channel (2020-2032) (USD Trillion)

11.3.7.4 Germany Water Pump Market Estimates and Forecasts by End-Use (2020-2032) (USD Trillion)

11.3.8 France

11.3.8.1 France Water Pump Market Estimates and Forecasts By Type (2020-2032) (USD Trillion)

11.3.8.2 France Water Pump Market Estimates and Forecasts By Business (2020-2032) (USD Trillion)

11.3.8.3 France Water Pump Market Estimates and Forecasts By Distribution Channel (2020-2032) (USD Trillion)

11.3.8.4 France Water Pump Market Estimates and Forecasts by End-Use (2020-2032) (USD Trillion)

11.3.9 UK

11.3.9.1 UK Water Pump Market Estimates and Forecasts By Type (2020-2032) (USD Trillion)

11.3.9.2 UK Water Pump Market Estimates and Forecasts By Business (2020-2032) (USD Trillion)

11.3.9.3 UK Water Pump Market Estimates and Forecasts By Distribution Channel (2020-2032) (USD Trillion)

11.3.9.4 UK Water Pump Market Estimates and Forecasts by End-Use  (2020-2032) (USD Trillion)

11.3.10 Italy

11.3.10.1 ItalyWater Pump Market Estimates and Forecasts By Type (2020-2032) (USD Trillion)

11.3.10.2 Italy Water Pump Market Estimates and Forecasts By Business (2020-2032) (USD Trillion)

11.3.10.3 Italy Water Pump Market Estimates and Forecasts By Distribution Channel (2020-2032) (USD Trillion)

11.3.10.4 Italy Water Pump Market Estimates and Forecasts by End-Use (2020-2032) (USD Trillion)

11.3.11 Spain

11.3.11.1 Spain Water Pump Market Estimates and Forecasts By Type (2020-2032) (USD Trillion)

11.3.11.2 Spain Water Pump Market Estimates and Forecasts By Business (2020-2032) (USD Trillion)

11.3.11.3 Spain Water Pump Market Estimates and Forecasts By Distribution Channel (2020-2032) (USD Trillion)

11.3.11.4 Spain Water Pump Market Estimates and Forecasts by End-Use (2020-2032) (USD Trillion)

11.3.12 Poland

11.3.12.1 Poland Water Pump Market Estimates and Forecasts By Type (2020-2032) (USD Trillion)

11.3.12.2 Poland Water Pump Market Estimates and Forecasts By Business (2020-2032) (USD Trillion)

11.3.12.3 Poland Water Pump Market Estimates and Forecasts By Distribution Channel (2020-2032) (USD Trillion)

11.3.12.4 Poland Water Pump Market Estimates and Forecasts by End-Use (2020-2032) (USD Trillion)

11.3.13 Turkey

11.3.13.1 Turkey Water Pump Market Estimates and Forecasts By Type (2020-2032) (USD Trillion)

11.3.13.2 Turkey Water Pump Market Estimates and Forecasts By Business (2020-2032) (USD Trillion)

11.3.13.3 Turkey Water Pump Market Estimates and Forecasts By Distribution Channel (2020-2032) (USD Trillion)

11.3.13.4 Turkey Water Pump Market Estimates and Forecasts by End-Use (2020-2032) (USD Trillion)

11.3.14 Rest of Europe

11.3.14.1 Rest of Europe Water Pump Market Estimates and Forecasts By Type (2020-2032) (USD Trillion)

11.3.14.2 Rest of Europe Water Pump Market Estimates and Forecasts By Business (2020-2032) (USD Trillion)

11.3.14.3 Rest of Europe Water Pump Market Estimates and Forecasts By Distribution Channel (2020-2032) (USD Trillion)

11.3.14.4 Rest of Europe Water Pump Market Estimates and Forecasts by End-Use (2020-2032) (USD Trillion)

11.4 Asia Pacific

11.4.1 Trend Analysis

11.4.2 Asia Pacific Water Pump Market Estimates and Forecasts by Country (2020-2032) (USD Trillion)

11.4.3 Asia Pacific Water Pump Market Estimates and Forecasts By Type (2020-2032) (USD Trillion) 

11.4.4 Asia Pacific Water Pump Market Estimates and Forecasts By Business (2020-2032) (USD Trillion)

11.4.5 Asia Pacific Water Pump Market Estimates and Forecasts By Distribution Channel (2020-2032) (USD Trillion)

11.4.6 Asia Pacific Water Pump Market Estimates and Forecasts by End-Use (2020-2032) (USD Trillion)

11.4.7 China

11.4.7.1 China Water Pump Market Estimates and Forecasts By Type (2020-2032) (USD Trillion)

11.4.7.2 China Water Pump Market Estimates and Forecasts By Business (2020-2032) (USD Trillion)

11.4.7.3 China Water Pump Market Estimates and Forecasts By Distribution Channel (2020-2032) (USD Trillion)

11.4.7.4 China Water Pump Market Estimates and Forecasts by End-Use (2020-2032) (USD Trillion)

11.4.8 India

11.4.8.1 India Water Pump Market Estimates and Forecasts By Type (2020-2032) (USD Trillion)

11.4.8.2 India Water Pump Market Estimates and Forecasts By Business (2020-2032) (USD Trillion)

11.4.8.3 India Water Pump Market Estimates and Forecasts By Distribution Channel (2020-2032) (USD Trillion)

11.4.8.4 India Water Pump Market Estimates and Forecasts by End-Use (2020-2032) (USD Trillion)

11.4.9 Japan

11.4.9.1 Japan Water Pump Market Estimates and Forecasts By Type (2020-2032) (USD Trillion)

11.4.9.2 Japan Water Pump Market Estimates and Forecasts By Business (2020-2032) (USD Trillion)

11.4.9.3 Japan Water Pump Market Estimates and Forecasts By Distribution Channel (2020-2032) (USD Trillion)

11.4.9.4 Japan Water Pump Market Estimates and Forecasts by End-Use (2020-2032) (USD Trillion)

11.4.10 South Korea

11.4.10.1 South Korea Water Pump Market Estimates and Forecasts By Type (2020-2032) (USD Trillion)

11.4.10.2 South Korea Water Pump Market Estimates and Forecasts By Business (2020-2032) (USD Trillion)

11.4.10.3 South Korea Water Pump Market Estimates and Forecasts By Distribution Channel (2020-2032) (USD Trillion)

11.4.10.4 South Korea Water Pump Market Estimates and Forecasts by End-Use (2020-2032) (USD Trillion)

11.4.11 Singapore

11.4.11.1 Singapore Water Pump Market Estimates and Forecasts By Type (2020-2032) (USD Trillion)

11.4.11.2 Singapore Water Pump Market Estimates and Forecasts By Business (2020-2032) (USD Trillion)

11.4.11.3 Singapore Water Pump Market Estimates and Forecasts By Distribution Channel (2020-2032) (USD Trillion)

11.4.11.4 Singapore Water Pump Market Estimates and Forecasts by End-Use (2020-2032) (USD Trillion)

11.4.12 Australia

11.4.12.1 Australia Water Pump Market Estimates and Forecasts By Type (2020-2032) (USD Trillion)

11.4.12.2 Australia Water Pump Market Estimates and Forecasts By Business (2020-2032) (USD Trillion)

11.4.12.3 Australia Water Pump Market Estimates and Forecasts By Distribution Channel (2020-2032) (USD Trillion)

11.4.12.4 Australia Water Pump Market Estimates and Forecasts by End-Use (2020-2032) (USD Trillion)

11.4.13 Rest of Asia Pacific

11.4.13.1 Rest of Asia Pacific Water Pump Market Estimates and Forecasts By Type (2020-2032) (USD Trillion)

11.4.13.2 Rest of Asia Pacific Water Pump Market Estimates and Forecasts By Business (2020-2032) (USD Trillion)

11.4.13.3 Rest of Asia Pacific Water Pump Market Estimates and Forecasts By Distribution Channel (2020-2032) (USD Trillion)

11.4.13.4 Rest of Asia Pacific Water Pump Market Estimates and Forecasts by End-Use (2020-2032) (USD Trillion)

11.5 Middle East and Africa

11.5.1 Trend Analysis

11.5.2 Middle East and Africa Water Pump Market Estimates and Forecasts by Country (2020-2032) (USD Trillion)

11.5.3 Middle East and Africa Water Pump Market Estimates and Forecasts By Type (2020-2032) (USD Trillion) 

11.5.4 Middle East and Africa Water Pump Market Estimates and Forecasts By Business (2020-2032) (USD Trillion)

11.5.5 Middle East and Africa Water Pump Market Estimates and Forecasts By Distribution Channel (2020-2032) (USD Trillion)

11.5.6 Middle East and Africa Water Pump Market Estimates and Forecasts by End-Use (2020-2032) (USD Trillion)

11.5.7 UAE

11.5.7.1 UAE Water Pump Market Estimates and Forecasts By Type (2020-2032) (USD Trillion)

11.5.7.2 UAE Water Pump Market Estimates and Forecasts By Business (2020-2032) (USD Trillion)

11.5.7.3 UAE Water Pump Market Estimates and Forecasts By Distribution Channel (2020-2032) (USD Trillion)

11.5.7.4 UAE Water Pump Market Estimates and Forecasts by End-Use (2020-2032) (USD Trillion)

11.5.8 Saudi Arabia

11.5.8.1 Saudi Arabia Water Pump Market Estimates and Forecasts By Type (2020-2032) (USD Trillion)

11.5.8.2 Saudi Arabia Water Pump Market Estimates and Forecasts By Business (2020-2032) (USD Trillion)

11.5.8.3 Saudi Arabia Water Pump Market Estimates and Forecasts By Distribution Channel (2020-2032) (USD Trillion)

11.5.8.4 Saudi Arabia Water Pump Market Estimates and Forecasts by End-Use (2020-2032) (USD Trillion)

11.5.1.9 Qatar

                                  11.5.9.1 Qatar Water Pump Market Estimates and Forecasts By Type (2020-2032) (USD Trillion)

11.5.9.2 Qatar Water Pump Market Estimates and Forecasts By Business (2020-2032) (USD Trillion)

11.5.9.3 Qatar Water Pump Market Estimates and Forecasts By Distribution Channel (2020-2032) (USD Trillion)

11.5.1.9.4 Qatar Water Pump Market Estimates and Forecasts by End-Use (2020-2032) (USD Trillion)

11.5.10   South Africa

11.5.10.1 South Africa Water Pump Market Estimates and Forecasts By Type (2020-2032) (USD Trillion)

11.5.10.2 South Africa Water Pump Market Estimates and Forecasts By Business (2020-2032) (USD Trillion)

11.5.10.3 South Africa Water Pump Market Estimates and Forecasts By Distribution Channel (2020-2032) (USD Trillion)

11.5.10.4 South Africa Water Pump Market Estimates and Forecasts by End-Use (2020-2032) (USD Trillion)

11.5.11 Rest of Middle East & Africa

                 11.5.11.1 Rest of Middle East & Africa Water Pump Market Estimates and Forecasts By Type (2020-2032) (USD Trillion)

11.5.11.2 Rest of Middle East & Africa  Water Pump Market Estimates and Forecasts By Business (2020-2032) (USD Trillion)

11.5.11.3 Rest of Middle East & Africa Water Pump Market Estimates and Forecasts By Distribution Channel (2020-2032) (USD Trillion)

11.5.11.4 Rest of Middle East & Africa Water Pump Market Estimates and Forecasts by End-Use (2020-2032) (USD Trillion)

11.6 Latin America

11.6.1 Trend Analysis

11.6.2 Latin America Water Pump Market Estimates and Forecasts by Country (2020-2032) (USD Trillion)

11.6.3 Latin America Water Pump Market Estimates and Forecasts By Type (2020-2032) (USD Trillion) 

11.6.4 Latin America Water Pump Market Estimates and Forecasts By Business (2020-2032) (USD Trillion)

11.6.5 Latin America Water Pump Market Estimates and Forecasts By Distribution Channel (2020-2032) (USD Trillion)

11.6.6 Latin America Water Pump Market Estimates and Forecasts by End-Use (2020-2032) (USD Trillion)

11.6.7 Brazil

11.6.7.1 Brazil Water Pump Market Estimates and Forecasts By Type (2020-2032) (USD Trillion)

11.6.7.2 Brazil Water Pump Market Estimates and Forecasts By Business (2020-2032) (USD Trillion)

11.6.7.3 Brazil Water Pump Market Estimates and Forecasts By Distribution Channel (2020-2032) (USD Trillion)

11.6.7.4 Brazil Water Pump Market Estimates and Forecasts by End-Use (2020-2032) (USD Trillion)

11.6.8 Argentina

11.6.8.1 Argentina Water Pump Market Estimates and Forecasts By Type (2020-2032) (USD Trillion)

11.6.8.2 Argentina Water Pump Market Estimates and Forecasts By Business (2020-2032) (USD Trillion)

11.6.8.3 Argentina Water Pump Market Estimates and Forecasts By Distribution Channel (2020-2032) (USD Trillion)

11.6.8.4 Argentina Water Pump Market Estimates and Forecasts by End-Use (2020-2032) (USD Trillion)

11.6.9 Rest of Latin America

11.6.9.1 Rest of Latin America Water Pump Market Estimates and Forecasts By Type (2020-2032) (USD Trillion)

11.6.9.2 Rest of Latin America Water Pump Market Estimates and Forecasts By Business (2020-2032) (USD Trillion)

11.6.9.3 Rest of Latin America Water Pump Market Estimates and Forecasts By Distribution Channel (2020-2032) (USD Trillion)

11.6.9.4 Rest of Latin America Water Pump Market Estimates and Forecasts by End-Use (2020-2032) (USD Trillion)

12. Company Profiles

12.1 KSB SE & Co. KGaA

            12.1.1 Company Overview

12.1.2 Financial

12.1.3 Products/ Services Offered

12.1.4 SWOT Analysis

12.2 Flowserve

            12.2.1 Company Overview

12.2.2 Financial

12.2.3 Products/ Services Offered

12.2.4 SWOT Analysis

12.3 ITT Inc. 

            12.3.1 Company Overview

12.3.2 Financial

12.3.3 Products/ Services Offered

12.3.4 SWOT Analysis

12.4 Gorman-Rupp

            12.4.1 Company Overview

12.4.2 Financial

12.4.3 Products/ Services Offered

12.4.4 SWOT Analysis

12.5 Pentair

            12.5.1 Company Overview

12.5.2 Financial

12.5.3 Products/ Services Offered

12.5.4 SWOT Analysis

12.6 Xylem

            12.6.1 Company Overview

12.6.2 Financial

12.6.3 Products/ Services Offered

12.6.4 SWOT Analysis

12.7 WILO SE

           12.7.1 Company Overview

12.7.2 Financial

12.7.3 Products/ Services Offered

12.7.4 SWOT Analysis

12.8 Grundfos

12.8.1 Company Overview

12.8.2 Financial

12.8.3 Products/ Services Offered

12.8.4 SWOT Analysis

12.9 EBARA CORPORATION

12.9.1 Company Overview

12.9.2 Financial

12.9.3 Products/ Services Offered

12.9.4 SWOT Analysis

12.10 ANDRITZ AG

12.10.1 Company Overview

12.10.2 Financial

12.10.3 Products/ Services Offered

12.10.4 SWOT Analysis

13. Use Cases and Best Practices

14. Conclusion

An accurate research report requires proper strategizing as well as implementation. There are multiple factors involved in the completion of good and accurate research report and selecting the best methodology to compete the research is the toughest part. Since the research reports we provide play a crucial role in any company’s decision-making process, therefore we at SNS Insider always believe that we should choose the best method which gives us results closer to reality. This allows us to reach at a stage wherein we can provide our clients best and accurate investment to output ratio.

Each report that we prepare takes a timeframe of 350-400 business hours for production. Starting from the selection of titles through a couple of in-depth brain storming session to the final QC process before uploading our titles on our website we dedicate around 350 working hours. The titles are selected based on their current market cap and the foreseen CAGR and growth.


The 5 steps process:

Step 1: Secondary Research:

Secondary Research or Desk Research is as the name suggests is a research process wherein, we collect data through the readily available information. In this process we use various paid and unpaid databases which our team has access to and gather data through the same. This includes examining of listed companies’ annual reports, Journals, SEC filling etc. Apart from this our team has access to various associations across the globe across different industries. Lastly, we have exchange relationships with various university as well as individual libraries.

Secondary Research

Step 2: Primary Research

When we talk about primary research, it is a type of study in which the researchers collect relevant data samples directly, rather than relying on previously collected data.  This type of research is focused on gaining content specific facts that can be sued to solve specific problems. Since the collected data is fresh and first hand therefore it makes the study more accurate and genuine.

We at SNS Insider have divided Primary Research into 2 parts.

Part 1 wherein we interview the KOLs of major players as well as the upcoming ones across various geographic regions. This allows us to have their view over the market scenario and acts as an important tool to come closer to the accurate market numbers. As many as 45 paid and unpaid primary interviews are taken from both the demand and supply side of the industry to make sure we land at an accurate judgement and analysis of the market.

This step involves the triangulation of data wherein our team analyses the interview transcripts, online survey responses and observation of on filed participants. The below mentioned chart should give a better understanding of the part 1 of the primary interview.

Primary Research

Part 2: In this part of primary research the data collected via secondary research and the part 1 of the primary research is validated with the interviews from individual consultants and subject matter experts.

Consultants are those set of people who have at least 12 years of experience and expertise within the industry whereas Subject Matter Experts are those with at least 15 years of experience behind their back within the same space. The data with the help of two main processes i.e., FGDs (Focused Group Discussions) and IDs (Individual Discussions). This gives us a 3rd party nonbiased primary view of the market scenario making it a more dependable one while collation of the data pointers.

Step 3: Data Bank Validation

Once all the information is collected via primary and secondary sources, we run that information for data validation. At our intelligence centre our research heads track a lot of information related to the market which includes the quarterly reports, the daily stock prices, and other relevant information. Our data bank server gets updated every fortnight and that is how the information which we collected using our primary and secondary information is revalidated in real time.

Data Bank Validation

Step 4: QA/QC Process

After all the data collection and validation our team does a final level of quality check and quality assurance to get rid of any unwanted or undesired mistakes. This might include but not limited to getting rid of the any typos, duplication of numbers or missing of any important information. The people involved in this process include technical content writers, research heads and graphics people. Once this process is completed the title gets uploader on our platform for our clients to read it.

Step 5: Final QC/QA Process:

This is the last process and comes when the client has ordered the study. In this process a final QA/QC is done before the study is emailed to the client. Since we believe in giving our clients a good experience of our research studies, therefore, to make sure that we do not lack at our end in any way humanly possible we do a final round of quality check and then dispatch the study to the client.

Key Segments:

By Type

  • Centrifugal Pumps

  • Positive Displacement Pumps

By Business

  • Pumps

  • Aftermarket

  • Parts & Components

  • Repair & Maintenance

By Distribution Channel

  • Direct Sales

  • Distributor Sales

  • Online Sales & E-Commerce

By End Use

  • Municipal

  • Construction

  • Agriculture

  • Mining

  • Oil & Gas

  • Industrial

  • Others

Request for Segment Customization as per your Business Requirement: Segment Customization Request

Regional Coverage: 

North America

  • US

  • Canada

  • Mexico

Europe

  • Germany

  • France

  • UK

  • Italy

  • Spain

  • Poland

  • Turkey

  • Rest of Europe

Asia Pacific

  • China

  • India

  • Japan

  • South Korea

  • Singapore

  • Australia

  • Rest of Asia Pacific

Middle East & Africa

  • UAE

  • Saudi Arabia

  • Qatar

  • South Africa

  • Rest of Middle East & Africa

Latin America

  • Brazil

  • Argentina

  • Rest of Latin America

Request for Country Level Research Report: Country Level Customization Request

Available Customization 

With the given market data, SNS Insider offers customization as per the company’s specific needs. The following customization options are available for the report: 

  • Detailed Volume Analysis 

  • Criss-Cross segment analysis (e.g. Product X Application) 

  • Competitive Product Benchmarking 

  • Geographic Analysis 

  • Additional countries in any of the regions 

  • Customized Data Representation 

  • Detailed analysis and profiling of additional market players

Explore Key Insights 


  • Analyzes market trends, forecasts, and regional dynamics
  • Covers core offerings, innovations, and industry use cases
  • Profiles major players, value chains, and strategic developments
  • Highlights innovation trends, regulatory impacts, and growth opportunities
Request an Analyst Call