4K TV Market Size & Growth Analysis:
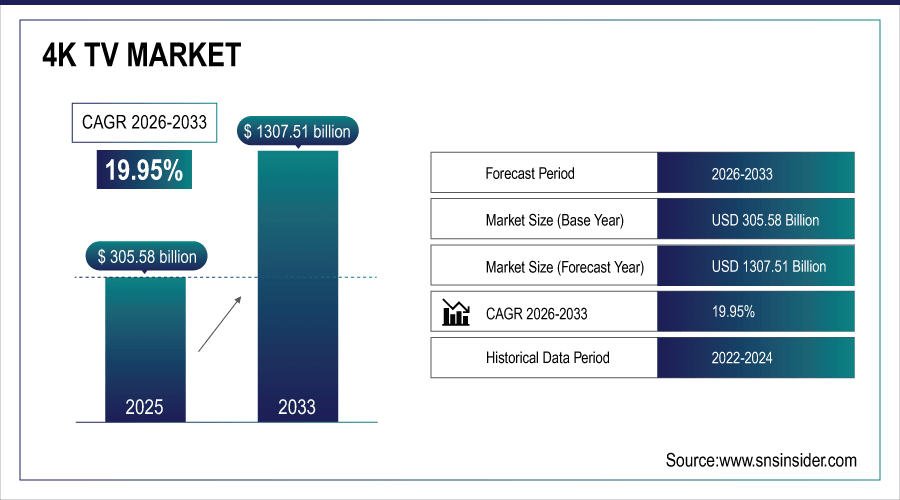
The 4K TV Market size was valued at USD 305.58 Billion in 2025E and is projected to reach USD 1307.51 Billion by 2033, growing at a CAGR of 19.95% during 2026-2033.
The 4K TV Market analysis highlights the increasing demand in the consumer market for high-definition content, coupled with improved picture quality. The market has long been led by premium brands such as Samsung, LG and Sony (clearly on show at IFA) but now these companies are joined not just in theory but in reality, by Chinese upstarts like TCL and Hisense. Technological innovations are driving the change, and sleek-looking OLED and even slimmer QLED panels and all sorts of fancy technology like HDR and high refresh rates may be enough to convince you that it’s time for an upgrade.
Over 70% of TV buyers in North America and Western Europe now prioritize 4K resolution as a baseline, with 45% opting for screen sizes 65” or larger in 2024.
To Get More Information On 4K TV Market - Request Free Sample Report
Market Size and Forecast:
-
Market Size in 2025: USD 305.58 Billion
-
Market Size by 2033: USD 1307.51 Billion
-
CAGR: 19.95% from 2026 to 2033
-
Base Year: 2025
-
Forecast Period: 2026–2033
-
Historical Data: 2022–2024
4K TV Market Trends
-
Consumers increasingly prefer 65-inch and above 4K TVs, driven by cinematic viewing experiences and affordability of bigger displays.
-
Integration of streaming platforms, AI voice assistants, and IoT features is making smart 4K TVs central to home entertainment.
-
Advanced display technologies such as OLED and QLED are gaining traction, offering superior brightness, color accuracy, and contrast ratios.
-
Online platforms dominate 4K TV sales growth, offering consumers attractive discounts, easy comparisons, and convenient doorstep delivery services globally.
-
Brands like TCL and Hisense are boosting global adoption by offering feature-rich 4K TVs at highly competitive price points.
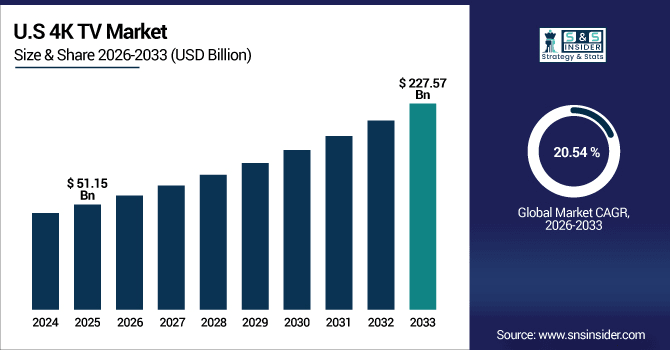
The U.S. 4K TV Market size was valued at USD 51.15 Billion in 2025E and is projected to reach USD 227.57 Billion by 2033, growing at a CAGR of 20.54 %during 2026-2033. 4K TV Market growth is driven by availability of high-definition content and premium home entertainment solutions. Quick uptake of smart TV, equipped with voice assistant and streaming apps offers user convenience. Bigger screen sizes of over 65 inches are also picking up among those who want a theatre like feel at home. Competitive prices offered by global and regional players are aiding market penetration.
4K TV Market Growth Drivers:
-
Growing Consumer Preference for Immersive Home Entertainment and Smart TV Features Accelerates 4K TV Market Expansion
The 4K TV Market growth is expanding due to heavy demand for pristine in-home cinematic experiences, with the advent of large screen sizes and streaming availability also is pushing 4K TV adoption to higher levels. Consumer appeal is further boosted with the availability of smart connectivity features, seamless integration with AI powered voice assistants and advanced display technologies such as OLED and QLED. This mix of cost, innovation and access make 4K TVs the favorite of homes worldwide.
More than 92% of 4K TVs sold in 2024 shipped with built-in AI voice assistants (Google Assistant, Alexa, Bixby), enabling 68% of users to control devices hands-free daily.
4K TV Market Restraints:
-
High Costs and Technical Complexities Restrict the Growth of the 4K TV Market
High demand is fueled by the premium pricing of high-end 4K TVs that utilize OLED or QLED technologies, however, their adoption between pricepoint-conscious consumers is suppressed. Fierce competition between local and international brands also squeezes profit margins, therefore necessitating aggressive pricing strategies. Moreover, material price volatility and supply chain issues continue to stymie seamless market growth—especially in emerging markets where affordability is an issue.
4K TV Market Opportunities:
-
Rising Penetration of E-Commerce Platforms and Emerging Markets Offer Significant Growth Potential for 4K TVs
Ecommerce portals are opening up new consumer base with lucrative offer prices, convenient product comparison and increased availability of 4K TVs across the world. Untapped gigantic market India, a rising economy with increasing disposable income, urbanization and huge appetite for high end home entertainment solutions. In addition, advances in display technologies, gaming consoles relationships and the smart ecosystem uptake are anticipated to drive growth emergence demand and long-term growth prospects.
Ecommerce enables 89% of buyers to compare 5+ models in under 10 minutes — accelerating conversion, with 72% citing “price transparency” as the top reason for online purchase. Cross-border ecommerce for 4K TVs grew 30% YoY in 2024, especially in Southeast Asia and Latin America, where local availability was previously limited.
4K TV Market Segment Analysis
-
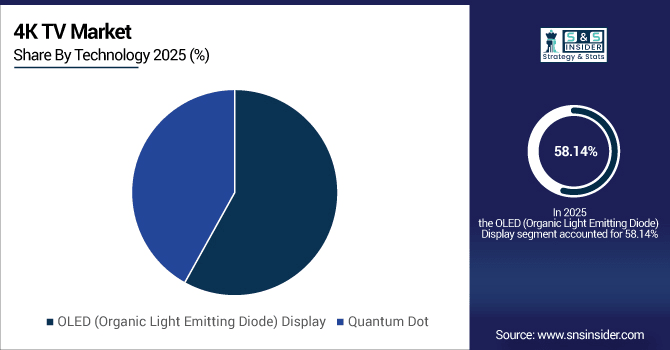
By Technology, OLED (Organic Light Emitting Diode) Displays are expected to lead the 4K TV market with a 58.14% share in 2025, while Quantum Dot technology will be the fastest growing segment with a CAGR of 12.50%.
-
By Sales Channel, the Online segment will dominate the 4K TV market in 2025 with a 62.54% share, whereas the Offline channel is projected to grow at the fastest pace with a CAGR of 15.37%.
-
By Type, the 52 to 65 inches category is anticipated to lead with a 45.23% share in 2025, while TVs greater than 65 inches are expected to register the highest growth with a CAGR of 14.25%.
-
By End-User, the Household segment is set to hold the largest share of 70.28% in 2025, while the Public segment is forecasted to grow fastest with a CAGR of 13.05%.
By Technology, OLED (Organic Light Emitting Diode) Display Leads Market While Quantum Dot Registers Fastest Growth
OLED is the dominate technology in the 4K TV space because of is superior PQ, deep blacks and wide viewing angles. The demand for OLED TVs among consumers, particularly in advanced markets, is significantly high as they seek products that offer an unmatched premium experience. Quantum Dot display, in the meantime, is seeing the fastest growth due to its colorful expression, energy efficiency and cost superiority over OLED. Increasing preference for HDR content, gaming applications, and high immersive visuals has been driving the adoption of OLED and Quantum Dot technologies across the globe.
By Sales Channel, Online Dominate While Offline Shows Rapid Growth
Online platforms are increasingly popular in the 4K TV space owing to its ease of access, wide range of products available and competitive prices on offer with an easy home delivery option. Adoption has been given a push by the likes of Amazon, Walmart and regional e-commerce players that have made available discounts and financing options. Yet offline retail too is rapidly expanding, because customers still want to see the product firsthand, and experience it in person. This online/offline coverage results in very good market penetration even into urban and semiurban areas worldwide.
By Type, 52 to 65 inches Lead While Greater than 65 inches Registers Fastest Growth
The 52 to 65 inches category represents the majority of 4K TVs sold today, striking the perfect balance between cost and a large ultrahigh-res viewing experience ideal for most living rooms. Customers are one by one choosing this model for their living room as it completely fits the giant portability with a low budget. But it’s TVs bigger than 65 inches where growth is surging, owing to falling prices and a desire to replicate the theater experience at home. Sharper demand for bigger screens in the premium categories and technological innovations is driving this segment’s expansion.
By End-User, Household Lead While Public Grow Fastest
Household is the largest end-user segment in the 4K TV market, driven by growing demand for smart TVs, gaming and streaming services. 4K TVs for daily entertainment, sports and home theaters are more popular among families, accounting the highest number of sales. But public use, including in hospitality and corporate or commercial applications, is growing the fastest. Hotels, restaurants, schools and meeting spaces are rapidly adopting 4K to provide their guests with the latest digital messaging.
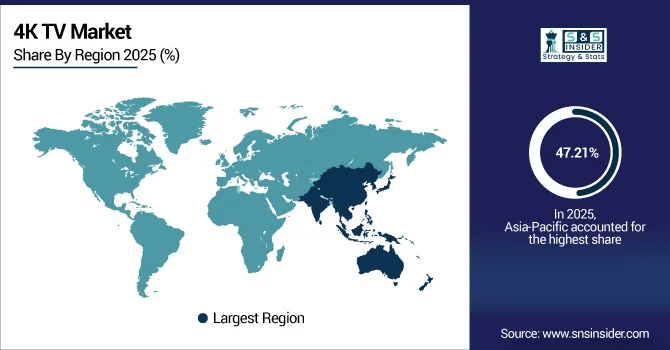
Asia-pacific 4K TV Market Insights
In 2025E Asia-Pacific dominated the 4K TV Market and accounted for 47.21% of revenue share, this leadership is due to the growing disposable incomes and urbanization. China, Japan and India are said to be driving demand with growing middle-class populations and an appetite for state-of-the-art home entertainment. Low-cost models are also promoted by local manufacturers, which encouraged uptake. The adoption of smart TV is driven by growing internet penetration. In general, the area is an economic epicenter.
Get Customized Report as Per Your Business Requirement - Enquiry Now
China 4K TV Market Insights
China is among the largest producers and consumers of 4K TVs, including brands like TCL (TCT.Alyi), Hisense and Skyworth. Key government initiatives supporting digitalization and domestic manufacturing drive market presence.
North America 4K TV Market Insights
North America is expected to witness the fastest growth in the 4K TV Market over 2026-2033, with a projected CAGR of 20.72% due to demand for high-end 4K television sets OLED models and QLED in particular is robust in North America and whether it is streaming, gaming or surfing the net, users are taking a stronger stance on bigger screen and smarter features. There are the local kingpin brands such as Samsung, LG, Sony and Vizio. Competitive sales growth is fueled by e-commerce platforms. The trends’ overall pace-setter has been the United States.
U.S. 4K TV Market Insights
The U.S. is currently the largest market for 4K TV in North America, supported by high-income households and advanced streaming penetration. Consumers are also buying big-screen, feature-rich, sceptre models for their Home Theaters.
Europe 4K TV Market Insights
Europe is mature and established it’s already penetrating millions of households, particularly in territories such as Germany, the UK or France. OLED and eco-friendly models are particularly popular with consumers. The food processing industry of the region is dominated by strong EU legislation which supports environmentally friendly technology and sustainable production.
Germany 4K TV Market Insights
Germany is a key place in Europe, because we found very penetration of 4K TVs in their home. Local sales are pushed by the energy efficiency regulation and preference for high technology displays. Offline sales demands are amplified by robust retail networks.
Latin America (LATAM) and Middle East & Africa (MEA) 4K TV Market Insights
The 4K TV Market is experiencing moderate growth in the Latin America (LATAM) and Middle East & Africa (MEA) regions, due to the increasing income levels and internet connectivity. LATAM is ruled by Brazil and Mexico, MEA by UAE and South Africa. Restricted affordability constrains premium but mid-range models are in high demand. Expanding e-commerce supports wider distribution. These areas represent a great untapped potential for the future.
4K TV Market Competitive Landscape:
Samsung Electronics has pride in the global 4K TV market with its high-end QLED and Neo QLED series. It's known for its high-end display technologies, smart capabilities and premium TV sets. A wide and solid distribution across online and offline channels increases reach. It is the persistence of innovation, reputation and marketing strategy that propels Samsung to be a leader in both mature as well as newly developed markets.
-
In July 2025, Samsung launched the 2025 Neo QLED 4K Mini LED lineup (QN90F, QN80F, QN70F), featuring the NQ4 AI Gen3 processor and glare-free screen.
LG Electronics is a major player in the 4K TV market and it has been known for their leadership in technology when it comes to OLED. The company prides itself on its premium picture quality, energy savings and AI-powered smart features. LG offers a wide range of products in affordable as well as the high end. With worldwide retail value and volume sales ranking at number one, lean thinking makes it the perfect choice for millions of homes.
-
In March 2025, LG announced the 2025 OLED OLED C5 & G5 series with Alpha 11 AI Gen2 processor, includes 42-inch to 97-inch sizes, premium pricing.
TCL Technology is one of the fastest rising 4K TV manufacturers today and it’s highly affordable units compete in tech quality with much more high-end models on the market. The company is concentrating efforts on bigger screen uptake and QuantumDot tech to pull in customers. Strong e-commerce channels and global expansion have helped TCL to increase visibility.
-
In May 2025, TCL launched its new QD Mini-LED and QLED TV lineup in India, including C6K, C6KS, P8K, P7K, P6K models with advanced display, audio features.
Hisense Group also is very aggressive in developing the 4K TV market, while offering cutting edge and affordable models. Famous for ULED and smart, Hisense caters to budget-minded consumers who don’t want to compromise on quality. Associations with sports events ensure global brand exposure. With strong manufacturing muscle and enthusiasm to go where others fear, Hisense has grown into one of the fastest growing 4K TV brands in the world.
-
In August 2025, Hisense released the 116UX RGB MiniLED 4K TV ($29,999) and a 100UX model, offering high brightness, gaming-friendly features and wide color gamut.
4K TV Companies are:
-
Samsung Electronics
-
TCL Technology
-
Hisense Group
-
Sony Corporation
-
Vizio Inc.
-
Panasonic Corporation
-
Skyworth Group
-
Haier Group
-
Xiaomi Corporation
-
Philips
-
Toshiba Corporation
-
Changhong
-
JVC
-
Mitsubishi Electric
-
Grundig
-
Loewe Technology
-
Bang & Olufsen
-
Vestel
| Report Attributes | Details |
|---|---|
| Market Size in 2025 | USD 305.58 Billion |
| Market Size by 2033 | USD 1307.51 Billion |
| CAGR | CAGR of 19.95% From 2026 to 2033 |
| Base Year | 2025E |
| Forecast Period | 2026-2033 |
| Historical Data | 2022-2024 |
| Report Scope & Coverage | Market Size, Segments Analysis, Competitive Landscape, Regional Analysis, DROC & SWOT Analysis, Forecast Outlook |
| Key Segments | • By Technology (OLED (Organic Light Emitting Diode) Display and Quantum Dot) • By Sales Channel (Online and Offline) • By Type (Below 52 inches, 52 to 65 inches and Greater than 65 inches ) • By End-User (Public and Household) |
| Regional Analysis/Coverage | North America (US, Canada), Europe (Germany, UK, France, Italy, Spain, Russia, Poland, Rest of Europe), Asia Pacific (China, India, Japan, South Korea, Australia, ASEAN Countries, Rest of Asia Pacific), Middle East & Africa (UAE, Saudi Arabia, Qatar, South Africa, Rest of Middle East & Africa), Latin America (Brazil, Argentina, Mexico, Colombia, Rest of Latin America). |
| Company Profiles | Samsung Electronics, LG Electronics, TCL Technology, Hisense Group, Sony Corporation, Vizio Inc., Sharp Corporation, Panasonic Corporation, Skyworth Group, Haier Group, Xiaomi Corporation, Philips, Toshiba Corporation, Changhong, JVC, Mitsubishi Electric, Grundig, Loewe Technology, Bang & Olufsen, Vestel |
Get in Touch
