Smart Emergency Wayfinding Lighting Market Size:
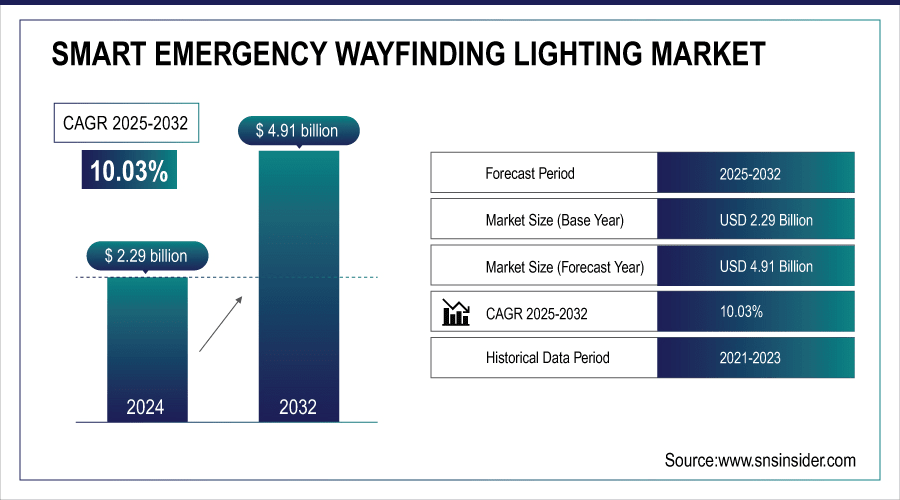
The Smart Emergency Wayfinding Lighting Market size was valued at USD 2.29 billion in 2024 and is expected to reach USD 4.91 billion by 2032 and grow at a CAGR of 10.03% over the forecast period of 2025-2032.
The Global Market has been segmented on the basis of product type, application, power source, end-user and in terms of geography, it is further segmented into North America, Europe, Asia Pacific, Latin America, and Middle East & Africa. This is fueled by a growing priority for safety regulations, energy efficiency, and IoT integration in emergency systems. Expansion in investments across smart infrastructure & urban modernization initiatives are also some of the factors accelerating the market globally. Smart Emergency Wayfinding Lighting Market analysis highlights emerging trends and growth patterns globally.
For instance, over 65% of newly constructed commercial buildings globally are integrating smart emergency wayfinding systems as part of their safety infrastructure.
To Get More Information On Smart Emergency Wayfinding Lighting Market - Request Free Sample Report
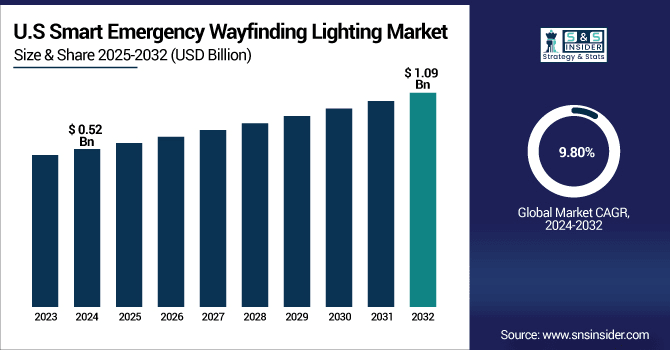
The U.S. Smart Emergency Wayfinding Lighting Market size was USD 0.52 billion in 2024 and is expected to reach USD 1.09 billion by 2032, growing at a CAGR of 9.80% over the forecast period of 2025–2032.
The U.S. Market is primarily fueled by stringent regulatory standards such as NFPA and OSHA, growing retrofitting activity in commercial buildings, and higher uptake of smart lights in hospitals and transportation centres. The rising demand is fueled by accelerating technological developments and increasing emphasis on public safety and energy efficiency. This continues to bolster the U.S. market as a leader in the global market. Smart Emergency Wayfinding Lighting Market trends reflect rapid nationwide adoption growth.
For instance, smart systems with AI-based diagnostics and cloud connectivity saw a 48% adoption surge across U.S. commercial buildings.
Smart Emergency Wayfinding Lighting Market Dynamics:
Key Drivers:
-
Rising Demand for Smart Infrastructure and Safety Compliance Across Commercial and Public Sector Buildings
The growing demand for the safety and efficiency of compliant buildings and the realization of smart infrastructure is driving the adoption of smart emergency wayfinding lighting solutions. Commercial complexes, malls, airports, hospitals are deploying an increasing number of such automated systems for real-time evacuation guidance with the growing extent of urbanization. From sensors integration, AI based routing, IoT connectivesness, these systems are a must in any modern day smart building project. Adding to this, government mandates pertaining to fire safety codes and green building certifications further accelerate their deployment, thereby ensuring a long-term, scalable demand source for smart emergency lighting technologies.
For instance, over 65% of new urban commercial developments in 2024 included AI-integrated emergency lighting as a standard.
Restraints:
-
Lack of Standardized Communication Protocols Restricts Seamless System Integration Across Smart Building Platforms
Absence of global interoperability standards for smart emergency lighting systems is one of the factor considered as the major concern which is affecting the market scalability. The challenge of integrating with other smart building technologies, including HVAC, fire alarm, and security, is that different manufacturers have different communication protocols. Such fragmentation makes deployment slow, costs more to integrate, and has poor scaleability. This creates further friction against widespread adoption by facility owners and public infrastructure bodies as the long-term compatibility remains uncertain.
Opportunities:
-
AI and IoT Integration in Emergency Navigation Create Opportunities for Predictive and Connected Lighting Systems
IoT and artificial intelligence are bringing smart lighting to a level that can meet predictive emergency navigation that dynamically changes its course in the middle of a disaster. These next-gen calamity management systems assess crowd of individuals approach, location of a fire and the spread of smoke in real time while directing the occupants with the best escape routes. Response time and safety can be enhanced with integration with building management systems and emergency services. With widespread adoption of digital twins and AI-powered simulations in commercial environments, there is great opportunity for vendors to provide intelligent, value-add capabilities across new verticals. Smart Emergency Wayfinding Lighting Market growth is fueled by innovation in AI-based evacuation and safety systems.
For instance, AI-based emergency navigation systems improve route optimization accuracy by up to 38% in dynamic scenarios.
Challenges:
-
Limited Awareness in Developing Regions Slows Adoption of Advanced Emergency Lighting Technologies
Although adoption is solid in developed economies, smart emergency wayfinding lighting still lacks recognition in many emerging markets. The problem with many builders is that, especially on non-commercial buildings, safety innovation gets sacrificed for cost. This lowers the sense of urgency as there are no regulatory mandates or enforcement. Further complicating this challenge is poor visibility into the market for product offerings, lack of vendor outreach and promotion, and inadequate government-sponsored safety campaigns. Therefore, even with continued growth in infrastructure in these parts, market penetration is quite shallow.
Smart Emergency Wayfinding Lighting Market Segmentation Analysis:
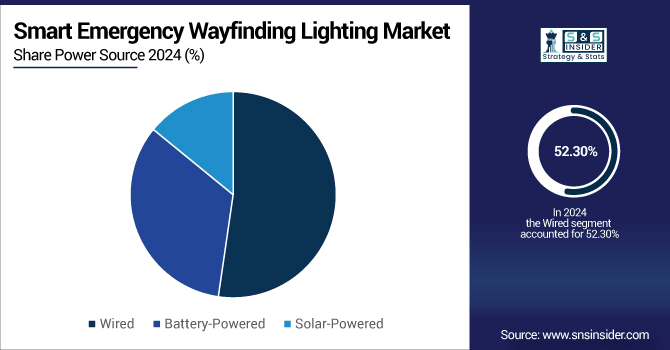
By Power Source
In 2024, the wired systems segment captured a maximum market share of 52.30% due to the uninterrupted power flow and proper transmission that is obtained using these systems. These are mainly applicable for non-temporary structures such as hospitals and tall buildings. For instance, Schneider Electric offers centralized wired emergency systems with self-diagnostics and land integration capabilities. CMI Facility managers, who expect it to be durable, bring CMIs out in mission-critical spaces that become default options for CMI, considering them to be durable and still retaining circulation through regulations.
Solar-Powered Lighting segment is likely to grow at the fastest CAGR of 10.82% during the forecast period 2024–2032. Perfect for Off-Grid Installations and Sustainable Architecture Projects Hybrid solar-emergency solutions — available through firms such as Cooper Lighting Solutions (a division of Signify) — deliver power that meets green building standards. Solar-powered systems are quickly gaining popularity in developed and developing regions due to increasing climate resilience planning & net-zero infrastructure.
By Product Type
LED lighting captured the largest revenue share of approximately 62.80% in 2024 and is also expected to be the fastest growing lighting type with a CAGR of approximately 10.40% during the period 2024–2032. The greater energy efficiency and longer lifespan of LED lighting and its compatibility with smart systems make it a superior choice in all applications. Advanced LED-based emergency systems for commercial/institutional exit lighting are available from companies such as Signify (formerly Philips Lighting). LEDs help lead to wide adoption for their brightness consistency, higher relative reliability and lower maintenance costs and enable sustainable building compliance.
By Application
In 2024, commercial buildings accounted for the largest Smart Emergency Wayfinding Lighting market share (approximately 38.70%) owing to high occupancy, complex infrastructure designs, and stringent safety codes for these structures. Emergency guidance systems are required in shopping malls, office towers and hotels. For commercial applications that connect to building management systems, Eaton Corporation is among the companies that provided scalable solutions. Such facilities focus on safety and uninterrupted operation, thus driving demand for LED and sensor based emergency lighting.
Public infrastructure seems to be growing at the fastest CAGR of 11.34% during 2024-2032. Smart city projects are also spurning the next-gen emergency lighting upgrades at airports, metro stations, and transit hubs. Honeywell is beginning to rollout AI-driven and sensor-based solutions in large public venues. The demand for real-time crowd navigation or steering during crises and government safety investments are fueling the growth of this segment.
By End-User
The hospital segment held the largest market share of 26.40% in 2024 owing to the fact that hospitals operate 24/7 and many require critical evacuations. They require systems that are extremely robust and compliant with code. Acuity Brands Emergency lighting systems are designed specifically for healthcare with smart diagnostics and extended battery backup. They are very important for patient care areas, surgical rooms and corridors to provide ensure to ensure quick response and better visibility in the event of fire or blackout.
The airports are anticipated to be the fastest-growing end-user segment with CAGR of around 11.11% during 2024–2032. And many of these facilities are turning to real-time crowd management tools and more sophisticated wayfinding applications. ABB has created specific airport lighting platforms that are able to interface with emergency response plans and airside control systems. Adaptive emergency lighting has become a priority area as airport terminals and air traffic volumes grow globally.
Smart Emergency Wayfinding Lighting Market Regional Analysis:
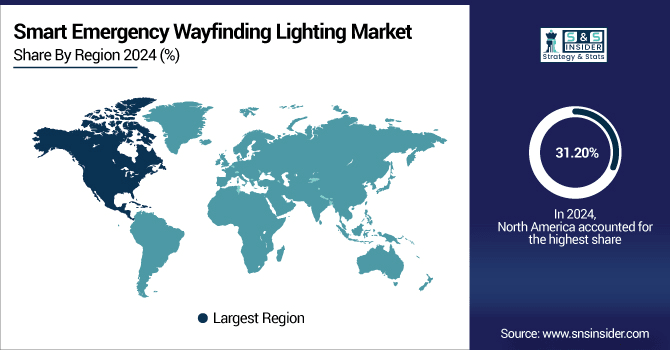
North America emerged as the dominant regional market contributing 31.20% share in 2024 to the global market. This is accompanied by early regulation, high awareness, and advanced evolution of smart building technologies across the region. Intelligent System for Legacy Infrastructure Retrofit — The U.S. is the leader in retrofitting legacy infrastructure to meet NFPA and OSHA guidelines. It is a market leader due to the strong institutional funding and also a well-developed ecosystem of smart lighting vendors.
Get Customized Report as per Your Business Requirement - Enquiry Now
-
The U.S. leads the North American market due to stringent safety regulations such as NFPA and OSHA, widespread retrofitting in commercial spaces, high adoption of smart technologies, and strong presence of leading players offering advanced emergency lighting solutions.
Asia Pacific is expected to have the fastest growth rate at a very high CAGR of 11.17% during 2023-2032. High adoption rates are driven by rapid urbanization, infrastructure modernization, and smart city initiatives by governments in China, India, and Southeast Asia. Increasing need for vendors within cities with population dense urban settings due to emergency upgrades to public infrastructure and awareness designates every province a robust opportunity for vendors to enter.
-
China dominates the Asia Pacific market owing to rapid urbanization, government-led smart city projects, growing infrastructure investments, and increasing enforcement of emergency safety codes, along with robust domestic manufacturing of smart lighting technologies by major Chinese firms and multinationals.
Europe will propel the region due to stringent building safety codes, a high focus on energy efficiency, and regulatory frameworks such as the EU Green Deal. The smart infrastructure strategy of smart infrastructure in countries such as Germany, the UK, and France. The historical buildings are being retrofitted with intelligent emergency systems which in turn is contributing a steady growth to the market in the region and a consistent adoption of the innovations.
-
Germany dominates the European Smart Emergency Wayfinding Lighting industry due to strict safety regulations, advanced smart building infrastructure, and strong local manufacturers such as OSRAM. High investments in public infrastructure and retrofitting initiatives further strengthen its leadership in the regional market.
In the Middle East & Africa market, the UAE stands out, driven by the adoption of smart city projects and regulatory focus on safety in high-rise developments. Brazil is the dominant player in Latin America, owing to the growth of public infrastructure, modernization of commercial spaces, and the rising adoption of intelligent lighting solutions among transport and healthcare sectors.
Smart Emergency Wayfinding Lighting Companies are:
Major Key Players in Smart Emergency Wayfinding Lighting Market are Signify N.V., Eaton Corporation, Zumtobel Group, Hubbell Incorporated, Acuity Brands, Inc., Schneider Electric, Legrand S.A., Honeywell International Inc., ABB Ltd., OSRAM GmbH, Cree Lighting (IDEAL INDUSTRIES, INC.), Beghelli S.p.A., Cooper Lighting Solutions, Tridonic GmbH & Co KG, Daisalux, Linergy, Fulham Co., Inc., Holophane Europe Limited, Clevertronics Pty Ltd and Mackwell and others.
Recent Developments:
-
In June 2025, Signify launched its wireless emergency lighting portfolio integrated with the Interact Building Manager cloud-based system. This solution automates testing, monitoring, and regulatory reporting via secure dashboards globally.
-
In April 2025, Eaton unveiled a breakthrough AI-powered grid‑edge control innovation, enhancing building automation and safety systems—applicable to intelligent emergency and smart lighting infrastructure for fault detection and predictive maintenance.
| Report Attributes | Details |
|---|---|
| Market Size in 2024 | USD 2.29 Billion |
| Market Size by 2032 | USD 4.91 Billion |
| CAGR | CAGR of 10.03% From 2025 to 2032 |
| Base Year | 2024 |
| Forecast Period | 2025-2032 |
| Historical Data | 2021-2023 |
| Report Scope & Coverage | Market Size, Segments Analysis, Competitive Landscape, Regional Analysis, DROC & SWOT Analysis, Forecast Outlook |
| Key Segments | • By Product Type (LED Lighting, Fluorescent Lighting, Incandescent Lighting and Others) • By Application (Commercial Buildings, Industrial Facilities, Residential Buildings, Public Infrastructure and Others) • By Power Source (Wired, Battery-Powered and Solar-Powered) • By End-User (Hospitals, Airports, Shopping Malls, Educational Institutions and Others) |
| Regional Analysis/Coverage | North America (US, Canada, Mexico), Europe (Germany, France, UK, Italy, Spain, Poland, Turkey, Rest of Europe), Asia Pacific (China, India, Japan, South Korea, Singapore, Australia,Taiwan, Rest of Asia Pacific), Middle East & Africa (UAE, Saudi Arabia, Qatar, South Africa, Rest of Middle East & Africa), Latin America (Brazil, Argentina, Rest of Latin America) |
| Company Profiles | Signify N.V., Eaton Corporation, Zumtobel Group, Hubbell Incorporated, Acuity Brands, Inc., Schneider Electric, Legrand S.A., Honeywell International Inc., ABB Ltd., OSRAM GmbH, Cree Lighting (IDEAL INDUSTRIES, INC.), Beghelli S.p.A., Cooper Lighting Solutions, Tridonic GmbH & Co KG, Daisalux, Linergy, Fulham Co., Inc., Holophane Europe Limited, Clevertronics Pty Ltd and Mackwell |
Frequently Asked Questions
North America dominated the Smart Emergency Wayfinding Lighting Market in 2024.
The Wired segment dominated the Smart Emergency Wayfinding Lighting Market in 2024.
Integration of AI and IoT for real-time evacuation, coupled with rising safety regulations, drives market growth significantly.
The Smart Emergency Wayfinding Lighting Market size was USD 2.29 Billion in 2024 and is expected to reach USD 4.91 Billion by 2032.
The Smart Emergency Wayfinding Lighting Market is expected to grow at a CAGR of 10.03% from 2025-2032.
Get in Touch
