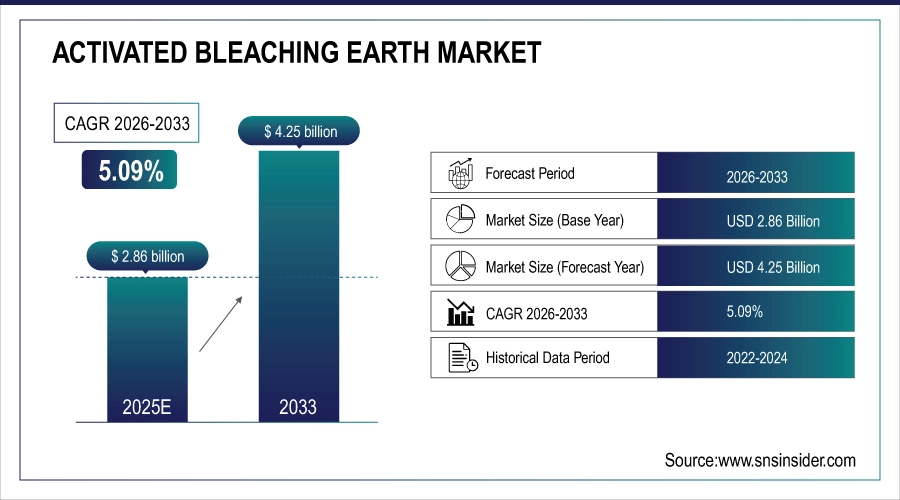
The activated bleaching earth market size was valued at USD 2.86 billion in 2024 and is expected to reach USD 4.25 billion by 2032, growing at a CAGR of 5.09% over the forecast period of 2025-2032.
The activated bleaching earth market is changing shape owing to increasing sustainability goals and growing demand for refined edible oil. Acid-activated bleaching earths are the most popular as they feature the highest degree of adsorption and help developments, such as Clariant’s TONSIL grades, and decrease 3-MCPD content. Improved dosing efficiency and digital process control are optimizing operations, as the activated bleaching earth companies branch out to cosmetics and wastewater treatment, driving the activated bleaching earth market growth and activated bleaching earth market share.
Acid-activated bleaching earth is approved for use in organic production by the U.S. National Organic Program, providing additional regulatory peace of mind. The trends in the bleaching earth market are gradually moving towards the technologically advanced and environment-friendly refining technologies and tailor-made formulations, reflecting the increasing trend in the activated bleaching earth market as industries seek higher performance and compliance from suppliers across developed and developing regions.
Drivers:
Rising Biofuel Production Escalates Demand for High-efficiency Activated Bleaching Earth Adsorption Solutions
The production of the U.S. biodiesel industry increased to about 2.8 billion gallons in 2023, creating an increased demand for effective desulfurization and decolorization adsorbents for use in the processing of vegetable oils. High-grade bleaching earth offers a particularly powerful response to exacting fuel-quality standards in several major refineries, in which 20% yield improvements have been recorded after the transition to high-grade bleaching earth. These operational improvements are spurring activated bleaching earth companies to enhance capacity and are consistent with prevailing trends in the activated bleaching earth market for low-impurity biofuels. Consequently, the market for bleaching clay is expected to gain a larger proportion of the renewable-fuels purifying activities, the U.S. Energy Information Administration reported.
Expanding Cosmetic Formulation Applications Drive Diversification of Activated Bleaching Earth Portfolios
Cosmetics brands are continuing to use bleaching earth as a natural clarifier and colour stabilizer in their creams, lotions, and lipids, mirroring a 12% increase in clay-based ingredient launches in 2024. Bleaching clays have now been added to the EU’s COSIng database, under “adsorbents and absorbents” for cosmetic use, opening up new potentialities for the expanding activated bleaching earth market outside edible oils. Such diversification forces activated bleaching earth companies to develop the fine-grade and acid-treated products that strictly comply with the cosmetic safety thresholds, and also encourages activated bleaching earth market trends towards the application of multifunctional water-based ingredients, underpinning activated bleaching earth market size for personal-care applications extensively.
Restraints:
Emerging Alternative Adsorbents, Such as Silica Gel, Hinder Market Penetration of Bleaching Earth
The current regulatory and technical literature, including EPA’s TSCA assessments, acknowledges silica gel, activated alumina, and activated carbon as proven adsorbents for impurities in oils and solvents. Its regenerability and uniform pore structure, and reduced disposal costs, explain 5% year-on-year growth in industrial use since 2021. Such competition has compelled activated bleaching earth producers to focus on high purity, small particle size and acid activation in an attempt to retain/secure share of the activated bleaching earth market, thus restraining the growth potential of the bleaching earth market to benefit from a consistent process requirement across varying end-uses.
By Technology
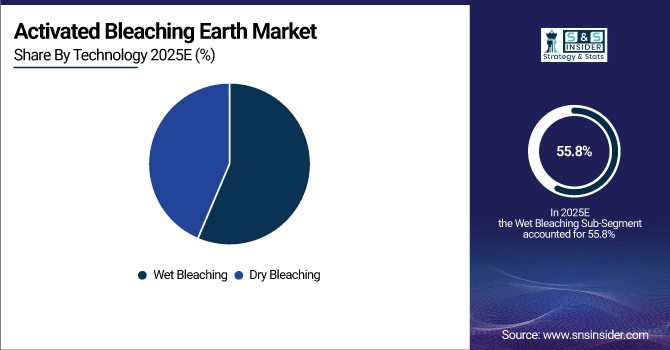
The wet bleaching segment dominated and is expected to increase the demand for the activated bleaching earth market as it accounts for the largest market share in 2024, with 55.8%. It is the most efficient method of filtering color bodies, sediments, and heavy metals out of oils. This technology is widely used in edible oils and fats refining, where much of the market exists. According to the U.S. Food & Drug Administration, wet bleaching can meet strict requirements for food safety, and therefore, constantly gains new users in the food processing industry, in particular. Moreover, the wet bleaching processes are preferred for large-scale production based on good quality, which is another reason for their preference.
The dry bleaching is expected to occur as the rapidly growing segment in the activated bleaching earth market, with a CAGR is around 5.67% for the period of 2025-2032. This expansion is a result of its environmental performance since it consumes less water than wet bleaching, which is in line with worldwide sustainability objectives. This approach has the added benefit of lower operating costs, as the U.S. refiners show by cutting down on their wastewater treatment costs. The current trend in the oil refining industry is toward dry bleaching because of growing concerns over cost, energy, and environmental issues.
By Application
In 2024, the edible oils and fats segment was the largest consumer of activated bleaching earth, holding 66.5% of the share. This section is largely dominated by the demand for processed of vegetable oils to meet the quality and safety needs of consumers. Activated bleaching earth is vital for the purification of edible oils by removing the undesired color, odor, and free fatty acid components. The U.S. Food and Drug Administration supports the application of activated bleaching earth in food production, reaffirming its position.
The mineral oils and lubricants are the largest growing segment in the global activated bleaching earth market, at a CAGR of 6.11% during 2025-2032. The demand for cleaner and better-performing railway lubricants for industrial applications is increasing. As there is growing demand for cleaner lubricants to enhance machinery efficiency and prolonged operation, the application of activated bleaching earth in the refinement of these oil products is more and more essential. This tendency is encouraged by advocacy organizations, such as the American Petroleum Institute instructs on the benefits of using more highly hydroprocessed lubricants.
By End-Use Industry
Food and beverages sector continues to stand as the leading end-use industry for the Activated Bleaching Earth, with 62.1% of the market share in 2024. Clean, safe and quality edible oils are in demand, and this growing demand continues to drive this sector. Activated bleaching earth is essential to the purification of edible, mineral, and waste oil including the removal of contaminants thereby maintaining the appearance, taste, and shelf life of the processed oil, particularly in the refining of vegetable and animal fats. Governmentally approval, such as FDA guidelines reinforce the trustability on bleaching clays in food applications to meet food safety levels.
Cosmetics and Personal Care Industry is the fastest growing end-use industry segment growing with a CAGR of 6.63% over forecast period of 2025-2032. Activated bleaching earth is now being used to purify and refine oils found in beauty products including lotions, skincare, and soaps. Increasing consumer inclination toward natural and eco-friendly personal care products has led manufacturers to introduce activated bleaching earth for enhanced product quality. The trend is in line with broader market shift toward sustainable beauty products as more consumers become aware of the environment and regulations become more stringent.
North America is the fastest growing region in the market for activated bleaching earth government in with the highest CAGR of 6.49% during the forecast period of 2025-2032. The increase is supported by the challenging sustainability standards and the consolidation of biodiesel and edible-oil refining capacities. The U.S. leads the North America activated bleaching earth market with a market value of USD 299.18 million with a market share of about 65% in 2024. Grants by the U.S. Environmental Protection Agency under the renewable fuel standard, for which refiners are using acid-activated bleaching earth to process low-impurity oil, have slashed wastewater 18% year-on-year. In addition, agreements between activated bleaching earth producers and the U.S. Department of Agriculture have facilitated the growth of the organic-certifiable bleaching clay grades and have underscored the leadership of North America in creative bleaching clay applications.
High regulatory standards in Europe under REACH and the European Green Deal are driving strong demand for acid-activated bleaching earth in the food, cosmetics, and biofuel markets. The German Federal Office of Consumer Protection enforces stringent color and impurity specifications for its edible oils, which leads top bleaching earth suppliers to provide extra-fine grades. Low-waste bleaching earth regeneration is additionally supported through Horizon Europe funding from the European Union, which in turn strengthens Europe’s position in a 20.3% share of the global bleaching clay market and the sustainable purification technology industry.
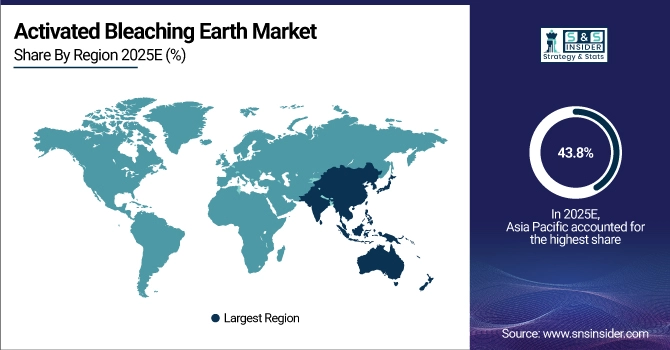
Asia Pacific holds the largest market with a market share of 43.8%, driven by the growing edible-oil and biodiesel industry in China. Guidelines for edible-oil quality (2023) of the Ministry of Agriculture in China forced the bleachers to apply acid-activated bleaching earth by which 25% more colour removal was obtained. In India, demand from major palm-oil refiners is supported by FSSAI approvals for certified bleaching clay. This, along with growing urbanization and consumer preference towards processed edible oil, makes APAC the crux of the worldwide bleaching earth market.
Growth in the activated bleaching earth market in LAMEA is supported by biofuel policies and refineries transformation in Latin America, the Middle East, and Africa. In Brazil, 12% spike in biodiesel production in 2023 means that high performance bleaching earth is required to conform to EN 14214 which high viscosity, while in Mexico, the energy reform is pushing producers there to buy bleaching clay from companies that moved to upgrade processes, and thus reduce contaminant load by 30%. Acid-activated bleaching earth. The modernization requirements of Vision 2030 of the Kingdom of Saudi Arabia led to the implementation of acid-activated bleaching earth for color reduction and free fatty acid (FFA) removal. The South African Department of Agriculture has reported a 10% increase in refining capacities, alluding to their collaborations with Bleaching Earth companies.
The major activated bleaching earth market competitors include Clariant, Taiko Group of Companies, Oil-Dri Corporation of America, Ashapura Perfoclay Limited (APL), BASF SE, EP Minerals / EP Engineered Clays Corporation, Musim Mas Holdings Pte. Ltd., The W Clay Industries Sdn. Bhd., Refoil Earth Pvt. Ltd., and 20 Microns Limited.
In August 2024, The U.S. Environmental Protection Agency published sustainable refining guidance under its RCRA program, recommending acid-activated bleaching earth to reduce wastewater discharge by up to 18% in edible-oil operations.
In Jan 2023, The U.S. National Organic Program officially added acid-activated bleaching earth to its list of allowed substances for certified organic processing, boosting its credibility among edible-oil refiners.
Report Attributes | Details |
---|---|
Market Size in 2024 | USD 2.86 billion |
Market Size by 2032 | USD 4.25 billion |
CAGR | CAGR of 5.09% From 2025 to 2032 |
Base Year | 2024 |
Forecast Period | 2025-2032 |
Historical Data | 2021-2023 |
Report Scope & Coverage | Market Size, Segments Analysis, Competitive Landscape, Regional Analysis, DROC & SWOT Analysis, Forecast Outlook |
Key Segments | •By Technology (Dry Bleaching, Wet Bleaching) •By Application (Edible Oils & Fats, Mineral Oils & Lubricants, Others) •By End-use Industry (Food & Beverages, Cosmetics & Personal Care, Chemicals, Others) |
Regional Analysis/Coverage | North America (US, Canada, Mexico), Europe (Germany, France, UK, Italy, Spain, Poland, Turkey, Rest of Europe), Asia Pacific (China, India, Japan, South Korea, Singapore, Australia, Rest of Asia Pacific), Middle East & Africa (UAE, Saudi Arabia, Qatar, South Africa, Rest of Middle East & Africa), Latin America (Brazil, Argentina, Rest of Latin America) |
Company Profiles | Clariant, Taiko Group of Companies, Oil-Dri Corporation of America, Ashapura Perfoclay Limited (APL), BASF SE, EP Minerals / EP Engineered Clays Corporation, Musim Mas Holdings Pte. Ltd., The W Clay Industries Sdn. Bhd., Refoil Earth Pvt. Ltd., and 20 Microns Limited |
The Activated Bleaching Earth Market is expected to reach USD 18.11 billion by 2032 due to increasing demand across multiple industries.
The Activated Bleaching Earth Market share is led by pharmaceuticals due to FDA-grade excipient use in tablets and capsules.
Leading Activated Bleaching Earth Companies include USG Corporation, Saint-Gobain, PABCO, and Yoshino Gypsum.
Sustainable digitalized processes are key Activated Bleaching Earth Market trends driving cleaner production in pharmaceutical and food industries.
The North America Activated Bleaching Earth Market ranks second with 24.3% share, led by strict FDA regulations and rising construction.
Table of Contents
1. Introduction
1.1 Market Definition
1.2 Scope (Inclusion and Exclusions)
1.3 Research Assumptions
2. Executive Summary
2.1 Market Overview
2.2 Regional Synopsis
2.3 Competitive Summary
3. Research Methodology
3.1 Top-Down Approach
3.2 Bottom-up Approach
3.3. Data Validation
3.4 Primary Interviews
4. Market Dynamics Impact Analysis
4.1 Market Driving Factors Analysis
4.1.1 Drivers
4.1.2 Restraints
4.1.3 Opportunities
4.1.4 Challenges
4.2 PESTLE Analysis
4.3 Porter’s Five Forces Model
5. Statistical Insights and Trends Reporting
5.1 Capital Investment Trends in Refineries
5.2 Refinery Process Compatibility Analysis
5.3 Maintenance and Downtime Metrics
5.4 Industrial Collaboration and Licensing Agreements
5.5 Research and Development Spending Trends
6. Competitive Landscape
6.1 List of Major Companies, By Region
6.2 Market Share Analysis, By Region
6.3 Product Benchmarking
6.3.1 Product specifications and features
6.3.2 Pricing
6.4 Strategic Initiatives
6.4.1 Marketing and promotional activities
6.4.2 Distribution and Supply Chain Strategies
6.4.3 Expansion plans and new Product launches
6.4.4 Strategic partnerships and collaborations
6.5 Technological Advancements
6.6 Market Positioning and Branding
7. Activated Bleaching Earth Market Segmentation by Technology
7.1 Chapter Overview
7.2 Dry Bleaching
7.2.1 Dry Bleaching Market Trends Analysis (2021-2032)
7.2.2 Dry Bleaching Market Size Estimates and Forecasts to 2032 (USD Billion)
7.3 Wet Bleaching
7.3.1 Wet Bleaching Market Trends Analysis (2021-2032)
7.3.2 Wet Bleaching Market Size Estimates and Forecasts to 2032 (USD Billion)
8. Activated Bleaching Earth Market Segmentation by Application
8.1 Chapter Overview
8.2 Edible Oils & Fats
8.2.1 Edible Oils & Fats Market Trend Analysis (2021-2032)
8.2.2 Edible Oils & Fats Market Size Estimates and Forecasts to 2032 (USD Billion)
8.3 Mineral Oils & Lubricants
8.3.1 Mineral Oils & Lubricants Market Trends Analysis (2021-2032)
8.3.2 Mineral Oils & Lubricants Market Size Estimates and Forecasts to 2032 (USD Billion)
8.4 Others
8.4.1 Others Market Trend Analysis (2021-2032)
8.4.2 Others Market Size Estimates and Forecasts to 2032 (USD Billion)
9. Activated Bleaching Earth Market Segmentation by End-use Industry
9.1 Chapter Overview
9.2 Food & Beverages
9.2.1 Food & Beverages Market Trends Analysis (2021-2032)
9.2.2 Food & Beverages Market Size Estimates and Forecasts to 2032 (USD Billion)
9.3 Cosmetics & Personal Care
9.3.1 Cosmetics & Personal Care Market Trends Analysis (2021-2032)
9.3.2 Cosmetics & Personal Care Market Size Estimates and Forecasts to 2032 (USD Billion)
9.4 Chemicals
9.4.1 Chemicals Market Trends Analysis (2021-2032)
9.4.2 Chemicals Market Size Estimates and Forecasts to 2032 (USD Billion)
9.5 Others
9.5.1 Others Market Trends Analysis (2021-2032)
9.5.2 Others Market Size Estimates and Forecasts to 2032 (USD Billion)
10. Regional Analysis
10.1 Chapter Overview
10.2 North America
10.2.1 Trends Analysis
10.2.2 North America Activated Bleaching Earth Market Estimates and Forecasts, by Country (2021-2032) (USD Billion)
10.2.3 North America Activated Bleaching Earth Market Estimates and Forecasts, by Technology (2021-2032) (USD Billion)
10.2.4 North America Activated Bleaching Earth Market Estimates and Forecasts, by Application (2021-2032) (USD Billion)
10.2.5 North America Activated Bleaching Earth Market Estimates and Forecasts, by End-use Industry (2021-2032) (USD Billion)
10.2.6 USA
10.2.6.1 USA Activated Bleaching Earth Market Estimates and Forecasts, by Technology (2021-2032) (USD Billion)
10.2.6.2 USA Activated Bleaching Earth Market Estimates and Forecasts, by Application (2021-2032) (USD Billion)
10.2.6.3 USA Activated Bleaching Earth Market Estimates and Forecasts, by End-use Industry (2021-2032) (USD Billion)
10.2.7 Canada
10.2.7.1 Canada Activated Bleaching Earth Market Estimates and Forecasts, by Technology (2021-2032) (USD Billion)
10.2.7.2 Canada Activated Bleaching Earth Market Estimates and Forecasts, by Application (2021-2032) (USD Billion)
10.2.7.3 Canada Activated Bleaching Earth Market Estimates and Forecasts, by End-use Industry (2021-2032) (USD Billion)
10.2.8 Mexico
10.2.8.1 Mexico Activated Bleaching Earth Market Estimates and Forecasts, by Technology (2021-2032) (USD Billion)
10.2.8.2 Mexico Activated Bleaching Earth Market Estimates and Forecasts, by Application (2021-2032) (USD Billion)
10.2.8.3 Mexico Activated Bleaching Earth Market Estimates and Forecasts, by End-use Industry (2021-2032) (USD Billion)
10.3 Europe
10.3.1 Trends Analysis
10.3.2 Eastern Europe Activated Bleaching Earth Market Estimates and Forecasts, by Country (2021-2032) (USD Billion)
10.3.3 Eastern Europe Activated Bleaching Earth Market Estimates and Forecasts, by Technology (2021-2032) (USD Billion)
10.3.4 Eastern Europe Activated Bleaching Earth Market Estimates and Forecasts, by Application (2021-2032) (USD Billion)
10.3.5 Eastern Europe Activated Bleaching Earth Market Estimates and Forecasts, by End-use Industry (2021-2032) (USD Billion)
10.3.6 Germany
10.3.6.1 Germany Activated Bleaching Earth Market Estimates and Forecasts, by Technology (2021-2032) (USD Billion)
10.3.6.2 Germany Activated Bleaching Earth Market Estimates and Forecasts, by Application (2021-2032) (USD Billion)
10.3.6.3 Germany Activated Bleaching Earth Market Estimates and Forecasts, by End-use Industry (2021-2032) (USD Billion)
10.3.7 France
10.3.7.1 France Activated Bleaching Earth Market Estimates and Forecasts, by Technology (2021-2032) (USD Billion)
10.3.7.2 France Activated Bleaching Earth Market Estimates and Forecasts, by Application (2021-2032) (USD Billion)
10.3.7.3 France Activated Bleaching Earth Market Estimates and Forecasts, by End-use Industry (2021-2032) (USD Billion)
10.3.8 UK
10.3.8.1 UK Activated Bleaching Earth Market Estimates and Forecasts, by Technology (2021-2032) (USD Billion)
10.3.8.2 UK Activated Bleaching Earth Market Estimates and Forecasts, by Application (2021-2032) (USD Billion)
10.3.8.3 UK Activated Bleaching Earth Market Estimates and Forecasts, by End-use Industry (2021-2032) (USD Billion)
10.3.9 Italy
10.3.9.1 Italy Activated Bleaching Earth Market Estimates and Forecasts, by Technology (2021-2032) (USD Billion)
10.3.9.2 Italy Activated Bleaching Earth Market Estimates and Forecasts, by Application (2021-2032) (USD Billion)
10.3.9.3 Italy Activated Bleaching Earth Market Estimates and Forecasts, by End-use Industry (2021-2032) (USD Billion)
10.3.10 Spain
10.3.10.1 Spain Activated Bleaching Earth Market Estimates and Forecasts, by Technology (2021-2032) (USD Billion)
10.3.10.2 Spain Activated Bleaching Earth Market Estimates and Forecasts, by Application (2021-2032) (USD Billion)
10.3.10.3 Spain Activated Bleaching Earth Market Estimates and Forecasts, by End-use Industry (2021-2032) (USD Billion)
10.3.11 Poland
10.3.11.1 Poland Activated Bleaching Earth Market Estimates and Forecasts, by Technology (2021-2032) (USD Billion)
10.3.11.2 Poland Activated Bleaching Earth Market Estimates and Forecasts, by Application (2021-2032) (USD Billion)
10.3.11.3 Poland Activated Bleaching Earth Market Estimates and Forecasts, by End-use Industry (2021-2032) (USD Billion)
10.3.12 Turkey
10.3.12.1 Turkey Activated Bleaching Earth Market Estimates and Forecasts, by Technology (2021-2032) (USD Billion)
10.3.12.2 Turkey Activated Bleaching Earth Market Estimates and Forecasts, by Application (2021-2032) (USD Billion)
10.3.12.3 Turkey Activated Bleaching Earth Market Estimates and Forecasts, by End-use Industry (2021-2032) (USD Billion)
10.3.13 Rest of Europe
10.3.13.1 Rest of Europe Activated Bleaching Earth Market Estimates and Forecasts, by Technology (2021-2032) (USD Billion)
10.3.13.2 Rest of Europe Activated Bleaching Earth Market Estimates and Forecasts, by Application (2021-2032) (USD Billion)
10.3.13.3 Rest of Europe Activated Bleaching Earth Market Estimates and Forecasts, by End-use Industry (2021-2032) (USD Billion)
10.4 Asia Pacific
10.4.1 Trends Analysis
10.4.2 Asia Pacific Activated Bleaching Earth Market Estimates and Forecasts, by Country (2021-2032) (USD Billion)
10.4.3 Asia Pacific Activated Bleaching Earth Market Estimates and Forecasts, by Technology (2021-2032) (USD Billion)
10.4.4 Asia Pacific Activated Bleaching Earth Market Estimates and Forecasts, by Application (2021-2032) (USD Billion)
10.4.5 Asia Pacific Activated Bleaching Earth Market Estimates and Forecasts, by End-use Industry (2021-2032) (USD Billion)
10.4.6 China
10.4.6.1 China Activated Bleaching Earth Market Estimates and Forecasts, by Technology (2021-2032) (USD Billion)
10.4.6.2 China Activated Bleaching Earth Market Estimates and Forecasts, by Application (2021-2032) (USD Billion)
10.4.6.3 China Activated Bleaching Earth Market Estimates and Forecasts, by End-use Industry (2021-2032) (USD Billion)
10.4.7 India
10.4.7.1 India Activated Bleaching Earth Market Estimates and Forecasts, by Technology (2021-2032) (USD Billion)
10.4.7.2 India Activated Bleaching Earth Market Estimates and Forecasts, by Application (2021-2032) (USD Billion)
10.4.7.3 India Activated Bleaching Earth Market Estimates and Forecasts, by End-use Industry (2021-2032) (USD Billion)
10.4.8 Japan
10.4.8.1 Japan Activated Bleaching Earth Market Estimates and Forecasts, by Technology (2021-2032) (USD Billion)
10.4.8.2 Japan Activated Bleaching Earth Market Estimates and Forecasts, by Application (2021-2032) (USD Billion)
10.4.8.3 Japan Activated Bleaching Earth Market Estimates and Forecasts, by End-use Industry (2021-2032) (USD Billion)
10.4.9 South Korea
10.4.9.1 South Korea Activated Bleaching Earth Market Estimates and Forecasts, by Technology (2021-2032) (USD Billion)
10.4.9.2 South Korea Activated Bleaching Earth Market Estimates and Forecasts, by Application (2021-2032) (USD Billion)
10.4.9.3 South Korea Activated Bleaching Earth Market Estimates and Forecasts, by End-use Industry (2021-2032) (USD Billion)
10.4.10 Singapore
10.4.10.1 Singapore Activated Bleaching Earth Market Estimates and Forecasts, by Technology (2021-2032) (USD Billion)
10.4.10.2 Singapore Activated Bleaching Earth Market Estimates and Forecasts, by Application (2021-2032) (USD Billion)
10.4.10.3 Singapore Activated Bleaching Earth Market Estimates and Forecasts, by End-use Industry (2021-2032) (USD Billion)
10.4.11 Australia
10.4.11.1 Australia Activated Bleaching Earth Market Estimates and Forecasts, by Technology (2021-2032) (USD Billion)
10.4.11.2 Australia Activated Bleaching Earth Market Estimates and Forecasts, by Application (2021-2032) (USD Billion)
10.4.11.3 Australia Activated Bleaching Earth Market Estimates and Forecasts, by End-use Industry (2021-2032) (USD Billion)
10.4.12 Rest of Asia Pacific
10.4.12.1 Rest of Asia Pacific Activated Bleaching Earth Market Estimates and Forecasts, by Technology (2021-2032) (USD Billion)
10.4.12.2 Rest of Asia Pacific Activated Bleaching Earth Market Estimates and Forecasts, by Application (2021-2032) (USD Billion)
10.4.12.3 Rest of Asia Pacific Activated Bleaching Earth Market Estimates and Forecasts, by End-use Industry (2021-2032) (USD Billion)
10.5 Middle East and Africa
10.5.1 Trends Analysis
10.5.2 Middle East Activated Bleaching Earth Market Estimates and Forecasts, by Country (2021-2032) (USD Billion)
10.5.3 Middle East Activated Bleaching Earth Market Estimates and Forecasts, by Technology (2021-2032) (USD Billion)
10.5.4 Middle East Activated Bleaching Earth Market Estimates and Forecasts, by Application (2021-2032) (USD Billion)
10.5.5 Middle East Activated Bleaching Earth Market Estimates and Forecasts, by End-use Industry (2021-2032) (USD Billion)
10.5.6 UAE
10.5.6.1 UAE Activated Bleaching Earth Market Estimates and Forecasts, by Technology (2021-2032) (USD Billion)
10.5.6.2 UAE Activated Bleaching Earth Market Estimates and Forecasts, by Application (2021-2032) (USD Billion)
10.5.6.3 UAE Activated Bleaching Earth Market Estimates and Forecasts, by End-use Industry (2021-2032) (USD Billion)
10.5.7 Saudi Arabia
10.5.7.1 Saudi Arabia Activated Bleaching Earth Market Estimates and Forecasts, by Technology (2021-2032) (USD Billion)
10.5.7.2 Saudi Arabia Activated Bleaching Earth Market Estimates and Forecasts, by Application (2021-2032) (USD Billion)
10.5.7.3 Saudi Arabia Activated Bleaching Earth Market Estimates and Forecasts, by End-use Industry (2021-2032) (USD Billion)
10.5.8 Qatar
10.5.8.1 Qatar Activated Bleaching Earth Market Estimates and Forecasts, by Technology (2021-2032) (USD Billion)
10.5.8.2 Qatar Activated Bleaching Earth Market Estimates and Forecasts, by Application (2021-2032) (USD Billion)
10.5.8.3 Qatar Activated Bleaching Earth Market Estimates and Forecasts, by End-use Industry (2021-2032) (USD Billion)
10.5.9 South Africa
10.5.9.1 South Africa Activated Bleaching Earth Market Estimates and Forecasts, by Technology (2021-2032) (USD Billion)
10.5.9.2 South Africa Activated Bleaching Earth Market Estimates and Forecasts by Application (2021-2032) (USD Billion)
10.5.9.3 South Africa Activated Bleaching Earth Market Estimates and Forecasts, by End-use Industry (2021-2032) (USD Billion)
10.5.10 Rest of Middle East & Africa
10.5.10.1 Rest of Middle East & Africa Activated Bleaching Earth Market Estimates and Forecasts, by Technology (2021-2032) (USD Billion)
10.5.10.2 Rest of Middle East & Africa Activated Bleaching Earth Market Estimates and Forecasts, by Application (2021-2032) (USD Billion)
10.5.10.3 Rest of Middle East & Africa Activated Bleaching Earth Market Estimates and Forecasts, by End-use Industry (2021-2032) (USD Billion)
10.6 Latin America
10.6.1 Trends Analysis
10.6.2 Latin America Activated Bleaching Earth Market Estimates and Forecasts, by Country (2021-2032) (USD Billion)
10.6.3 Latin America Activated Bleaching Earth Market Estimates and Forecasts, by Technology (2021-2032) (USD Billion)
10.6.4 Latin America Activated Bleaching Earth Market Estimates and Forecasts, by Application (2021-2032) (USD Billion)
10.6.5 Latin America Activated Bleaching Earth Market Estimates and Forecasts, by End-use Industry (2021-2032) (USD Billion)
10.6.6 Brazil
10.6.6.1 Brazil Activated Bleaching Earth Market Estimates and Forecasts, by Technology (2021-2032) (USD Billion)
10.6.6.2 Brazil Activated Bleaching Earth Market Estimates and Forecasts, by Application (2021-2032) (USD Billion)
10.6.6.3 Brazil Activated Bleaching Earth Market Estimates and Forecasts, by End-use Industry (2021-2032) (USD Billion)
10.6.7 Argentina
10.6.7.1 Argentina Activated Bleaching Earth Market Estimates and Forecasts, by Technology (2021-2032) (USD Billion)
10.6.7.2 Argentina Activated Bleaching Earth Market Estimates and Forecasts, by Application (2021-2032) (USD Billion)
10.6.7.3 Argentina Activated Bleaching Earth Market Estimates and Forecasts, by End-use Industry (2021-2032) (USD Billion)
10.6.8 Rest of Latin America
10.6.8.1 Rest of Latin America Activated Bleaching Earth Market Estimates and Forecasts, by Technology (2021-2032) (USD Billion)
10.6.8.2 Rest of Latin America Activated Bleaching Earth Market Estimates and Forecasts, by Application (2021-2032) (USD Billion)
10.6.8.3 Rest of Latin America Activated Bleaching Earth Market Estimates and Forecasts, by End-use Industry (2021-2032) (USD Billion)
11. Company Profiles
11.1 Clariant
11.1.1 Company Overview
11.1.2 Financial
11.1.3 Product/ Services Offered
11.1.4 SWOT Analysis
11.2 Taiko Group of Companies
11.2.1 Company Overview
11.2.2 Financial
11.2.3 Product/ Services Offered
11.2.4 SWOT Analysis
11.3 Oil-Dri Corporation of America
11.3.1 Company Overview
11.3.2 Financial
11.3.3 Product/ Services Offered
11.3.4 SWOT Analysis
11.4 Ashapura Perfoclay Limited (APL)
11.4.1 Company Overview
11.4.2 Financial
11.4.3 Product/ Services Offered
11.4.4 SWOT Analysis
11.5 BASF SE
11.5.1 Company Overview
11.5.2 Financial
11.5.3 Product/ Services Offered
11.5.4 SWOT Analysis
11.6 EP Minerals / EP Engineered Clays Corporation
11.6.1 Company Overview
11.6.2 Financial
11.6.3 Product/ Services Offered
11.6.4 SWOT Analysis
11.7 Musim Mas Holdings Pte. Ltd.
11.7.1 Company Overview
11.7.2 Financial
11.7.3 Product/ Services Offered
11.7.4 SWOT Analysis
11.8 The W Clay Industries Sdn. Bhd.
11.8.1 Company Overview
11.8.2 Financial
11.8.3 Product/ Services Offered
11.8.4 SWOT Analysis
11.9 Refoil Earth Pvt. Ltd.
11.9.1 Company Overview
11.9.2 Financial
11.9.3 Product/ Services Offered
11.9.4 SWOT Analysis
11.10 20 Microns Limited
11.10.1 Company Overview
11.10.2 Financial
11.10.3 Product/ Services Offered
11.10.4 SWOT Analysis
12. Use Cases and Best Practices
13. Conclusion
An accurate research report requires proper strategizing as well as implementation. There are multiple factors involved in the completion of good and accurate research report and selecting the best methodology to compete the research is the toughest part. Since the research reports we provide play a crucial role in any company’s decision-making process, therefore we at SNS Insider always believe that we should choose the best method which gives us results closer to reality. This allows us to reach at a stage wherein we can provide our clients best and accurate investment to output ratio.
Each report that we prepare takes a timeframe of 350-400 business hours for production. Starting from the selection of titles through a couple of in-depth brain storming session to the final QC process before uploading our titles on our website we dedicate around 350 working hours. The titles are selected based on their current market cap and the foreseen CAGR and growth.
The 5 steps process:
Step 1: Secondary Research:
Secondary Research or Desk Research is as the name suggests is a research process wherein, we collect data through the readily available information. In this process we use various paid and unpaid databases which our team has access to and gather data through the same. This includes examining of listed companies’ annual reports, Journals, SEC filling etc. Apart from this our team has access to various associations across the globe across different industries. Lastly, we have exchange relationships with various university as well as individual libraries.
Step 2: Primary Research
When we talk about primary research, it is a type of study in which the researchers collect relevant data samples directly, rather than relying on previously collected data. This type of research is focused on gaining content specific facts that can be sued to solve specific problems. Since the collected data is fresh and first hand therefore it makes the study more accurate and genuine.
We at SNS Insider have divided Primary Research into 2 parts.
Part 1 wherein we interview the KOLs of major players as well as the upcoming ones across various geographic regions. This allows us to have their view over the market scenario and acts as an important tool to come closer to the accurate market numbers. As many as 45 paid and unpaid primary interviews are taken from both the demand and supply side of the industry to make sure we land at an accurate judgement and analysis of the market.
This step involves the triangulation of data wherein our team analyses the interview transcripts, online survey responses and observation of on filed participants. The below mentioned chart should give a better understanding of the part 1 of the primary interview.
Part 2: In this part of primary research the data collected via secondary research and the part 1 of the primary research is validated with the interviews from individual consultants and subject matter experts.
Consultants are those set of people who have at least 12 years of experience and expertise within the industry whereas Subject Matter Experts are those with at least 15 years of experience behind their back within the same space. The data with the help of two main processes i.e., FGDs (Focused Group Discussions) and IDs (Individual Discussions). This gives us a 3rd party nonbiased primary view of the market scenario making it a more dependable one while collation of the data pointers.
Step 3: Data Bank Validation
Once all the information is collected via primary and secondary sources, we run that information for data validation. At our intelligence centre our research heads track a lot of information related to the market which includes the quarterly reports, the daily stock prices, and other relevant information. Our data bank server gets updated every fortnight and that is how the information which we collected using our primary and secondary information is revalidated in real time.
Step 4: QA/QC Process
After all the data collection and validation our team does a final level of quality check and quality assurance to get rid of any unwanted or undesired mistakes. This might include but not limited to getting rid of the any typos, duplication of numbers or missing of any important information. The people involved in this process include technical content writers, research heads and graphics people. Once this process is completed the title gets uploader on our platform for our clients to read it.
Step 5: Final QC/QA Process:
This is the last process and comes when the client has ordered the study. In this process a final QA/QC is done before the study is emailed to the client. Since we believe in giving our clients a good experience of our research studies, therefore, to make sure that we do not lack at our end in any way humanly possible we do a final round of quality check and then dispatch the study to the client.
Key Segments:
By Technology
Dry Bleaching
Wet Bleaching
By Application
Edible Oils & Fats
Mineral Oils & Lubricants
Others
By End-use Industry
Food & Beverages
Cosmetics & Personal Care
Chemicals
Others
Request for Segment Customization as per your Business Requirement: Segment Customization Request
Regional Coverage:
North America
US
Canada
Mexico
Europe
Germany
France
UK
Italy
Spain
Poland
Turkey
Rest of Europe
Asia Pacific
China
India
Japan
South Korea
Singapore
Australia
Rest of Asia Pacific
Middle East & Africa
UAE
Saudi Arabia
Qatar
South Africa
Rest of Middle East & Africa
Latin America
Brazil
Argentina
Rest of Latin America
Request for Country Level Research Report: Country Level Customization Request
Available Customization
With the given market data, SNS Insider offers customization as per the company’s specific needs. The following customization options are available for the report:
Detailed Volume Analysis
Criss-Cross segment analysis (e.g. Product X Application)
Competitive Product Benchmarking
Geographic Analysis
Additional countries in any of the regions
Customized Data Representation
Detailed analysis and profiling of additional market players