AR and VR in Education Market Size & Trends:
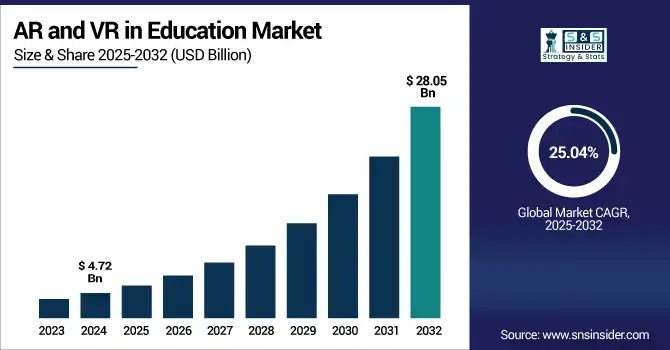
The AR and VR in Education Market size was valued at USD 4.72 billion in 2024 and is expected to grow to USD 28.05 billion by 2032 and grow at a CAGR of 25.04 % over the forecast period of 2025-2032.
To Get more information on AR and VR in Education Market - Request Free Sample Report
The global AR and VR in education market is experiencing robust growth, driven by the increasing demand for immersive and interactive learning experiences. Educational institutions are rapidly adopting these technologies to enhance engagement, improve retention, and support remote learning. Advancements in hardware affordability and software usability have made AR and VR more accessible across K–12, higher education, and corporate training sectors. Cloud-based solutions are further enabling flexible deployment and scalability. With growing investments in EdTech and a shift toward digital learning environments, the AR and VR education market is poised for continued expansion worldwide over the coming years.
The U.S. Inline Viscosity Sensor Market size was USD 1.08 million in 2024 and is expected to reach USD 5.57 million by 2032, growing at a CAGR of 22.87% over the forecast period of 2025–2032.
The US market growth is primarily driven by widespread digital transformation across academic institutions and increased investment in immersive learning tools. Schools and universities are integrating AR and VR to enhance student engagement, facilitate remote learning, and support STEM and experiential education. Government initiatives promoting EdTech adoption and strong infrastructure for cloud deployment further boost market expansion. The U.S. also benefits from the presence of leading AR/VR technology providers and startups, fostering continuous innovation. As affordability and accessibility improve, adoption across K–12 and higher education is expected to accelerate.
According to research, over 70% of U.S. higher education institutions have integrated at least one form of immersive technology in their teaching practices.
Augmented and Virtual Reality in Education Market Dynamics
Key Drivers:
-
Expansion of digital infrastructure and increasing adoption of cloud-based education platforms for seamless content delivery and accessibility
The widespread expansion of digital infrastructure has facilitated the integration of AR and VR tools in modern education systems. Cloud-based platforms support scalable, real-time delivery of immersive content to students worldwide, overcoming barriers of time and location. These solutions enable educators to deploy interactive learning modules remotely while ensuring efficient resource utilization. With increased internet penetration and government initiatives promoting digital learning, academic institutions are leveraging AR and VR to modernize education delivery. The ease of access and operational flexibility offered by cloud deployment has positioned AR and VR as vital components of future-ready education systems.
According to research, Students trained using AR and VR-based modules have shown a 30–40% improvement in knowledge retention compared to traditional methods.
Restrain:
-
Lack of teacher training and technical expertise to effectively integrate AR and VR tools in classroom settings
Even when AR and VR solutions are available, many educators lack the necessary skills and training to integrate these tools into their teaching practices. Teachers may find it difficult to adapt lesson plans, manage technical challenges, or troubleshoot AR/VR equipment without adequate support. This skill gap slows the adoption rate and limits the effectiveness of immersive learning. Furthermore, the absence of standardized best practices for implementing AR/VR in education results in inconsistent learning outcomes. Ensuring teacher readiness through training and support infrastructure is essential to unlock the full potential of these emerging technologies in classrooms.
Opportunities:
-
Expansion of e-learning and remote education models driving demand for immersive and flexible virtual learning environments
The global shift towards e-learning has fueled the need for engaging and effective digital education solutions. AR and VR technologies meet this need by providing interactive and personalized virtual learning environments that improve learner outcomes. Remote learning platforms can now integrate simulations, 3D models, and virtual field trips to enrich the user experience. As educational institutions and corporate training providers increasingly rely on online modes, immersive technologies offer a competitive advantage by replicating real-world scenarios and improving attention spans. The growing e-learning ecosystem presents significant opportunities for AR and VR applications in both academic and professional training domains.
According to research, Enterprises using VR for training report a 30% reduction in training costs and a 20% boost in employee performance.
Challenges:
-
Technical integration and interoperability issues with existing educational systems hinder seamless deployment of AR and VR solutions
Many educational institutions operate legacy IT systems that are not designed to support the technical demands of AR and VR platforms. Integrating new immersive solutions often requires infrastructure upgrades, compatibility adjustments, and system reconfiguration. Moreover, the lack of standardization across devices and software creates interoperability issues that complicate deployment and scalability. These technical hurdles increase implementation time and costs, creating friction in adoption. Without a unified framework or ecosystem, educational providers may struggle to ensure consistency, reliability, and performance across diverse learning environments using AR and VR technologies.
AR and VR in Education Market Segment Analysis:
By Offerings
Hardware dominated the highest revenue share of around 58.22% in 2024 due to the essential role of devices such as head-mounted displays, smartboards, and motion-tracking systems. These tools create immersive, hands-on learning environments that enhance engagement and retention. Schools, universities, and training centers continue to invest in hardware to build the necessary infrastructure for experiential learning. Despite the higher initial costs, hardware remains critical for delivering realistic simulations, especially in subjects like science, healthcare, and technical education. Its foundational role ensures continued adoption across various educational levels and disciplines.
Software segment is projected to register the fastest CAGR of approximately 26.81% from 2025 to 2032, fueled by the growing preference for digital and interactive learning solutions. Institutions are adopting AR/VR-enabled educational applications, simulation tools, and content management platforms that support both in-person and remote learning. These solutions are easier to scale, update, and integrate into existing systems, making them ideal for dynamic academic environments. The shift toward personalized learning, combined with improved usability and lower maintenance needs, has made software a strategic focus for schools and universities aiming to modernize and digitize the classroom experience.
By Devices Type
Interactive whiteboards segment dominated the highest revenue share of around 34.79% in 2024 due to their versatility and ease of classroom integration. They enable interactive lessons, real-time collaboration, and content visualization, making learning more dynamic and student-focused. Teachers find them intuitive, and schools benefit from their compatibility with existing infrastructure. Their ability to display AR-enhanced content on a large scale enhances engagement across diverse subjects, especially in early and primary education. As a cost-effective and widely accepted technology, interactive whiteboards continue to lead hardware adoption in educational environments worldwide.
Virtual reality devices segment is projected to register the fastest CAGR of approximately 26.46% from 2025 to 2032, due to rising demand for immersive, simulation-based learning in advanced education settings. VR headsets and gesture-control devices offer deeply engaging educational experiences, allowing students to interact with 3D models, environments, and real-world scenarios. This hands-on approach improves comprehension in complex fields like biology, engineering, and medicine. As VR technology becomes more affordable and user-friendly, institutions are increasingly incorporating it into curricula to enhance learning outcomes. The shift toward experiential, skill-based education is accelerating the adoption of VR across both academic and corporate training sectors.
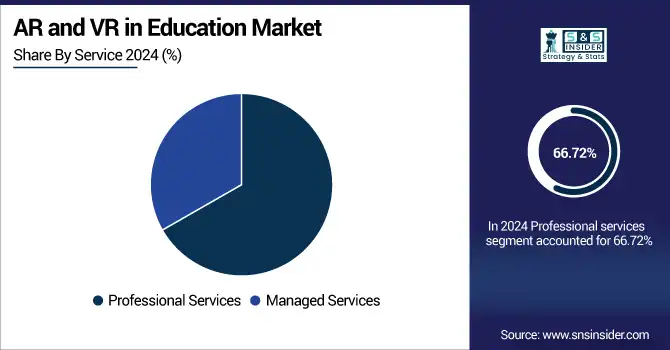
By Service
Professional services segment dominated the highest revenue share of around 66.72% in 2024 due to the essential need for expert guidance and implementation. Educational institutions rely on professional service providers for system integration, content development, customization, and faculty training. These services ensure smooth deployment and maximize the educational impact of AR/VR tools. Since many schools lack in-house technical expertise, external consultants help navigate complex setups and align solutions with learning objectives. The demand for professional support remains high, especially during initial adoption phases, making this segment the dominant force in the services category.
Managed services segment is projected to register the fastest CAGR of approximately 26.19% from 2025 to 2032, driven by the increasing need for ongoing support, maintenance, and platform optimization. As AR and VR systems become more complex, schools are turning to managed service providers to handle updates, monitor performance, and manage technical issues continuously. These services offer cost-effective scalability and reduce the burden on internal IT teams. With institutions adopting cloud-based AR/VR platforms and remote learning models, the value of long-term managed support is growing. The demand for hassle-free, reliable service management is accelerating this segment’s expansion across diverse educational settings.
By Deployment
On-premise segment dominated the highest revenue share of around 71.12% in 2024, due to legacy infrastructure and data control preferences of institutions. Many educational institutions still rely on traditional IT setups, making on-premise solutions a natural choice for AR and VR integration. On-premise deployment offers greater control over data security, performance, and system customization. Institutions with established in-house IT teams prefer this model for its reliability and perceived stability. Additionally, concerns over data privacy and compliance further support on-premise dominance, particularly in regions with strict regulatory environments or limited cloud infrastructure.
Cloud segment is projected to register the fastest CAGR of approximately 26.14% from 2025 to 2032, due to its flexibility, scalability, and ability to support remote and hybrid learning models. Cloud-based AR and VR platforms enable students and educators to access immersive learning tools from any location, at any time. This model eliminates the need for extensive physical infrastructure and reduces upfront investment, making it ideal for budget-conscious institutions. As educational systems embrace digital transformation, cloud solutions allow seamless updates, cross-device compatibility, and real-time collaboration. The growing demand for personalized, on-demand learning experiences continues to accelerate the adoption of cloud-based deployments across the global education sector.
By Application
Classroom learning segment dominated the highest revenue share of around 30.07% in 2024, due to its widespread use in K–12 and higher education institutions. Schools and universities globally are incorporating AR and VR technologies into traditional classroom environments to enhance engagement, visualization, and interactive learning. These tools help simplify complex subjects, promote experiential education, and support differentiated instruction. As governments and educators invest in modernizing classroom infrastructure, AR and VR are increasingly integrated into core curricula, making classroom learning the primary and most widely adopted application of immersive technologies in the educational sector.
Corporate learning management segment is projected to register the fastest CAGR of approximately 26.65% from 2025 to 2032, driven by the rising demand for immersive training and upskilling solutions. Businesses are increasingly adopting AR and VR to deliver scalable, hands-on training experiences for employee development, onboarding, and compliance. These technologies offer realistic simulations, remote accessibility, and higher retention rates, making them ideal for corporate learning environments. Industries such as manufacturing, healthcare, and IT are leveraging VR to reduce training costs and improve efficiency. As organizations prioritize digital transformation and workforce agility, AR/VR-powered corporate learning platforms are experiencing rapid growth across global enterprise sectors.
By End Use
Academic institutions segment dominated the highest revenue share of around 65.53% in 2024, due to widespread adoption across K–12 and higher education systems. Schools and universities are leveraging AR and VR to enhance curriculum delivery, improve student engagement, and simplify complex subjects through interactive content. These technologies support experiential learning, virtual labs, and immersive field trips, making them highly effective in traditional classroom environments. With increased government funding, curriculum modernization efforts, and infrastructure development, academic institutions continue to lead AR/VR adoption, positioning themselves as the primary drivers of growth in the educational technology landscape.
The Corporates segment is projected to register the fastest CAGR of approximately 26.25% from 2025 to 2032, due to rising adoption of AR and VR for immersive employee training and development programs. Businesses are integrating AR and VR into learning management systems to deliver hands-on, scenario-based training in areas like safety, compliance, and technical skills. These tools reduce training costs, improve retention, and enable remote learning for a geographically dispersed workforce. As industries prioritize digital transformation and continuous upskilling, corporates are investing heavily in scalable, VR-enabled platforms. This shift is accelerating the growth of AR and VR applications in corporate education and professional development environments globally.
AR and VR in Education Market Regional Outlook:
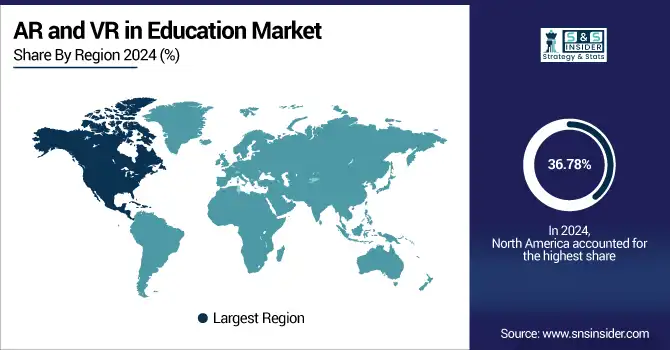
North America dominated the largest market share of 36.78% in 2024 of AR and VR education market due to strong technological infrastructure, high investment in EdTech, and early adoption by academic institutions and corporate training programs. The region benefits from widespread access to digital devices, advanced connectivity, and a favorable policy environment supporting immersive learning. Leading universities, tech-savvy educators, and major AR/VR solution providers are concentrated in North America, creating a robust ecosystem that continues to drive demand and maintain its leadership position in the global market.
-
The U.S. leads North America's AR and VR in education market due to its advanced EdTech ecosystem, robust investments in immersive learning, strong infrastructure, and widespread adoption across K–12 and higher education institutions.
Asia Pacific is projected to witness the fastest CAGR of 26.22% from 2025 to 2032 in the AR and VR education market, driven by rapid digital transformation, increasing government support for smart education, and rising demand for innovative learning solutions in densely populated countries. Expanding internet access, growing tech adoption in schools, and a large student population are encouraging institutions to implement AR and VR tools. Additionally, startups and tech firms across the region are accelerating content development and deployment, making immersive learning more accessible and scalable.
-
China dominates the Asia Pacific market with massive government support, strong local manufacturing of AR/VR hardware, rapid digitalization in schools, and integration of immersive technologies in national education reform policies.
Europe holds a significant share in the AR and VR education market, driven by increasing investments in digital education, government-backed innovation initiatives, and cross-border EdTech collaborations. Countries like the UK, Germany, and France are key players, emphasizing inclusive, experiential learning. The region is steadily adopting VR classrooms and AR-based learning tools to modernize educational delivery.
-
Germany leads the AR and VR in Education market in Europe due to its strong government support, advanced technological infrastructure, and emphasis on vocational and STEM education. The country actively integrates immersive technologies into classrooms, enhancing interactive and experiential learning experiences.
In the Middle East & Africa, countries like the UAE, Saudi Arabia, and Qatar are leading AR and VR adoption in education through government initiatives and smart classroom investments, while in Latin America, Brazil and Argentina are driving growth with immersive learning programs, expanding infrastructure, and increasing digital education adoption region-wide.
Get Customized Report as per Your Business Requirement - Enquiry Now
AR and VR in Education Companies are:
Major Key Players in AR and VR in Education Market are Sony Group Corporation (Japan), HTC Corporation (Taiwan), Meta (US), Google (US), Microsoft (US), Panasonic Holdings Corporation (Japan), Vuzix (US), Cornerstone OnDemand, Inc. (US), Anthology Inc. (US), Lenovo (Hong Kong).
Recent Development:
-
The HTC VIVE XR Elite headset, which was introduced in January 2023, combines Mixed Reality (MR) and Virtual Reality (VR) capabilities into a single, lightweight, powerful, and incredibly adaptable device that can be used for productivity, gaming, exercise, and other purposes.
-
Panasonic and Biel Glasses (Spain) partnered in January 2023, and the latter develops smart glasses to address the mobility issues of people with visual impairments, allowing for a significant increase in their autonomy. Through this collaboration, both businesses are growing smart glasses designed to help those with visual impairments. It comes with Panasonic's portable VR goggles that support 5.2K HDR and the technology in Biel Glasses is intended for people with low vision.
| Report Attributes | Details |
|---|---|
| Market Size in 2024 | USD 4.72 Billion |
| Market Size by 2032 | USD 28.05 Billion |
| CAGR | CAGR of 25.04% From 2025 to 2032 |
| Base Year | 2024 |
| Forecast Period | 2025-2032 |
| Historical Data | 2021-2023 |
| Report Scope & Coverage | Market Size, Segments Analysis, Competitive Landscape, Regional Analysis, DROC & SWOT Analysis, Forecast Outlook |
| Key Segments | • By Offerings (Software, Hardware, Services) • By Devices Type (Interactive Whiteboards, Mobile Computing Devices, Virtual Reality Devices, Projectors & Display Walls, Others (Security & video cameras and attendance tracking system)) • By Service (Professional Services, Managed Services) • By Deployment (On-Premise, Cloud) • By Application (Classroom Learning, Corporate Learning Management, Certifications, E-Learning, Virtual Field Trips, Student Recruitment, Others) • By End Use (Academic Institutions, Corporates) |
| Regional Analysis/Coverage | North America (US, Canada, Mexico), Europe (Germany, France, UK, Italy, Spain, Poland, Turkey, Rest of Europe), Asia Pacific (China, India, Japan, South Korea, Singapore, Australia,Taiwan, Rest of Asia Pacific), Middle East & Africa (UAE, Saudi Arabia, Qatar, South Africa, Rest of Middle East & Africa), Latin America (Brazil, Argentina, Rest of Latin America) |
| Company Profiles | Sony Group Corporation (Japan), HTC Corporation (Taiwan), Meta (US), Google (US), Microsoft (US), Panasonic Holdings Corporation (Japan), Vuzix (US), Cornerstone OnDemand, Inc. (US), Anthology Inc. (US), Lenovo (Hong Kong). |
Frequently Asked Questions
Ans: North America dominated the AR and VR in Education Market in 2024.
Ans: Hardware segment dominated the AR and VR in Education Market.
Ans: The major growth factor of the AR and VR in Education Market is the increasing adoption of immersive learning tools enhancing engagement, retention, and personalized education across global institutions.
The AR and VR in Education Market size was USD 4.72 billion in 2024 and is expected to reach USD 28.05 billion by 2032.
Ans: The AR and VR in Education Market is expected to grow at a CAGR of 25.04% from 2025-2032.
Get in Touch
