3D Display Market Key Insights:
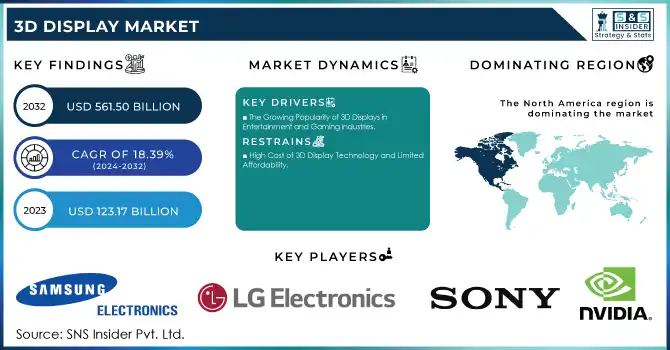
The 3D Display Market Size was valued at USD 123.17 Billion in 2023 and is expected to reach USD 561.50 Billion by 2032 and grow at a CAGR of 18.39% over the forecast period 2024-2032.
The 3D Display Market in the years 2023 and 2024 is still continuing to grow rapidly, through the advancement of technology and the increasing needs for immersive visual experiences in entertainment, healthcare, automotive, retail, and many more sectors. The countries that contribute the most are the United States, China, South Korea, and Japan. Government-backed initiatives and private investments are driving developments in 3D display technologies, which have become integral to applications such as virtual reality, augmented reality, and medical imaging. For example, the U.S. Department of Energy in 2023 funded research to improve energy-efficient display technologies, while Japan's METI launched subsidies for companies developing innovative 3D display systems.
3D Display Market Size and Forecast
-
Market Size in 2023: USD 123.17 Billion
-
Market Size by 2032: USD 561.50 Billion
-
CAGR: 18.39% from 2024 to 2032
-
Base Year: 2023
-
Forecast Period: 2024–2032
-
Historical Data: 2020–2022
Get E-PDF Sample Report on 3D Display Market - Request Sample Report
3D Display Market Trends:
-
Growing adoption of 3D displays in gaming, entertainment, and AR/VR is driving demand, with the AR/VR user base expected to grow at a CAGR of over 25% through 2030.
-
Increasing use of glasses-free (autostereoscopic) 3D displays is improving user experience, accounting for over 35% of new 3D display developments.
-
Rising integration of 3D displays in medical imaging and surgical visualization is enhancing diagnostic accuracy by 20–30%.
-
Advancements in OLED, microLED, and light field technologies are improving brightness and depth perception, boosting display performance by 30%.
-
Growing demand for 3D displays in automotive dashboards and HUDs is accelerating adoption, with automotive 3D display penetration expected to exceed 40% in premium vehicles by 2030.
Advances in the technology field also catch much attention and include improved glasses-free 3D display systems, holographic technologies, and OLED-based 3D displays. Samsung exhibits OLED monitors for 3D gaming without glasses or headset. The 3D monitors with an OLED panel enable stereoscopic display in 4K resolution without any aids. In 2023, firms such as LG, Sony, and Samsung were launching highly advanced products consisting of stereoscopic displays tailored for gaming and head-mounted displays designed particularly for AR and VR environments. Companies in South Korea have gained a large increase in manufacturing 3D OLED panels, which is a crucial piece in high-end consumer devices. China also invested in its 3D visualization technologies both for industrial and health care applications showing its interest in leadership in the marketplace.
The future of the 3D display market is vast, especially when it comes to expanding applications such as automotive HUDs, advanced medical imaging systems, and business virtual collaboration platforms. A 2023 report by the European Commission revealed that industries applying 3D visualization began to gain efficiency and accuracy in their processes. Another new growth avenue for the market will be the increasing integration of AI with 3D displays to produce adaptive, real-time content.
3D Display Market Dynamics
Key Drivers:
-
The Growing Popularity of 3D Displays in Entertainment and Gaming Industries.
The highest demand driver for 3D displays is the increased adoption in entertainment and gaming. Since 58% of gaming enthusiasts across the globe are interested in experiencing 3D, big industry players are releasing 3D-compatible monitors and AR/VR headsets to address consumer demand. The immersive nature of 3D visuals maximizes user engagement, and entertainment companies use 3D displays for movies, live events, and streaming applications.
Moreover, the Japanese and South Korean governments have made initiatives towards promoting innovation in gaming technology. These initiatives have increased the adoption of 3D displays by several folds. For example, in 2023, South Korea has registered an increase of 21% in the usage of AR/VR devices. The segment is highly dependent on 3D display technology. This is indicative of the industry's shift towards creating interactive and hyper-realistic experiences. This is why 3D displays are a necessary component of the digital entertainment ecosystem.
-
Increasing Demand for 3D Displays in Healthcare Applications
3D displays have completely transformed medical imaging and surgical procedures in healthcare. The U.S. National Institutes of Health suggests that 3D imaging provides a 32% more accurate diagnosis than the conventional 2D imaging techniques. In 2023, the adoption of 3D displays for healthcare applications like robotic surgeries, radiology, and patient education was widely used by global healthcare systems. Such demand is further encouraged by government-backed projects such as the Horizon 2020 initiative sponsored by the EU, which encourages advanced visualization tools in healthcare.
The provision of depth perception and anatomical visualization via a 3D display strongly reinforces clinical outcomes. For instance, Chinese hospitals, in 2024, recorded a surge of 17% from successes in surgeries with the employment of 3D visual presentation devices. It shows how patient care and surgery precision can transform their careers when in charge.
Restrain:
-
High Cost of 3D Display Technology and Limited Affordability
The significant market restraint is the very high cost of 3D display technology, which has not improved despite recent advancements. The processes for developing and manufacturing 3D displays involve expensive components such as high-resolution panels and advanced projection systems that make these products inaccessible to small businesses and consumers in emerging economies. For example, according to the 2023 report by the Indian Ministry of Electronics and IT, the adoption of 3D display technology in India is still limited, citing the challenge of affordability.
The cost of supporting hardware, such as AR/VR headsets or specialized monitors, is also added to the overall cost. Although governments in developed nations provide subsidies and incentives to encourage technology adoption, this support is often missing in developing countries. This issue requires significant investment in R&D to reduce production costs and make the technology more accessible globally, thus allowing for broader market penetration.
3D Display Market Key Segments
By Product
The Stereoscopic Display segment was the market leader in 2023, with 63% of market share, driven by its wide application in gaming, entertainment, and advertising. The stereoscopic display uses glasses-based or glasses-free technology to provide immersive visuals, which makes it very popular among consumers.
The projected growth of head-mounted displays will be the fastest when they reach a CAGR of 19.32% for the estimated period from 2024 to 2032. Growth factors include enhanced adoption in virtual reality applications as well as augmented reality and in gaming and simulations related to training.
By Technology
In 2023, LED took the lead in the market, with a market share of 29.67% due to its energy efficiency and widespread use across all industries. LEDs provide brightness and color accuracy, making them suitable for outdoor advertising and consumer electronics applications.
Organic LED (OLED) displays are expected to grow with the fastest CAGR of 5.59% during the forecasting period from 2024 to 2032, through their flexibility, superior contrast ratios, and lightweight design. OLEDs are increasingly getting used in smartphones, wearables, and next-generation TVs, with the impetus coming from investments in research and development by manufacturers based in Japan and South Korea.
3D Display Market Regional Outlook
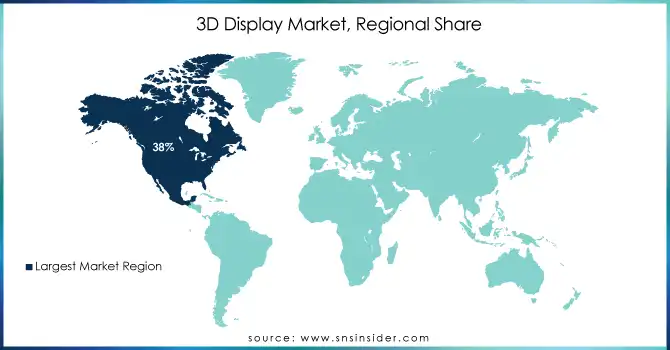
North America dominated 3D Display Market in 2023 with 38% of market share. Early adoption of advanced technology along with robust investments in R&D is the reason for such dominance. The U.S., in particular, leads the world in AR/VR application development and medical imaging technology powered by 3D displays.
Asia Pacific, on the other hand, is expected to expand with a CAGR of 19.14% over the forecast period from 2024 to 2032, driven by growing demand in countries like China, Japan, and India, supported by government initiatives and private investment in adopting technology. This can be seen in the examples: The "Make in India" program promotes local production of electronic components, for example, displays, whereas the emphasis on digital innovation by China accelerates further regional market expansion.
Get Customized Report as Per Your Business Requirement - Request For Customized Report
Key 3D Display Companies are:
-
Samsung Electronics (3D TVs, OLED displays)
-
LG Electronics (3D OLED TVs, gaming monitors)
-
Sony Corporation (3D cameras, stereoscopic displays)
-
Panasonic Corporation (3D projectors, LED displays)
-
Barco NV (3D video walls, cinema projectors)
-
AU Optronics (3D LCD panels, touch displays)
-
Toshiba Corporation (3D laptops, 4K displays)
-
EON Reality (3D virtual reality solutions, simulation systems)
-
Koninklijke Philips (3D medical imaging displays, signage displays)
-
SHARP Corporation (3D mobile displays, LED-backlit panels)
-
Hisense (3D smart TVs, laser TVs)
-
nVIDIA Corporation (3D graphics processing units, stereoscopic 3D solutions)
-
Fujitsu Limited (3D imaging solutions, holographic displays)
-
Planar Systems (3D video walls, digital signage)
-
Looking Glass Factory (holographic displays, 3D light-field displays)
-
Zebra Imaging (holographic projection systems, 3D mapping)
-
3DFusion (glasses-free 3D displays, volumetric displays)
-
RealView Imaging (medical holography, 3D surgical displays)
-
Dimenco (autostereoscopic displays, 3D visualization tools)
-
Vizio Inc. (3D smart TVs, UHD displays)
Major Suppliers (Components, Technologies)
-
Corning Incorporated (glass substrates, optical components)
-
3M Company (optical films, adhesive solutions)
-
Dow Inc. (encapsulation materials, adhesives)
-
Merck KGaA (liquid crystal materials, organic electronics)
-
Nitto Denko Corporation (polarizer films, optical filters)
-
Asahi Glass Co., Ltd. (glass substrates, optical coatings)
-
Shin-Etsu Chemical (silicon wafers, optical materials)
-
Sumitomo Chemical (OLED materials, polymer films)
-
Universal Display Corporation (OLED emitters, host materials)
-
Nichia Corporation (LED components, phosphors)
Major Clients
-
Netflix
-
Walt Disney Studios
-
Tencent Games
-
Samsung Electronics (B2B for components)
-
Tesla Inc.
-
Medtronic
-
Sony Interactive Entertainment
-
Microsoft (Xbox division)
-
Boeing
-
Intel Corporation
Recent Trends
-
December 2024: At Gamescom 2024 in Cologne, Germany, Samsung Electronics unveiled its newest gaming monitors, with particular emphasis on the groundbreaking Odyssey 3D, which can offer a glass-free viewing of 3D contents. The innovative light field display (LFD) technology allows the Odyssey 3D to create lifelike images that appear three-dimensional from normal 2D content. This is achieved through a lenticular lens1 at the front panel. With Eye Tracking and View Mapping technology, Odyssey 3D ensures an optimally optimized 3D experience without the need to wear separate 3D glasses.
-
September 2023: Sony India launched a new product, ELF-SR2 Spatial Reality Display. This is a 27-in 4K screen, showing lifelike 3D content without any requirement of special glasses or any VR equipment. Images carried by the display show sharp and great 3D effect.
| Report Attributes | Details |
|---|---|
| Market Size in 2023 | USD 123.17 Billion |
| Market Size by 2032 | USD 561.50 Billion |
| CAGR | CAGR of 18.39% From 2024 to 2032 |
| Base Year | 2023 |
| Forecast Period | 2024-2032 |
| Historical Data | 2020-2022 |
| Report Scope & Coverage | Market Size, Segments Analysis, Competitive Landscape, Regional Analysis, DROC & SWOT Analysis, Forecast Outlook |
| Key Segments | • By Product (Volumetric Display, Stereoscopic Display, Head-Mounted Display), • By Application (Television, Smartphones, Monitor, Mobile Computing Devices, Projectors, Others), • By Technology (Digital Light Processing, Plasma Display Panel, Organic LED, Light Emitting Diode) • By Access Method (Micro Display, Conventional/Screen Based Display) • By End-use (Consumer Electronics, Automotive and Transportation, Medical, Aerospace & Defense, Industrial, Others) |
| Regional Analysis/Coverage | North America (US, Canada, Mexico), Europe (Eastern Europe [Poland, Romania, Hungary, Turkey, Rest of Eastern Europe] Western Europe] Germany, France, UK, Italy, Spain, Netherlands, Switzerland, Austria, Rest of Western Europe]), Asia Pacific (China, India, Japan, South Korea, Vietnam, Singapore, Australia, Rest of Asia Pacific), Middle East & Africa (Middle East [UAE, Egypt, Saudi Arabia, Qatar, Rest of Middle East], Africa [Nigeria, South Africa, Rest of Africa], Latin America (Brazil, Argentina, Colombia, Rest of Latin America) |
| Company Profiles | Samsung Electronics, LG Electronics, Sony Corporation, Panasonic Corporation, Barco NV, AU Optronics, Toshiba Corporation, EON Reality, Koninklijke Philips, SHARP Corporation, Hisense, nVIDIA Corporation, Fujitsu Limited, Planar Systems, Looking Glass Factory, Zebra Imaging, 3DFusion, RealView Imaging, Dimenco, Vizio Inc. |
| Key Drivers | • The Growing Popularity of 3D Displays in Entertainment and Gaming Industries. • Increasing Demand for 3D Displays in Healthcare Applications. |
| Restraints | • High Cost of 3D Display Technology and Limited Affordability. |
Frequently Asked Questions
Ans: North America dominated the 3D Display Market in 2023.
Ans: The 3D Display Market is expected to grow at a CAGR of 18.39% during 2024-2032.
ANS: AUO Corporation, BOE Technology Group Co., Ltd., Innolux Corporation, Japan Display Inc., LG Electronics, SAMSUNG, SHARP CORPORATION, Sony Corporation, Truly Semiconductor Co., Ltd., Vision ox Company
Ans: The major growth factors of the 3D Display Market is Growing Popularity of 3D Displays in Entertainment and Gaming Industries.
Ans: 3D Display Market size was USD 123.17 Billion in 2023 and is expected to Reach USD 561.50 Billion by 2032.
Get in Touch
