Automated Cell Shakers Market Size & Trends:
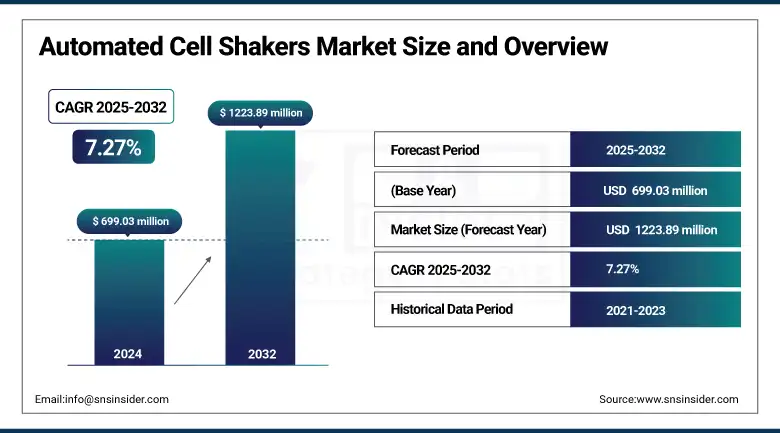
The Automated Cell Shakers Market size was valued at USD 699.03 million in 2024 and is expected to reach USD 1223.89 million by 2032, growing at a CAGR of 7.27% over 2025-2032.
The global automated cell shakers market is witnessing a high rise on account of its applications mainly in biopharmaceutical production, cell-based assays, and academic research. Some other things driving growth are an increase in spending on biotech R&D, continued automation of cell culture workflows, and increased demand for high-throughput screening technologies.
To Get more information On Automated Cell Shakers Market - Request Free Sample Report
In March 2024, Eppendorf AG launched an automated orbital shaker with integrated CO₂ incubation for long-term stem cell and vaccine production, clearly showing signs towards modular, automated lab ecosystems.
Automated cell shakers are a critical tool for enabling an ideal environment for cell growth and protein expression, especially in large-volume biologics manufacturing. Personalization of medicine and production of monoclonal antibodies have markedly increased the need for scalable, reproducible, contamination-free cell culture systems.
Global R&D spending in life sciences exceeded USD 230 billion in 2023, and a majority of this funding was deployed here. The automated cell shakers market growth in the number of biologics and cell therapy approvals is having a positive effect on market uptake, with both the FDA and EMA also promoting automation to reduce the potential for human error. Supply-side automated cell shakers market growth is supported by active investments on the part of key participants such as Thermo Fisher Scientific, Eppendorf, and Benchmark Scientific, bringing forth smart, IoT-enabled platform shakers in a bid to improve the productivity of labs.
In January 2024, Thermo Fisher Scientific boosted its capacity with the opening of a new automated cell culture instrument factory, pointing to growing manufacturing investments in line with growing global demand.
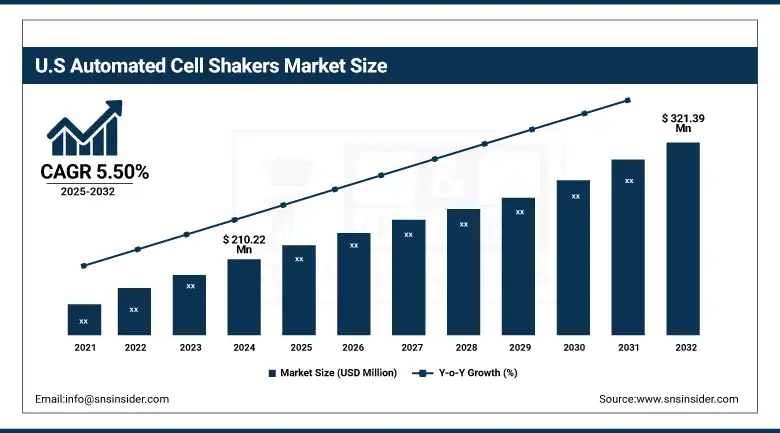
The U.S. automated cell shakers market size was valued at USD 210.22 million in 2024 and is expected to reach USD 321.39 million by 2032, growing at a CAGR of 5.50% over 2025-2032. Huge investments in biologics, stem cell research, and cell-based assays are leading the way in the US, backed by robust funding support from institutions such as NIH, which outlaid more than USD 45 billion in biomedical research funding for 2023. The area also has a large presence of major players, including Thermo Fisher Scientific and Corning Incorporated. Canada is next behind, with more growing biotech hubs in Toronto and Vancouver, just as Mexico is growing its pharmaceutical manufacturing base, requiring more automated laboratory systems.
Automated Cell Shakers Market Dynamics:
Drivers:
-
Automation Trends, Rising Biologics Production, and R&D Advancements are Accelerating Market Demand
The key factors driving the automated cell shakers market trends are the advancements in cell culture technology, increasing preference for biologics, and increasing biotechnology R&D. As biologic drug production becomes more complex and scaled, the Ahuja brothers estimate that automated cell shakers enable greater reproducibility, minimise risk of contamination, and improve efficiency all crucial factors in today’s labs. The increasing use of monoclonal antibodies (mAb), gene therapeutics, and stem cell culture applications is driving increased demand for robotic systems that reduce operator labor and provide consistent mixing and aeration.
In 2024, the U.S biopharmaceutical sector spent more than USD 122 billion on R&D, a large portion of which targeting cell-based assays and automation technologies (PhRMA 2024).
Regulatory authorities such as the FDA and the EMA have stressed the implementation of Good Laboratory Practices (GLP) and automatic quality assurance, which in turn supports the automated cell shakers market. New models have been developed with inbuilt monitoring systems, and all are compatible with the IoT, indicating significant advances in the supply-side innovations in this growing global market.
Restraints:
-
High Initial Investment and Integration Challenges Limit Wider Adoption of Automated Systems
A few limitations are holding back broader use, even with the growing automated cell shakers market analysis. A major barrier is the substantial (generally USD 10,000– USD 50,000 per device) capital investment in automatic systems, which is relatively expensive for academia and industry starters. Additionally, integration with old systems and the necessity of technical training also delay the application. It was revealed that 37% of small-scale labs in emerging markets are unable to afford full automation systems and must continue to use manual or semi-automated methods, according to a 2023 BioProcess International survey.
Furthermore, the current lack of universal standardization between shaker models and brands further hampers compatibility within electromechanical lab automation hubs. Confirms are difficult as well in markets that do not have strong compliance enforcement for GMP and GLP conditions, and limit the ability to provide products on a global basis. High precision for the mechanical and electronic components has contributed to the continued supply bottleneck for these devices, with global chip shortages and logistics constraints pushing back product delivery schedules for key companies, including New Brunswick Scientific and Grant Instruments. These factors in combination restrict the automated cell shakers market share expansion even as demand increases.
Automated Cell Shakers Market Segmentation Analysis:
By Product
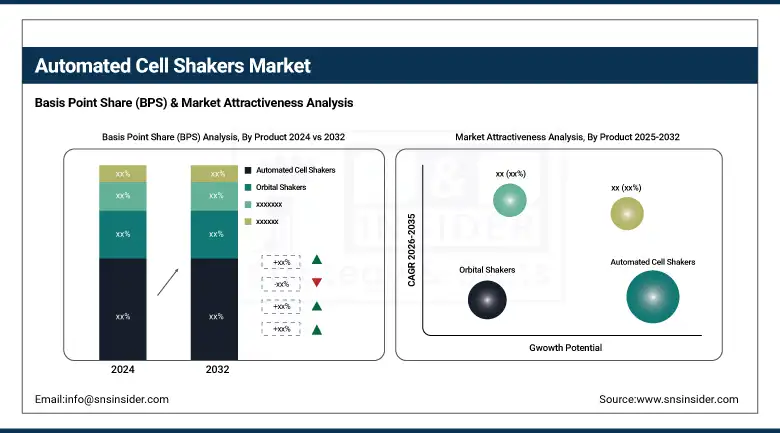
The automated cell shakers segment dominated the global automated cell shakers market with a 37.2% revenue share in 2024 as a result of their utilization in large bioprocessing and automated laboratories. They offer superior reproducibility, contamination control, and are necessary for regulated cell culture environments, which are essential in biologics and vaccine production. Their incorporation with smart lab technologies, including IoT-based monitoring and programmable shaking profiles, has expanded their use in R&D and commercial-scale production.
The orbital shakers product segment, however, is expected to witness faster growth. They are relatively inexpensive, easy to use, and applicable to many situations (especially in cell culture and reagent mixing), which Favale finds appealing for smaller labs and new biotech companies. Improved orbital motion and versatility with a variety of vessel types over the past few years have led to their popularity in academic and contract research laboratories.
By Application
The drug development segment contributed the highest share of 38.3% in 2024 due to increased use of the cell shakers completely through high-throughput screening, cell-based assays, and chamber cytotoxicity testing within the early stages of drug development through prescription R&D corporations. Pharmaceutical companies are increasingly emphasizing solid and scalable cell culture systems with their increasing number of biologics and personalized medication in the pipeline, and automated shakers are essential to this process.
The regenerative medicine application segment, on the other hand, is expected to be the fastest-growing application as a result of growing investment in stem cell and tissue engineering research. For such treatments, precise and reproducible culture conditions are necessary and can effectively be implemented using automated shakers. With regenerative therapies moving toward commercialization, there is also an increasing interest in automated devices that meet clinical-grade manufacturing requirements.
By End Use
Among end-users, pharmaceutical companies were the largest drivers of the market in 2024, with a 39.4% share, due to the huge R&D budget they have to spend and the demand for high-throughput and standardized cell culture systems for drug discovery and toxicity testing. Automation of the cell shaking process enables more scalable and productive processes, and is therefore essential to the drug development pipeline.
The CDMOs & CMOs (Contract Development and Manufacturing Organizations) are anticipated to grow at the highest CAGR from growing outsourcing of biologics manufacturing and growing demand for flexible & modular lab instruments. These companies are looking at automating their processes for productivity gains, accuracy, and compliance with rigorous biologic product regulations.
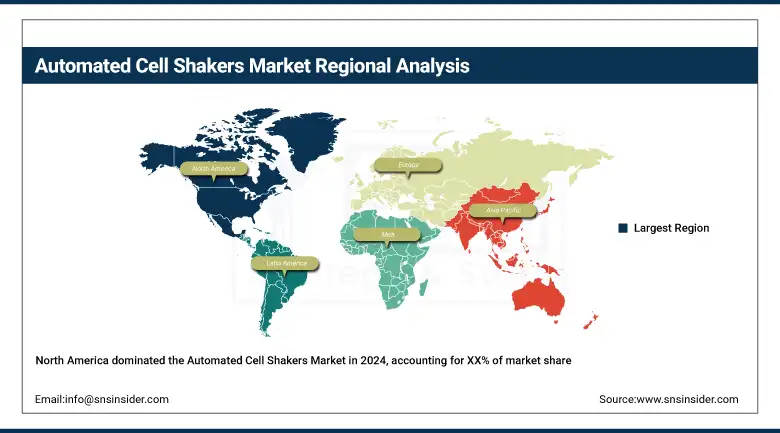
Automated Cell Shakers Market Regional Insights:
North America accounted for the leading share of the global automated cell shakers market in 2024, due to an advanced infrastructure for biotechnology and pharmaceutical research in the country.
Get Customized Report as per Your Business Requirement - Enquiry Now
Europe is the second-largest market for the automated cell shakers market. The growth in this region is supported by the stringent regulations for product approvals, the increasing number of clinical studies on cell and gene therapy products, and the growing market for regenerative medicine.
Germany is the biggest donor since it houses a strong pharma R&D ecosystem as well as companies such as Eppendorf AG and Sartorius. In 2023, Germany spent more than EUR 22 billion on healthcare R&D, further consolidating its lead. The UK and France are also playing leading roles due to government-supported funds for innovation and cell therapy research centers. In the meantime, Poland and Turkey are developing countries where biotechnology education and infrastructure for production are being invested.
Asia Pacific is expected to register the fastest CAGR in the global market, owing to the increasing growth of the pharmaceutical and biotech industries, burgeoning healthcare expenditure, and supportive government policies. China is a regional powerhouse, supported by a robust local manufacturing sector, increasing investments in automation, and an increasing uptake of high-throughput screening in life sciences.
By 2023, R&D spending in China topped USD 440 billion, including significant amounts invested in biotech.
India is fast becoming a global contract manufacturing hub; both CDMOs and biopharma companies are heavily investing in lab automation. The stem cell therapy and regenerative medicine segments are being advanced by Japan and South Korea, which is fueling demand for precision cell culture systems.
Key Players in the Automated Cell Shakers Market:
Leading automated cell shakers companies in the global market comprise Thermo Fisher Scientific Inc., Eppendorf AG, Ohaus Corporation, Benchmark Scientific, Corning Incorporated, Grant Instruments, Kuhner Shaker, Infors AG, Boekel Scientific, and VELP Scientifica Srl, all playing a pivotal role in advancing technologies and expanding product offerings within the market.
Recent Developments in the Automated Cell Shakers Market:
-
In January 2025, Kuhner introduced its first MPS‑Z Automated microtiter plate shaker, designed for 24/7 unattended cell culture processing. This marks a significant milestone in continuous, high-throughput automated workflows and was immediately adopted by its first customer.
-
In December 2024, Heidolph launched its Hei‑SHAKE Orbital Core. Featuring a broad speed range (1–530 rpm), minimal heat generation, energy-efficient operation, and maintenance-free design, this shaker caters to diverse cell-culture and staining applications.
| Report Attributes | Details |
|---|---|
| Market Size in 2024 | USD 699.03 million |
| Market Size by 2032 | USD 1223.89 million |
| CAGR | CAGR of 7.27% From 2025 to 2032 |
| Base Year | 2024 |
| Forecast Period | 2025-2032 |
| Historical Data | 2021-2023 |
| Report Scope & Coverage | Market Size, Segments Analysis, Competitive Landscape, Regional Analysis, DROC & SWOT Analysis, Forecast Outlook |
| Key Segments | • By Product (Automated Cell Shakers, Orbital Shakers, Benchtop Incubator Shakers, Cell Shaker with Rotatory Arms, Accessories, and Others) • By Application (Drug Development, Regenerative Medicine, Cell Therapy, and Stem Cell Research) • By End Use (Pharmaceutical Companies, Biopharmaceutical Companies, CDMOs & CMOs, Hospitals, and Others) |
| Regional Analysis/Coverage | North America (US, Canada, Mexico), Europe (Germany, France, UK, Italy, Spain, Poland, Turkey, Rest of Europe), Asia Pacific (China, India, Japan, South Korea, Singapore, Australia, Rest of Asia Pacific), Middle East & Africa (UAE, Saudi Arabia, Qatar, South Africa, Rest of Middle East & Africa), Latin America (Brazil, Argentina, Rest of Latin America) |
| Company Profiles | Thermo Fisher Scientific Inc., Eppendorf AG, Ohaus Corporation, Benchmark Scientific, Corning Incorporated, Grant Instruments, Kuhner Shaker, Infors AG, Boekel Scientific, and VELP Scientifica Srl |
Frequently Asked Questions
Ans: Future trends include integration with IoT and AI for smart lab operations, increased demand from CDMOs/CMOs, and expanded use in stem cell, gene therapy, and personalized medicine research.
Ans: North America, led by the U.S., dominates in supply due to advanced lab infrastructure and high biotech R&D; Europe and Asia Pacific follow with strong manufacturing and innovation ecosystems.
Ans: Major players include Thermo Fisher Scientific, Eppendorf AG, Kuhner Shaker, Infors AG, Corning Incorporated, Grant Instruments, and Benchmark Scientific.
Ans: Rising demand for automated cell culture in biologics and regenerative medicine, increased R&D investments, and the push for high-throughput, contamination-free workflows are key drivers of market growth.
Ans: The automated cell shakers market size was valued at USD 699.03 million in 2024 and is expected to reach USD 1223.89 million by 2032, growing at a CAGR of 7.27% over 2025-2032.
Get in Touch
