Smart Ticketing Systems Market Report Scope & Overview:
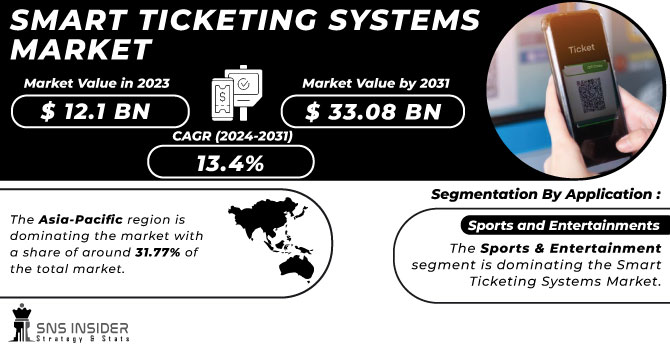
The Smart Ticketing Systems Market size was valued at USD 12.1 Billion in 2023 and is now anticipated to grow to USD 33.08 Billion by 2031, displaying a compound annual growth rate (CAGR) of 13.4% during the forecast Period 2024-2031.
The Smart Ticketing Systems Market is growing at a steady rate with a variety of factors into picture. Key factor for the growth is the machines offer much faster & convenient alternative then traditional booths at the same time reducing time.
Smart Ticketing Systems Market Size and Forecast:
-
Market Size in 2023: USD 12.1 Billion
-
Market Size by 2031: USD 33.08 Billion
-
CAGR: 13.4% from 2024 to 2031
-
Base Year: 2023
-
Forecast Period: 2024–2031
-
Historical Data: 2021–2023
Get More Information on Smart Ticketing Systems Market - Request Sample Report
Smart Ticketing Systems Market Trends:
-
Increasing adoption of automated ticketing machines for faster and more convenient ticket purchasing
-
Growing integration of contactless payments including cards, NFC, and mobile wallets
-
Rising deployment of smart ticketing in public transportation systems worldwide
-
Advancements in touchscreen interfaces and multilingual capabilities improving user experience
-
Expanding use of RFID, NFC, and IoT technologies for real-time fare calculation and system monitoring
-
Increasing focus on digital ticketing solutions to reduce paper usage and support sustainability initiatives
The ticket machine offers 24/7 availability for usage at any time. Also, the flexibility machines offer in payment mode like cash or cashless (card, contactless) is helping in the growth of the market. Further, technology advancements like interface touch screen & multiple languages cater to wide range of consumers. Also, the integration with smart ticketing systems for real time fare calculation, seamless ticket purchase is propelling the market. At the same time increasing government initiatives in public transportation is making a driving factor in market growth. Moreover, the rising awareness towards sustainability has reduced paper wastage by digitizing ticketing is further helping in market growth.
Market Dynamics
Drivers
-
Increasing effectiveness of ticket vending machines is helping in the market growth.
-
Reduced labor costs and operation times is driving the market towards growth.
Employing labor costs contribute to considerable share of costs to service providers. During service operation, the human error possibility is high which could lead to higher operational time while automatic machines operate error-free and is less time taking. At the same time, it reduces human resource need at each step of operation thus cutting cost.
Restraints
-
High cost of Installation may be a restraining factor in the market growth.
-
Operational network failure is creating a restraint in the growth of market.
Opportunities
-
Reduced cost of operation & improved security is creating growth opportunities for the market.
-
Increasing popularity of digital payment in Smart Ticketing Systems is creating growth opportunities.
Manufacturers are focusing more towards machine innovation like RFID, NFC & Zigbee technology in order to gain competitive advantage. These technologies provide proactive maintenance & remote monitoring to pinpoint any problems associated with automated ticket machines. This advancement is creating more convenience and drawing more customers. At the same time lesser chance of operation.
Challenges
-
Integrating Smart Ticketing Systems with existing old systems can be complicating leading to challenges.
-
Constant maintenance requirements to ensure proper functionality is creating challenge in the market growth
Impact of Russia-Ukraine War
The Russia-Ukraine war has a huge impact on Smart Ticketing Systems Market. With disruptions in the global supply chain with Russia as an exporter of raw materials used in machine like screens, printers lead to shortage and price hikes. The price hike can lower down the profit margins for manufacturers. The war has increased the transportation costs with imports as-well-as exports of finished goods & intermediate goods further complicating matters. The war is also affecting the demand with economic uncertainties that are affected by the war especially Europe because of its proximity. The war has put a halt in the upgradation in infrastructure also including public transportation system putting a dip in demand for automatic ticket machines. But on the other side, governments may encourage domestic manufacturer amidst of war to reduce reliance over disrupted global supply chain and may prioritize in maintaining & upgrading existing machines benefitting service & maintenance solutions.
Impact of Economic Slowdown
The economic slowdown war has a huge impact on Smart Ticketing Systems Market. The slowdown has impacted growth and production with tight government as-well-as business budgets causing a dip in demand for public transport investment. Transport authorities may delay in investing new ticketing systems having a direct impact in demand for Smart Ticketing Systems. The slowdown is also affecting supply chains causing longer lead time and delaying production schedules thus inflating the cost for manufacturing. Also, the slowdown is causing job loss impacting availability of skilled labor required for fabrication of ticket machines. On the other side, the slowdown can prioritize commuters to use public transport instead of private ones in order to save money. Installing Smart Ticketing Systems during the slowdown can also reduce labor cost by elimination of staff booth and providing efficiency in ticket managing process. Also targeting sectors less affected by slowdown like train stations & Airports can help in stabilizing the market.
Segmentation Analysis
By Type
-
Cash Payment
-
Online Payment
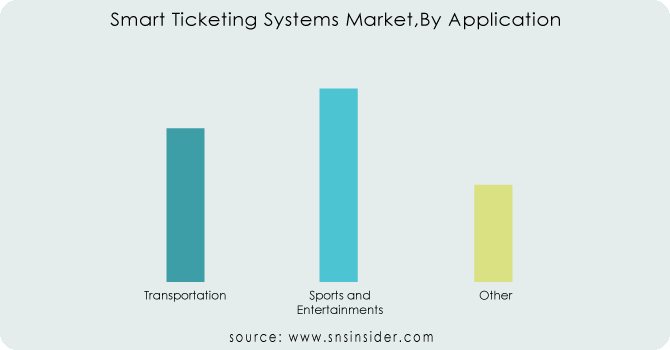
By Application
-
Transportation
-
Sports and Entertainments
-
Other
The Sports & Entertainment segment is dominating the Smart Ticketing Systems Market. The dominance is because of increasing number of retail setups & multi-specialty hubs for entertainment & games is providing just-in-time ticketing thereby reducing time. Also, the integration of smart ticketing systems by use of IoT & AI is further making convenience for customers.
Need Customized Research on Smart Ticketing Systems Market - Enquiry Now
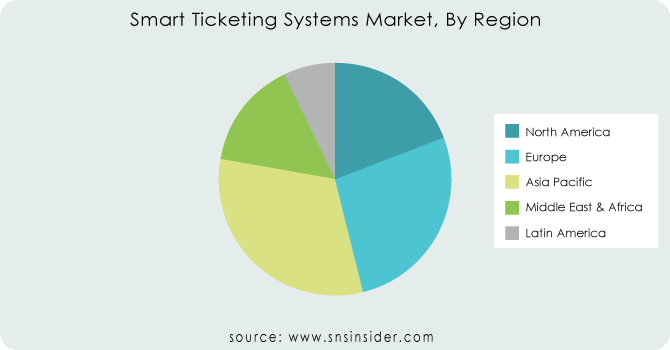
Regional Analysis
The Asia-Pacific region is dominating the market with a share of around 31.77% of the total market. The dominance is because of factors like rising passengers travelling via buses, growing railway traffic & renovation projects for airports and commercial buildings across the region. Also, various sectors are contributing towards dominance like movie theaters, commercial stores are growing along with emerging economies with heavy investments on infrastructure is driving the growth for the market in this region.
Europe is the fastest growing region due to presence of key manufacturers of interactive kiosks.
Regional Outlook
North America
-
US
-
Canada
-
Mexico
Europe
-
Eastern Europe
-
Poland
-
Romania
-
Hungary
-
Turkey
-
Rest of Eastern Europe
-
-
Western Europe
-
Germany
-
France
-
UK
-
Italy
-
Spain
-
Netherlands
-
Switzerland
-
Austria
-
Rest of Western Europe
-
Asia Pacific
-
China
-
India
-
Japan
-
South Korea
-
Vietnam
-
Singapore
-
Australia
-
Rest of Asia Pacific
Middle East & Africa
-
Middle East
-
UAE
-
Egypt
-
Saudi Arabia
-
Qatar
-
Rest of the Middle East
-
-
Africa
-
Nigeria
-
South Africa
-
Rest of Africa
-
Latin America
-
Brazil
-
Argentina
-
Colombia
-
Rest of Latin America
Key Players
The major key players are Parkeon, Xerox Corporation, CPI Card Group Inc., Infineon Technologies AG, NXP Semiconductors, Scheidt & Bachmann GmbH, Gemalto NV, Cubic Corporation, Diebold Nixdorf Incorporated, SBB and others.
Xerox Corporation-Company Financial Analysis
Recent Development
-
In April 2024, Scheidt & Bachmann announced a partnership with a European transportation authority to implement multimodal ticketing machines across their network. This allows passengers to purchase tickets for buses, trains, and trams on a single platform, enhancing convenience for multi-modal commuters.
| Report Attributes | Details |
|---|---|
| Market Size in 2023 | US$ 12.1 Billion |
| Market Size by 2031 | US$ 33.08 Billion |
| CAGR | CAGR of 13.4% From 2024 to 2031 |
| Base Year | 2023 |
| Forecast Period | 2024-2031 |
| Historical Data | 2020-2022 |
| Report Scope & Coverage | Market Size, Segments Analysis, Competitive Landscape, Regional Analysis, DROC & SWOT Analysis, Forecast Outlook |
| Key Segments | • By Type (Cash Payment, Online Payment) • By Application (Transportation, Sports And Entertainments, Others) |
| Regional Analysis/Coverage | North America (US, Canada, Mexico), Europe (Eastern Europe [Poland, Romania, Hungary, Turkey, Rest of Eastern Europe] Western Europe] Germany, France, UK, Italy, Spain, Netherlands, Switzerland, Austria, Rest of Western Europe]), Asia Pacific (China, India, Japan, South Korea, Vietnam, Singapore, Australia, Rest of Asia Pacific), Middle East & Africa (Middle East [UAE, Egypt, Saudi Arabia, Qatar, Rest of Middle East], Africa [Nigeria, South Africa, Rest of Africa], Latin America (Brazil, Argentina, Colombia, Rest of Latin America) |
| Company Profiles | Parkeon, Xerox Corporation, CPI Card Group Inc., Infineon Technologies AG, NXP Semiconductors, Scheidt & Bachmann GmbH, Gemalto NV, Cubic Corporation, Diebold Nixdorf Incorporated, SBB |
| Key Drivers | • Increasing effectiveness of ticket vending machines is helping in the market growth. • Reduced labor costs and operation times is driving the market towards growth. |
| Restraints | • High cost of Installation may be a restraining factor in the market growth. • Operational network failure is creating a restraint in the growth of market. |
Frequently Asked Questions
Ans: Parkeon, Xerox Corporation, CPI Card Group Inc., Infineon Technologies AG, NXP Semiconductors, Scheidt & Bachmann GmbH, Gemalto NV, Cubic Corporation, Diebold Nixdorf Incorporated, SBB, Thales Group, Kiosk Information Systems, AEP Ticketing Solutions, LecIP, Vix Technology, Wincor Nixdorf, St. Andrew’s Group, Micros Systems, Kaba Group, Zebra Technologies.
Ans: Increasing effectiveness of ticket vending machines is helping in the market growth.
Ans: The Market is expected to grow at a CAGR of 13%.
Ans: Asia-Pacific is expected to hold the largest market share in the market during the forecast period.
Ans: Operational network failure is creating a restraint in the growth of market.
Get in Touch
