Autonomous Oil Spill Detection Buoy Market Size Analysis:
The Autonomous Oil Spill Detection Buoy Market was valued at USD 354.26 million in 2025 and is expected to reach USD 940.55 million by 2035, growing at a CAGR of 10.23% from 2026-2035.
The Autonomous Oil Spill Detection Buoy market is witnessing significant advancements with the integration of cloud-based monitoring technologies that enable real-time data sharing among offshore operators, regulators, and onshore stakeholders. It ensures greater environmental regulation compliance by securing the monitoring and reporting of oil spills transparently and truthfully. Deployment of smart autonomous buoys across several offshore production assets reflects the increasing emphasis on the rapid detection and response to oil spill incidents to mitigate the risk of environmental damages.
June 2025 - A cloud-based Oil Spill Detection launched by Miros and Belga Marine, enabling real-time monitoring offshore Brazil, facilitating collaboration and enabling environmental compliance.
Autonomous Oil Spill Detection Buoy Market Size and Forecast
-
Market Size in 2025E: USD 354.26 Million
-
Market Size by 2033: USD 940.55 Million
-
CAGR: 10.23% from 2026 to 2035
-
Base Year: 2025
-
Forecast Period: 2026–2035
-
Historical Data: 2022–2024

To Get more information On Autonomous Oil Spill Detection Buoy Market Market - Request Free Sample Report
Autonomous Oil Spill Detection Buoy Market Trends
-
Rising need for environmental protection and early detection of marine oil spills is driving the autonomous oil spill detection buoy market.
-
Growing adoption of AI, IoT sensors, and real-time monitoring technologies is boosting market growth.
-
Expansion across oil & gas operators, offshore platforms, and environmental agencies is fueling deployment.
-
Increasing focus on regulatory compliance, risk mitigation, and maritime safety is shaping adoption trends.
-
Advancements in autonomous navigation, remote data transmission, and multisensor detection capabilities are enhancing accuracy and efficiency.
-
Rising investments in ocean monitoring, pollution control, and disaster response systems are supporting market expansion.
-
Collaborations between technology providers, government agencies, and environmental organizations are accelerating innovation and global adoption.
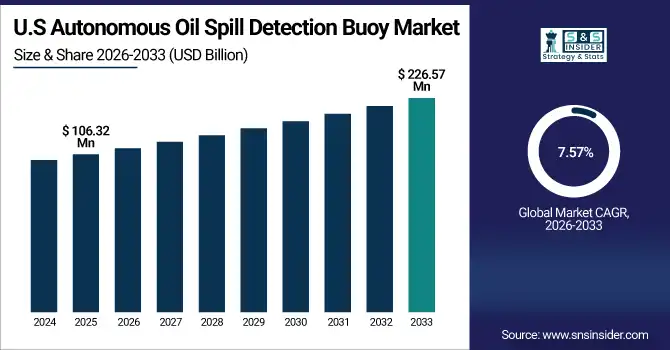
The U.S. Autonomous Oil Spill Detection Buoy Market was valued at USD 106.32 million in 2025 and is expected to reach USD 226.57 million by 2035, growing at a CAGR of 7.57% from 2026-2035. This Autonomous Oil Spill Detection Buoy Market growth is enormous due to factors such as increase in offshore oil and gas activities, tightening of environmental regulations, and a rising consciousness of marine ecosystem protection.
Autonomous Oil Spill Detection Buoy Market Growth Drivers:
-
Growing offshore activities and strict regulations are driving the expansion of the Autonomous Oil Spill Detection Buoy market.
Increasing demand for innovative subsea technology in the United States is fuelling remarkable growth of Autonomous Oil Spill Detection Buoy market. Our AUVs are equipped with advanced hydro acoustic, optical and scientific sensors for precise mapping, monitoring and surveillance of ecosystems, thereby facilitating timely oil spill detection and environmental protection. The accelerating global tensions and increasing stringent regulatory measures are compelling investments in unmanned systems to ensure rapid and effective oil spill response time. With more and more offshore activities and environmental issues around the globe, the local production strategy improves supply chains and responsiveness to changing market requirements; positioning the market for continued growth.
Kongsberg Discovery to start U.S. production of HUGIN autonomous underwater vehicles to support the increasing demand for cutting-edge subsea technology while also improving regional supply chain and customer responsiveness in light of growing global security threats.
Autonomous Oil Spill Detection Buoy Market Restraints:
-
High Costs and Technical Challenges Limit Adoption and Slow Growth of the Autonomous Oil Spill Detection Buoy Market
The growth of the Autonomous Oil Spill Detection Buoy market is restrained by several factors. High initial investment and maintenance costs limit adoption among smaller operators. The need for skilled professionals and sophisticated infrastructure to tackle technical complexities, such as sensor calibration and data integration, impose higher operational difficulties. The reliability is reduced, and the repair costs are increased due to the degradation and downtime of the system caused by harsh marine environments. The market is slowed down by regulatory delays and these lengthy approval processes causing slow deployment across most regions. Even so, interoperability across buoy systems is limited, preventing seamless sharing of data across stakeholders and ultimately lowering efficiency. Moreover, cloud-based and IoT-enabled solutions are at risk of cybersecurity vulnerabilities, which creates issues regarding data integrity and safety, further hindering the market growth, as the demand for advanced oil spill monitoring solutions is increasing.
Autonomous Oil Spill Detection Buoy Market Opportunities:
-
Technological Innovation and Diversification Drive Growth Opportunities in the Autonomous Underwater Robotics Market
The autonomous underwater robotics market is poised for substantial growth due to advancements in underwater drone technology and hybrid autonomous underwater vehicles (AUVs) that enable efficient seabed exploration, environmental monitoring, and industrial inspections. Features like wireless communication, real-time data transmission, corrosion-resistant materials, and modular designs improve operational efficiency and reduce maintenance in challenging marine environments. Expanding applications across defense, environmental management, and commercial sectors further broaden the market potential, positioning autonomous underwater robotics as a key enabler for enhanced marine exploration and industrial operations worldwide.
South Korean Robotics Company CILAB —A starting point for global expansion of the new-generation underwater inspection/observation drones Garda-M (operating up to 500m depth) and Garda-AUV (operating up to 1000 m depth self-provided seabed environment monitoring system). Their AUV is a hybrid wired/wireless AUV capable of military and industrial operations.
Autonomous Oil Spill Detection Buoy Market Challenges:
-
Technical Limitations and Environmental Factors Challenge Growth of Autonomous Oil Spill Detection Buoy Market
The Autonomous Oil Spill Detection Buoy market faces significant challenges that could hinder its expansion. Technical limitations such as sensor inaccuracies and difficulties in integrating diverse data sources reduce detection reliability. Marine conditions lead to wear and tear, corrosion and other equipment damage that increases maintenance and operating downtime. Moreover, restrictions in battery life and energy reduce the chances of long-term continuous monitoring. Buoy often drift in rough seas and capacity sensor response know the best depends on whether variability. Longer deployment is also due to restrictive and often complicated regulatory requirements and long delays in approvals. Such obstacles, alongside the associated cybersecurity hazards of cloud-connected platforms, prevent the broad uptake of oil spill monitoring, despite the global need for more effective monitoring solutions.
Autonomous Oil Spill Detection Buoy Market Segmentation Analysis:
By Product Type
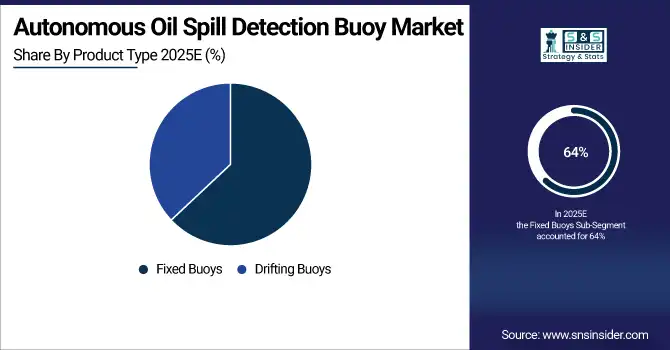
In 2025, the Fixed Buoys segment accounted for approximately 64% of the Autonomous Oil Spill Detection Buoy Market share, due the fixed installation in the strategic offshore locations which continues to monitor for oil spill incidents~a more reliable method. A lot more robust and able to bear sophisticated sensor arrays, thus enabling real-time accurate data collection through this fixed buoys. Industries needing shakedown surveillance like the offshore oil and gas sector also favor them because they can survive severe marine environments while providing continuous protection from the elements.
The Drifting Buoys segment is expected to experience the fastest growth in Autonomous Oil Spill Detection Buoy Market over 2026-2035 with a CAGR of 12.82%, This growth is due to the flexibility and mobility of these buoys which help them cover wider ocean areas and adapt to the dynamic nature of spill scenarios. Drifting buoys are an inexpensive, simple way to measure environmental conditions and are ideal platforms for rapid response as well as multi-day and multi-month monitoring. As they can transmit near real-time data during their movement with currents, it facilitates early detection of spills and hence increasing adoption across the marine environmental protection and offshore industries.
By Detection Technology
In 2025, the Optical Sensors segment accounted for approximately 40% of the Autonomous Oil Spill Detection Buoy Market share, driven by their high accuracy and ability to detect oil spills under various lighting conditions. These sensors provide detailed visual data, enabling precise spill identification and monitoring. Increasing demand for advanced, real-time detection technologies in offshore oil and gas operations and environmental monitoring is fueling the adoption of optical sensors. Their integration with autonomous buoys enhances early spill detection, supports rapid response efforts, and aligns with stringent environmental regulations, making them a key market driver.
The Fluorescence Sensors segment is expected to experience the fastest growth in Autonomous Oil Spill Detection Buoy Market over 2026-2035 with a CAGR of 12.53%, wing to the fact that they have a higher sensitivity for oil hydrocarbons found in low concentrations, allowing the exact and timely identification of oil spills. Fluorescence sensors provide higher detection efficiencies, minimize influences from different marine environments, and can distinguish between oil types 4. Environmental regulations are becoming stricter and the need for a fast response in case of a spill is also increasing, leading to these new sensors being incorporated into autonomous buoy systems faster and faster.
By Application
In 2025, the Offshore Oil & Gas segment accounted for approximately 35% of the Autonomous Oil Spill Detection Buoy Market share, There is an increasing demand for reliable detection technologies in these areas among potential clients, due to the stringent environmental regulations of such areas and high risk of a spill occurring there. Using Intelligent autonomous buoys with advanced sensors allows firms to better comply with regulators while minimizing environmental damage by detecting spills while it is still possible to do something about it. Growth of the segment is backed by continuous offshore drillings and the increasing implementation of environmental conservation activities in the oil & gas industry.
The Environmental Protection segment is expected to experience the fastest growth in Autonomous Oil Spill Detection Buoy Market over 2026-2035 with a CAGR of 14.39%, as global priorities continue to shift towards marine ecosystem preservation and environmental legislation continues to tighten. Early spill detection and real-time continuous monitoring are important due to the negative impact of spills and other catastrophes on living organisms; hence, autonomous buoys are vital tools for governments and organizations to mitigate the ecological damage caused by oil spills and other catastrophes. Increasing need for reduction of marine pollution coupled with investments in sustainable technologies also drive the uptake of these systems in environmental protection initiatives across the globe.
By End-User
In 2025, the Government Agencies segment accounted for approximately 38% of the Autonomous Oil Spill Detection Buoy Market share, driven by increasing regulatory mandates and the need for effective marine environmental monitoring. Governments deploy autonomous buoys to ensure rapid detection and response to oil spills, safeguarding coastal ecosystems and public health. Growing investments in maritime safety and environmental protection programs further support this segment’s expansion. Additionally, collaborations between agencies and technology providers enhance the deployment of advanced detection systems, strengthening spill prevention and compliance efforts globally.
The Research Institutes segment is expected to experience the fastest growth in Autonomous Oil Spill Detection Buoy Market over 2026-2035 with a CAGR of 11.82%, attributable to rising investments towards marine research and environmental studies that deal with the impact and mitigation of oil spills. Advanced autonomous buoy technologies are utilized in research institutions to facilitate more accurate data acquisition and evaluation as per myriad applications to support science and policy processes. Additionally, increasing partnerships with government and private bodies drive the demand and contribute to innovation-based deployment of advanced spill-detection solutions.
Autonomous Oil Spill Detection Buoy Market Regional Outlook:
North America Autonomous Oil Spill Detection Buoy Market Insights
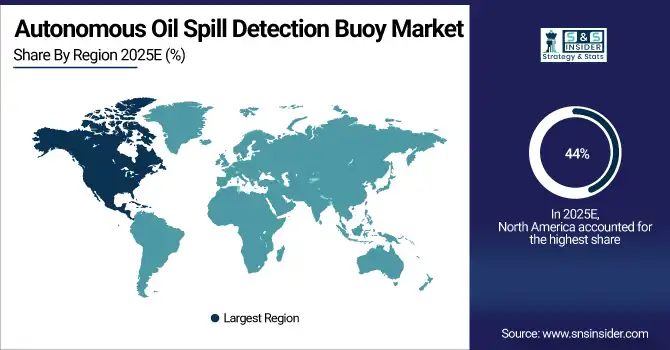
In 2025 North America dominated the Autonomous Oil Spill Detection Buoy Market and accounted for 44% of revenue share, This leadership is driven by stringent environmental regulations, significant offshore oil and gas activities, and substantial investments in advanced spill detection technologies. The region’s focus on marine safety and environmental protection fuels the adoption of autonomous buoys equipped with cutting-edge sensors. Additionally, strong government support and funding for research and development further accelerate market growth, making North America a key hub for innovation and deployment in oil spill detection solutions.
Get Customized Report as per Your Business Requirement - Enquiry Now
Asia Pacific Autonomous Oil Spill Detection Buoy Market Insights
Asia-Pacific is expected to witness the fastest growth in the Autonomous Oil Spill Detection Buoy Market over 2026-2035, with a projected CAGR of 11.95%. This growth is driven by rapid industrialization, expanding offshore oil and gas activities, and increasing environmental awareness across the region. Governments are implementing stricter regulations to protect marine ecosystems, boosting demand for advanced spill detection technologies. Additionally, rising investments in maritime infrastructure and growing collaborations between countries are accelerating the adoption of autonomous buoys for effective oil spill monitoring and environmental protection.
Europe Autonomous Oil Spill Detection Buoy Market Insights
In 2025, Europe emerged as a promising region in the Autonomous Oil Spill Detection Buoy Market, driven by stringent environmental regulations and strong government initiatives focused on marine conservation. The region’s commitment to reducing maritime pollution and enhancing offshore safety has increased demand for advanced oil spill detection technologies. Additionally, Europe’s robust research and development ecosystem and collaborations among industry stakeholders support innovation and deployment of autonomous buoy systems, further accelerating market growth.
Middle East & Africa and Latin America Autonomous Oil Spill Detection Buoy Market Insights
Latin America (LATAM) and the Middle East & Africa (MEA) regions are witnessing steady growth in the Autonomous Oil Spill Detection Buoy Market, driven by expanding offshore oil and gas exploration and increasing focus on environmental protection. Growing investments in maritime infrastructure and rising regulatory awareness are encouraging the adoption of advanced spill detection technologies. Additionally, strategic collaborations and government initiatives aimed at safeguarding marine ecosystems further support market expansion in these regions.
Autonomous Oil Spill Detection Buoy Market Competitive Landscape:
Kongsberg Gruppen ASA
Kongsberg Gruppen ASA, headquartered in Norway, is a global leader in maritime and defense technologies. In the autonomous oil spill detection buoy market, Kongsberg provides advanced marine monitoring systems that integrate real-time sensors, satellite connectivity, and AI-driven analytics. Their solutions enable rapid detection and response to oil spills, enhancing environmental safety, offshore operations, and regulatory compliance for oil and gas companies worldwide.
Xylem Inc.
Xylem Inc., based in the United States, specializes in water technology solutions. Leveraging its expertise in environmental monitoring, Xylem develops autonomous buoys equipped with advanced sensors for oil spill detection. Their systems provide continuous real-time data, remote monitoring capabilities, and integration with alert systems, helping industries and authorities minimize environmental impact and respond efficiently to spills in marine and freshwater ecosystems.
Teledyne Technologies Incorporated
Teledyne Technologies, headquartered in the U.S., is a leading provider of instrumentation and sensing technologies. In the autonomous oil spill detection buoy market, Teledyne offers marine-grade buoys equipped with optical, chemical, and hydroacoustic sensors. These platforms deliver precise, real-time detection of hydrocarbons, supporting early warning, environmental monitoring, and offshore safety. Their solutions are widely used in oil and gas operations, coastal management, and environmental protection initiatives.
Key Players
Some of the Autonomous Oil Spill Detection Buoy Market Companies
-
Kongsberg Gruppen ASA
-
Xylem Inc.
-
Siemens AG
-
Honeywell International Inc.
-
Fugro N.V.
-
Teledyne Technologies
-
Ocean Scientific International Ltd (OSIL)
-
NexSens Technology, Inc.
-
Aanderaa Data Instruments AS
-
EKO Instruments Co., Ltd.
-
MetOcean Telematics
-
AXYS Technologies Inc.
-
Develogic GmbH
-
Blue Ocean Monitoring
-
Sutron Corporation
-
Hydro-Bios Apparatebau GmbH
-
RBR Ltd.
-
OTT HydroMet
-
YSI Inc.
-
Valeport Ltd.
| Report Attributes | Details |
|---|---|
| Market Size in 2025 | USD 354.26 Million |
| Market Size by 2035 | USD 940.55 Million |
| CAGR | CAGR of 10.23% From 2026 to 2035 |
| Base Year | 2025 |
| Forecast Period | 2026-2035 |
| Historical Data | 2022-2024 |
| Report Scope & Coverage | Market Size, Segments Analysis, Competitive Landscape, Regional Analysis, DROC & SWOT Analysis, Forecast Outlook |
| Key Segments | • By Product Type(Fixed Buoys and Drifting Buoys) • By Detection Technology(Optical Sensors, Fluorescence Sensors, Infrared Sensors, Radar Sensors and Others) • By Application(Offshore Oil & Gas, Ports & Harbors, Coastal Monitoring, Environmental Protection and Others) • By End-User(Government Agencies, Oil & Gas Companies, Environmental Organizations, Research Institutes and Others) |
| Regional Analysis/Coverage | North America (US, Canada), Europe (Germany, UK, France, Italy, Spain, Russia, Poland, Rest of Europe), Asia Pacific (China, India, Japan, South Korea, Australia, ASEAN Countries, Rest of Asia Pacific), Middle East & Africa (UAE, Saudi Arabia, Qatar, South Africa, Rest of Middle East & Africa), Latin America (Brazil, Argentina, Mexico, Colombia, Rest of Latin America). |
| Company Profiles | The Autonomous Oil Spill Detection Buoy Market Companies are Kongsberg Gruppen ASA, Xylem Inc., Siemens AG, Honeywell International Inc., Fugro N.V., Teledyne Technologies Incorporated, Ocean Scientific International Ltd (OSIL), NexSens Technology, Inc., Aanderaa Data Instruments AS, EKO Instruments Co., Ltd., MetOcean Telematics, AXYS Technologies Inc., Develogic GmbH, Blue Ocean Monitoring, Sutron Corporation, Hydro-Bios Apparatebau GmbH, RBR Ltd., OTT HydroMet, YSI Inc., Valeport Ltd. and Others |
Frequently Asked Questions
Ans: North America dominated the Autonomous Oil Spill Detection Buoy Market in 2025.
Ans: The “Fixed Buoys” segment dominated the Autonomous Oil Spill Detection Buoy Market
Ans: Rising offshore oil activities, strict regulations, frequent spills, advanced sensors, environmental focus, cost savings, and IoT boost market growth.
Ans: The Autonomous Oil Spill Detection Buoy Market was valued at USD 354.26 million in 2025 and is expected to reach USD 940.55 million by 2035.
Ans: The Autonomous Oil Spill Detection Buoy Market is expected to grow at a CAGR of 10.23% during 2026-2035.
Get in Touch
