image

Bioenergy Market Report Scope & Overview:

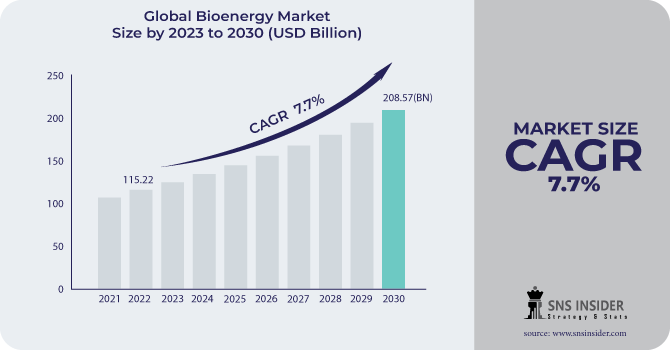
The Bioenergy Market size was valued at USD 115.22 billion in 2022 and is expected to grow to USD 208.57 billion by 2030 and grow at a CAGR of 7.7 % over the forecast period of 2023-2030.

One of the many different resources that can be used to assist consumers meet their energy needs is bioenergy. energy produced with biobased materials Bioenergy is produced from renewable resources like biomass, biofuel, biogas, and other bio-organic waste. This type of renewable energy, commonly referred to as biomass, is produced from recently living organic materials and can be utilized to generate heat, electricity, transportation fuels, and other forms of energy products.

Bioenergy Market Revenue Analysis

Get More Information on Bioenergy Market - Request Sample Report

Biomass Power Generation will help to meeting future energy demands sustainably. It presently provides the majority of renewable energy to the global energy mix, and there is still a ton of space for expansion in the production of fuels for heat, electricity, and transportation. It is possible to considerably improve the use of bioenergy by exploiting the enormous number of unwanted residues and garbage.

Some bioenergy sources, such the black liquor created during the production of paper, are byproducts of industrial operations that would have occurred anyway. In contrast to other energy sources, bioenergy is typically made from specifically cultivated plants or trees, which necessitates a large amount of land. Consequently, it is anticipated that there would be a rise in knowledge of sustainable energy sources to increase the demand for bioenergy during the upcoming years.

Because it may be used in a variety of settings and sectors—from solid bioenergy and biogases used for power and heat in homes and businesses to liquid biofuels used in cars, ships, and airplanes bioenergy is favourable. Additionally, it usually makes use of infrastructure that has already been constructed, for instance, biomethane can utilize end-user technologies and previously-built natural gas pipes.

MARKET DYNAMICS

KEY DRIVERS: 

  • Increasing solid waste demand

  • Significant bioenergy demand

When compared to traditional energy, bioenergy is highly sought after since its resources offer superior biodegradability, a smaller carbon footprint, greater energy dependability, fewer landfills, and improved air quality., it can lessen reliance on fossil fuels and energy costs. These are the main variables that are anticipated to influence the market for bioenergy's growth rate.

RESTRAIN:

  • High Cost

OPPORTUNITY:

  • Numerous Favorable Government Policies

  • Increasingly positive government programs and policies

  •  Increasing investment in the bioenergy sector

Numerous prospects for market growth are also provided by the industry participants' increasing initiatives and investments. For instance, a number of efforts in the bioenergy sector have been initiated by the US Department of Energy and NREL (National Renewable Energy Laboratory). The Department of Energy (DOE) has declared that funding for 33 projects totaling more than USD 97 million will support R&D operations.

CHALLENGES:

  • Mounting Technological Advancements

  • High initial cost of installation

Due to its high initial investment requirements, the bioenergy market's development pace has halted. There are numerous more logistical difficulties related to the bioenergy. The rapid expansion of the electric car industry and the high initial cost of installing a bioenergy plant are limiting the market's growth.

IMPACT ANALYSIS

IMPACT OF ONGOING RECESSION

The effects of the ensuing actions also had an effect on the economy. The globe is currently experiencing the worst recession since the Great Depression, with projections calling for a worldwide economic growth of -4.9% in 2021, down from 2.9%2020. In the USA alone, more than 40 million Americans have applied for jobless benefits due to the global economic slowdown.

The largest source of renewable energy on the planet is bioenergy. More than 2/3 of all energy supply from renewable sources came from biofuels and garbage, which had a proportion of 9.5% of all energy sources globally. Bioenergy is a flexible energy source with many different feedstocks, production methods, and applications. Forestry accounts for more than 85% of the biomass used for energy, providing leftovers from harvesting and processing.

MARKET SEGMENTATION

KEY MARKET SEGMENTS

By product type

  • Solid Biomass

  • Liquid Biofuel

  • Biogas

  • Others

By feedstock

  • Agricultural Waste

  • Wood Waste

  • Solid Waste

  • Others

By application

  • Power Generation

  • Heat Generation

  • Transportation

  • Others

Bioenergy Market Segmentation Analysis

Get Customized Report as per your Business Requirement - Request For Customized Report

REGIONAL ANALYSIS

Due to favourable government laws and rising biofuel consumption in this region, North America currently holds a lion's share of the global market for bioenergy in terms of revenue and market share.

Asia-Pacific is the fastest-growing area and is expected to have profitable growth from 2023 to 2030 as a result of its massive population and increased energy consumption.

Over the past few years, North America has played a vital role in the development of liquid biofuels. In this area, almost 45% of liquid biofuel is produced. The three main producers of bioenergy in North America are the United States, Canada, and Mexico. It generated roughly 60 billion Liters of ethanol, or 16 billion gallons. Also, more than 2000 facilities in the United States create biogas.

The second largest region in the world market is the Middle East and Africa. Around 45% of the world's potential energy from all renewable sources is located in this region. These sources have the capacity to produce more than three times the global demand for electricity has plenty.

REGIONAL COVERAGE:

North America

  • US

  • Canada

  • Mexico

Europe

  • Eastern Europe

    • Poland

    • Romania

    • Hungary

    • Turkey

    • Rest of Eastern Europe

  • Western Europe

    • Germany

    • France

    • UK

    • Italy

    • Spain

    • Netherlands

    • Switzerland

    • Austria

    • Rest of Western Europe

Asia Pacific

  • China

  • India

  • Japan

  • South Korea

  • Vietnam

  • Singapore

  • Australia

  • Rest of Asia Pacific

Middle East & Africa

  • Middle East

    • UAE

    • Egypt

    • Saudi Arabia

    • Qatar

    • Rest of Middle East

  • Africa

    • Nigeria

    • South Africa

    • Rest of Africa

Latin America

  • Brazil

  • Argentina

  • Colombia

  • Rest of Latin America

RECENT DEVELOPMENT

  • In July 2021, EnviTec Biogas AG and Liquind 24/7 GmbH inked a contract for the transportation and distribution of EnviTec Biogas AG's bio-LNG generated at Gustrow to heavy-duty customers at Liquind 24/7 GmbH's truck fueling stations in Germany.

  • After only a 12-month building period, EnviTec Biogas AG began operating its biogas facility in China in 2021. Maize stover silage, turkey litter, and other materials would be used as input for the 1,570 Nm dung from dairy cattle.  

  • EnviTec Biogas AG and Liquind 24/7 GmbH have a contract in place for June 2021. This agreement seeks to supply heavy-duty clients at its truck fuelling stations with bio-LNG generated by EnviTec Biogas AG at Gustrow in Germany.

KEY PLAYERS

ADM (U.S.), POET (U.S.), Ameresco, Inc. (U.S.), Enerkem (Canada), MW Energie AG (Germany), Enviva (U.S.), EnviTec Biogas AG (Germany), Green Plains Inc. (U.S.), Pacific BioEnergy Corp (Canada), Lignetics (U.S.), Drax Group (U.S.), Enexor Energy (U.S.) and other players are listed in a final report.

Enerkem (Canada)-Company Financial Analysis

Company Landscape Analysis

Bioenergy market report scope:
Report Attributes Details
Market Size in 2022  US$ 115.22 Bn
Market Size by 2030  US$ 208.57 Bn
CAGR   CAGR of 7.7 % From 2023 to 2030
Base Year 2022
Forecast Period  2023-2030
Historical Data  2020-2021
Report Scope & Coverage Market Size, Segments Analysis, Competitive  Landscape, Regional Analysis, DROC & SWOT Analysis, Forecast Outlook
Key Segments • By product type (Solid Biomass, Liquid Biofuel, Biogas, Others)
• By feedstock (Agricultural Waste, Wood Waste, Solid Waste, Others)
• By application (Power Generation, Heat Generation, Transportation, Others)
Regional Analysis/Coverage North America (US, Canada, Mexico), Europe (Eastern Europe [Poland, Romania, Hungary, Turkey, Rest of Eastern Europe] Western Europe] Germany, France, UK, Italy, Spain, Netherlands, Switzerland, Austria, Rest of Western Europe]). Asia Pacific (China, India, Japan, South Korea, Vietnam, Singapore, Australia, Rest of Asia Pacific), Middle East & Africa (Middle East [UAE, Egypt, Saudi Arabia, Qatar, Rest of Middle East], Africa [Nigeria, South Africa, Rest of Africa], Latin America (Brazil, Argentina, Colombia Rest of Latin America)
Company Profiles ADM (U.S.), POET (U.S.), Ameresco, Inc. (U.S.), Enerkem (Canada), MW Energie AG (Germany), Enviva (U.S.), EnviTec Biogas AG (Germany), Green Plains Inc. (U.S.), Pacific BioEnergy Corp (Canada), Lignetics (U.S.), Drax Group (U.S.), Enexor Energy (U.S.)
Key Drivers • Increasing solid waste demand
• Significant bioenergy demand
Market Restraints • High Cost


Frequently Asked Questions

Ans: Bioenergy Market is anticipated to expand by 7.7 % from 2023 to 2030.

Ans:   USD 208.57 billion is expected to grow by 2030.

Ans: Bioenergy Market size was valued at USD 115.22 billion in 2022

Ans: Increasing solid waste demand and Significant bioenergy demand

Ans: Numerous Favourable Government Policies, increasingly positive government programs and policies and Increasing investment in the bioenergy sector

Table of Contents

1. Introduction
1.1 Market Definition
1.2 Scope
1.3 Research Assumptions

2. Research Methodology

3. Market Dynamics
3.1 Drivers
3.2 Restraints
3.3 Opportunities
3.4 Challenges

4. Impact Analysis
4.1 Impact of the Ukraine- Russia war
4.2 Impact of ongoing Recession
4.2.1 Introduction
4.2.2 Impact on major economies
4.2.2.1 US
4.2.2.2 Canada
4.2.2.3 Germany
4.2.2.4 France
4.2.2.5 United Kingdom
4.2.2.6 China
4.2.2.7 Japan
4.2.2.8 South Korea
4.2.2.9 Rest of the World

5. Value Chain Analysis

6. Porter’s 5 forces model

7. PEST Analysis

8. Bioenergy Market Segmentation, By Product type
8.1 Solid Biomass
8.2 Liquid Biofuel
8.3 Biogas
8.4 Others

9. Bioenergy Market Segmentation, By Feedstock
9.1 Agricultural Waste
9.2 Wood Waste
9.3 Solid Waste
9.4 Others

10. Bioenergy Market Segmentation, By Application
10.1 Power Generation
10.2 Heat Generation
10.3 Transportation
10.4 Others

11. Regional Analysis
11.1 Introduction
11.2 North America
11.2.1 North America Bioenergy Market by Country
11.2.2 North America Bioenergy Market by Product type
11.2.3 North America Bioenergy Market by Feedstock
11.2.4 North America Bioenergy Market by Application
11.2.5 USA
11.2.5.1 USA Bioenergy Market by Product type
11.2.5.2 USA Bioenergy Market by Feedstock
11.2.5.3 USA Bioenergy Market by Application
11.2.6 Canada
11.2.6.1 Canada Bioenergy Market by Product type
11.2.6.2 Canada Bioenergy Market by Feedstock
11.2.6.3 Canada Bioenergy Market by Application
11.2.7 Mexico
11.2.7.1 Mexico Bioenergy Market by Product type
11.2.7.2 Mexico Bioenergy Market by Feedstock
11.2.7.3 Mexico Bioenergy Market by Application
11.3 Europe
11.3.1 Eastern Europe
11.3.1.1 Eastern Europe Bioenergy Market by Country
11.3.1.2 Eastern Europe Bioenergy Market by Product type
11.3.1.3 Eastern Europe Bioenergy Market by Feedstock
11.3.1.4 Eastern Europe Bioenergy Market by Application
11.3.1.5 Poland
11.3.1.5.1 Poland Bioenergy Market by Product type
11.3.1.5.2 Poland Bioenergy Market by Feedstock
11.3.1.5.3 Poland Bioenergy Market by Application
11.3.1.6 Romania
11.3.1.6.1 Romania Bioenergy Market by Product type
11.3.1.6.2 Romania Bioenergy Market by Feedstock
11.3.1.6.4 Romania Bioenergy Market by Application
11.3.1.7 Turkey
11.3.1.7.1 Turkey Bioenergy Market by Product type
11.3.1.7.2 Turkey Bioenergy Market by Feedstock
11.3.1.7.3 Turkey Bioenergy Market by Application
11.3.1.8 Rest of Eastern Europe
11.3.1.8.1 Rest of Eastern Europe Bioenergy Market by Product type
11.3.1.8.2 Rest of Eastern Europe Bioenergy Market by Feedstock
11.3.1.8.3 Rest of Eastern Europe Bioenergy Market by Application
11.3.2 Western Europe
11.3.2.1 Western Europe Bioenergy Market by Product type
11.3.2.2 Western Europe Bioenergy Market by Feedstock
11.3.2.3 Western Europe Bioenergy Market by Application
11.3.2.4 Germany
11.3.2.4.1 Germany Bioenergy Market by Product type
11.3.2.4.2 Germany Bioenergy Market by Feedstock
11.3.2.4.3 Germany Bioenergy Market by Application
11.3.2.5 France
11.3.2.5.1 France Bioenergy Market by Product type
11.3.2.5.2 France Bioenergy Market by Feedstock
11.3.2.5.3 France Bioenergy Market by Application
11.3.2.6 UK
11.3.2.6.1 UK Bioenergy Market by Product type
11.3.2.6.2 UK Bioenergy Market by Feedstock
11.3.2.6.3 UK Bioenergy Market by Application
11.3.2.7 Italy
11.3.2.7.1 Italy Bioenergy Market by Product type
11.3.2.7.2 Italy Bioenergy Market by Feedstock
11.3.2.7.3 Italy Bioenergy Market by Application
11.3.2.8 Spain
11.3.2.8.1 Spain Bioenergy Market by Product type
11.3.2.8.2 Spain Bioenergy Market by Feedstock
11.3.2.8.3 Spain Bioenergy Market by Application
11.3.2.9 Netherlands
11.3.2.9.1 Netherlands Bioenergy Market by Product type
11.3.2.9.2 Netherlands Bioenergy Market by Feedstock
11.3.2.9.3 Netherlands Bioenergy Market by Application
11.3.2.10 Switzerland
11.3.2.10.1 Switzerland Bioenergy Market by Product type
11.3.2.10.2 Switzerland Bioenergy Market by Feedstock
11.3.2.10.3 Switzerland Bioenergy Market by Application
11.3.2.11.1 Austria
11.3.2.11.2 Austria Bioenergy Market by Product type
11.3.2.11.3 Austria Bioenergy Market by Feedstock
11.3.2.11.4 Austria Bioenergy Market by Application
11.3.2.12 Rest of Western Europe
11.3.2.12.1 Rest of Western Europe Bioenergy Market by Product type
11.3.2.12.2 Rest of Western Europe Bioenergy Market by Feedstock
11.3.2.12.3 Rest of Western Europe Bioenergy Market by Application
11.4 Asia-Pacific
11.4.1 Asia-Pacific Bioenergy Market by Country
11.4.2 Asia-Pacific Bioenergy Market by Product type
11.4.3 Asia-Pacific Bioenergy Market by Feedstock
11.4.4 Asia-Pacific Bioenergy Market by Application
11.4.5 China
11.4.5.1 China Bioenergy Market by Product type
11.4.5.2 China Bioenergy Market by Application
11.4.5.3 China Bioenergy Market by Feedstock
11.4.6 India
11.4.6.1 India Bioenergy Market by Product type
11.4.6.2 India Bioenergy Market by Feedstock
11.4.6.3 India Bioenergy Market by Application
11.4.7 Japan
11.4.7.1 Japan Bioenergy Market by Product type
11.4.7.2 Japan Bioenergy Market by Feedstock
11.4.7.3 Japan Bioenergy Market by Application
11.4.8 South Korea
11.4.8.1 South Korea Bioenergy Market by Product type
11.4.8.2 South Korea Bioenergy Market by Feedstock
11.4.8.3 South Korea Bioenergy Market by Application
11.4.9 Vietnam
11.4.9.1 Vietnam Bioenergy Market by Product type
11.4.9.2 Vietnam Bioenergy Market by Feedstock
11.4.9.3 Vietnam Bioenergy Market by Application
11.4.10 Singapore
11.4.10.1 Singapore Bioenergy Market by Product type
11.4.10.2 Singapore Bioenergy Market by Feedstock
11.4.10.3 Singapore Bioenergy Market by Application
11.4.11 Australia
11.4.11.1 Australia Bioenergy Market by Product type
11.4.11.2 Australia Bioenergy Market by Feedstock
11.4.11.3 Australia Bioenergy Market by Application
11.4.12 Rest of Asia-Pacific
11.4.12.1 Rest of Asia-Pacific Bioenergy Market by Product type
11.4.12.2 Rest of Asia-Pacific Bioenergy Market by Feedstock
11.4.12.3 Rest of Asia-Pacific Bioenergy Market by Application
11.5 Middle East & Africa
11.5.1 Middle East
11.5.1.1 Middle East Bioenergy Market by Country
11.5.1.2 Middle East Bioenergy Market by Product type
11.5.1.3 Middle East Bioenergy Market by Feedstock
11.5.1.4 Middle East Bioenergy Market by Application
11.5.1.5 UAE
11.5.1.5.1 UAE Bioenergy Market by Product type
11.5.1.5.2 UAE Bioenergy Market by Feedstock
11.5.1.5.3 UAE Bioenergy Market by Application
11.5.1.6 Egypt
11.5.1.6.1 Egypt Bioenergy Market by Product type
11.5.1.6.2 Egypt Bioenergy Market by Feedstock
11.5.1.6.3 Egypt Bioenergy Market by Application
11.5.1.7 Saudi Arabia
11.5.1.7.1 Saudi Arabia Bioenergy Market by Product type
11.5.1.7.2 Saudi Arabia Bioenergy Market by Feedstock
11.5.1.7.3 Saudi Arabia Bioenergy Market by Application
11.5.1.8 Qatar
11.5.1.8.1 Qatar Bioenergy Market by Product type
11.5.1.8.2 Qatar Bioenergy Market by Feedstock
11.5.1.8.3 Qatar Bioenergy Market by Application
11.5.1.9 Rest of Middle East
11.5.1.9.1 Rest of Middle East Bioenergy Market by Product type
11.5.1.9.2 Rest of Middle East Bioenergy Market by Feedstock
11.5.1.9.3 Rest of Middle East Bioenergy Market by Application
11.5.2 Africa
11.5.2.1 Africa Transfusion Diagnostics Market by Country
11.5.2.2 Africa Bioenergy Market by Product type
11.5.2.3 Africa Bioenergy Market by Feedstock
11.5.2.4 Africa Bioenergy Market by Application
11.5.2.5 Nigeria
11.5.2.5.1 Nigeria Bioenergy Market by Product type
11.5.2.5.2 Nigeria Bioenergy Market by Feedstock
11.5.2.5.3 Nigeria Bioenergy Market by Application
11.5.2.6 South Africa
11.5.2.6.1 South Africa Bioenergy Market by Product type
11.5.2.6.2 South Africa Bioenergy Market by Feedstock
11.5.2.6.3 South Africa Bioenergy Market by Application
11.5.2.7 Rest of Africa
11.5.2.7.1 Rest of Africa Bioenergy Market by Product type
11.5.2.7.2 Rest of Africa Bioenergy Market by Feedstock
11.5.2.7.3 Rest of Africa Bioenergy Market by Application
11.6 Latin America
11.6.1 Latin America Bioenergy Market by Country
11.6.2 Latin America Bioenergy Market by Product type
11.6.3 Latin America Bioenergy Market by Feedstock
11.6.4 Latin America Bioenergy Market by Application
11.6.5 Brazil
11.6.5.1 Brazil America Bioenergy Market by Product type
11.6.5.2 Brazil America Bioenergy Market by Feedstock
11.6.5.3 Brazil America Bioenergy Market by Application
11.6.6 Argentina
11.6.6.1 Argentina America Bioenergy Market by Product type
11.6.6.2 Argentina America Bioenergy Market by Feedstock
11.6.6.3 Argentina America Bioenergy Market by Application
11.6.7 Colombia
11.6.7.1 Colombia America Bioenergy Market by Product type
11.6.7.2 Colombia America Bioenergy Market by Feedstock
11.6.7.3 Colombia America Bioenergy Market by Application
11.6.8 Rest of Latin America
11.6.8.1 Rest of Latin America Bioenergy Market by Product type
11.6.8.2 Rest of Latin America Bioenergy Market by Feedstock
11.6.8.3 Rest of Latin America Bioenergy Market by Application

12. Company profile
12.1 ADM (U.S.)
12.1.1 Company Overview
12.1.2 Financial
12.1.3 Products/ Services Offered
12.1.4 SWOT Analysis
12.1.5 The SNS View
12.2 POET (U.S.)
12.2.1 Company Overview
12.2.2 Financials
12.2.3 Product/Services Offered
12.2.4 SWOT Analysis
12.2.5 The SNS View
12.3 Ameresco, Inc. (U.S.)
12.3.1 Company Overview
12.3.2 Financials
12.3.3 Product/Services Offered
12.3.4 SWOT Analysis
12.3.5 The SNS View
12.4 Enerkem (Canada)
12.4.1 Company Overview
12.4.2 Financials
12.4.3 Product/Services Offered
12.4.4 SWOT Analysis
12.4.5 The SNS View
12.5 MW Energie AG (Germany)
12.5.1 Company Overview
12.5.2 Financials
12.5.3 Product/Services Offered
12.5.4 SWOT Analysis
12.5.5 The SNS View
12.6 Enviva (U.S.)
12.6.1 Company Overview
12.6.2 Financials
12.6.3 Product/Services Offered
12.6.4 SWOT Analysis
12.6.5 The SNS View
12.7 EnviTec Biogas AG (Germany)
12.7.1 Company Overview
12.7.2 Financials
12.7.3 Product/Services Offered
12.7.4 SWOT Analysis
12.7.5 The SNS View
12.8 Green Plains Inc. (U.S.)
12.8.1 Company Overview
12.8.2 Financials
12.8.3 Product/Services Offered
12.8.4 SWOT Analysis
12.8.5 The SNS View
12.9 Pacific BioEnergy Corp (Canada)
12.9.1 Company Overview
12.9.2 Financials
12.9.3 Product/Services Offered
12.9.4 SWOT Analysis
12.9.5 The SNS View
12.10 Lignetics (U.S.)
12.10.1 Company Overview
12.10.2 Financials
12.10.3 Product/Services Offered
12.10.4 SWOT Analysis
12.10.5 The SNS View
12.11 Drax Group (U.S.)
12.11.1 Company Overview
12.11.2 Financials
12.11.3 Product/Services Offered
12.11.4 SWOT Analysis
12.11.5 The SNS View
12.12 Enexor Energy (U.S.)
12.12.1 Company Overview
12.12.2 Financials
12.12.3 Product/Services Offered
12.12.4 SWOT Analysis
12.12.5 The SNS View

13. Competitive Landscape
13.1 Competitive Bench marking
13.2 Market Share Analysis
13.3 Recent Developments
13.3.1 Industry News
13.3.2 Company News
13.3.3 Mergers & Acquisitions

14. Use Case and Best Practices

15. Conclusion

An accurate research report requires proper strategizing as well as implementation. There are multiple factors involved in the completion of good and accurate research report and selecting the best methodology to compete the research is the toughest part. Since the research reports we provide play a crucial role in any company’s decision-making process, therefore we at SNS Insider always believe that we should choose the best method which gives us results closer to reality. This allows us to reach at a stage wherein we can provide our clients best and accurate investment to output ratio.

Each report that we prepare takes a timeframe of 350-400 business hours for production. Starting from the selection of titles through a couple of in-depth brain storming session to the final QC process before uploading our titles on our website we dedicate around 350 working hours. The titles are selected based on their current market cap and the foreseen CAGR and growth.


The 5 steps process:

Step 1: Secondary Research:

Secondary Research or Desk Research is as the name suggests is a research process wherein, we collect data through the readily available information. In this process we use various paid and unpaid databases which our team has access to and gather data through the same. This includes examining of listed companies’ annual reports, Journals, SEC filling etc. Apart from this our team has access to various associations across the globe across different industries. Lastly, we have exchange relationships with various university as well as individual libraries.

Secondary Research

Step 2: Primary Research

When we talk about primary research, it is a type of study in which the researchers collect relevant data samples directly, rather than relying on previously collected data.  This type of research is focused on gaining content specific facts that can be sued to solve specific problems. Since the collected data is fresh and first hand therefore it makes the study more accurate and genuine.

We at SNS Insider have divided Primary Research into 2 parts.

Part 1 wherein we interview the KOLs of major players as well as the upcoming ones across various geographic regions. This allows us to have their view over the market scenario and acts as an important tool to come closer to the accurate market numbers. As many as 45 paid and unpaid primary interviews are taken from both the demand and supply side of the industry to make sure we land at an accurate judgement and analysis of the market.

This step involves the triangulation of data wherein our team analyses the interview transcripts, online survey responses and observation of on filed participants. The below mentioned chart should give a better understanding of the part 1 of the primary interview.

Primary Research

Part 2: In this part of primary research the data collected via secondary research and the part 1 of the primary research is validated with the interviews from individual consultants and subject matter experts.

Consultants are those set of people who have at least 12 years of experience and expertise within the industry whereas Subject Matter Experts are those with at least 15 years of experience behind their back within the same space. The data with the help of two main processes i.e., FGDs (Focused Group Discussions) and IDs (Individual Discussions). This gives us a 3rd party nonbiased primary view of the market scenario making it a more dependable one while collation of the data pointers.

Step 3: Data Bank Validation

Once all the information is collected via primary and secondary sources, we run that information for data validation. At our intelligence centre our research heads track a lot of information related to the market which includes the quarterly reports, the daily stock prices, and other relevant information. Our data bank server gets updated every fortnight and that is how the information which we collected using our primary and secondary information is revalidated in real time.

Data Bank Validation

Step 4: QA/QC Process

After all the data collection and validation our team does a final level of quality check and quality assurance to get rid of any unwanted or undesired mistakes. This might include but not limited to getting rid of the any typos, duplication of numbers or missing of any important information. The people involved in this process include technical content writers, research heads and graphics people. Once this process is completed the title gets uploader on our platform for our clients to read it.

Step 5: Final QC/QA Process:

This is the last process and comes when the client has ordered the study. In this process a final QA/QC is done before the study is emailed to the client. Since we believe in giving our clients a good experience of our research studies, therefore, to make sure that we do not lack at our end in any way humanly possible we do a final round of quality check and then dispatch the study to the client.

Start a Conversation

Hi! Click one of our member below to chat on Phone