Biosensors Market Report Scope & Overview:
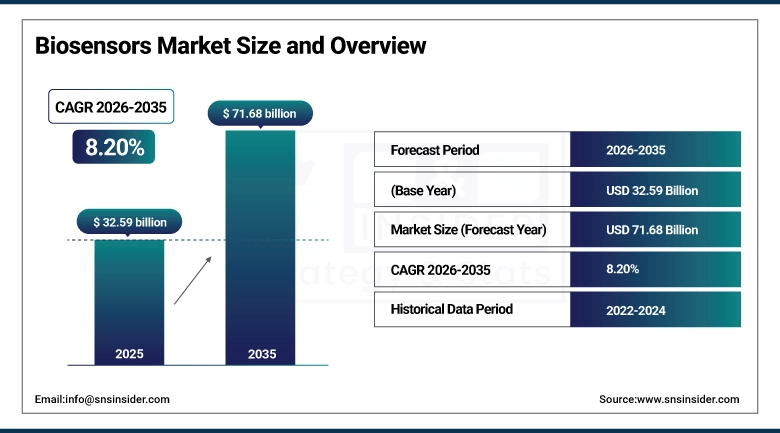
The Biosensors Market size was valued at USD 32.59 Billion in 2025 and is projected to reach USD 71.68 Billion by 2035, growing at a CAGR of 8.20% during 2026–2035.
The growth in the Biosensors Market is driven by an increasing incidence rate of chronic diseases like diabetes and cardiovascular diseases. In addition to this, increasing demand for point-of-care diagnostics and advances in wearable technology are also driving the biosensors market. Furthermore, increasing usage in healthcare, environment monitoring, and food testing, along with an increasing focus on personalized medicine and health monitoring devices, is also driving the market for biosensors.
Biosensors Market Size and Growth Forecast:
-
Market Size in 2025: USD 32.59 Billion
-
Market Size by 2035: USD 71.68 Billion
-
CAGR: 8.20% during 2026–2035
-
Base Year: 2025
-
Forecast Period: 2026–2035
-
Historical Data: 2022–2024
To Get more information on Biosensors Market - Request Free Sample Report
Biosensors Market Key Trends:
-
Rising prevalence of chronic diseases such as diabetes and cardiovascular conditions is driving demand for biosensors.
-
Growing adoption of wearable and implantable biosensor devices for continuous health monitoring is boosting market growth.
-
Increasing demand for point-of-care diagnostics and rapid testing solutions is accelerating market expansion.
-
Advancements in nanotechnology, microelectronics, and sensor miniaturization are shaping innovation trends.
-
Expanding applications in environmental monitoring, food safety, and biotechnology are broadening market scope.
-
Rising focus on personalized medicine and remote patient monitoring is supporting adoption.
-
Collaborations between healthcare providers, research institutions, and technology companies are accelerating product development and commercialization.
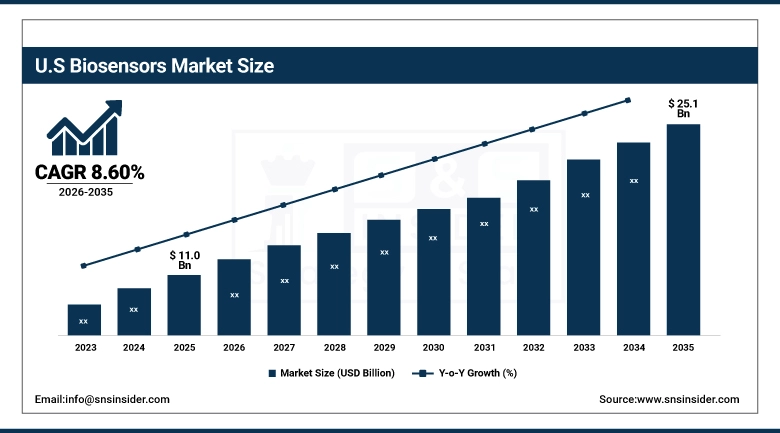
U.S. Biosensors Market Size Outlook:
The U.S. Biosensors Market size was valued at USD 11.0 Billion in 2025 and is projected to reach USD 25.1 Billion by 2035, growing at a CAGR of 8.60% during 2026–2035, The growth of the U.S. biosensors market is driven by the high prevalence of chronic diseases such as diabetes, increasing adoption of wearable health monitoring devices, and strong demand for point-of-care diagnostics.
Biosensors Market Key Drivers:
-
Rising prevalence of chronic diseases and increasing demand for rapid diagnostics are fueling the adoption of biosensors across healthcare applications
The rising prevalence rate of chronic illnesses such as diabetes, cardiovascular diseases, and infectious diseases is also creating a strong demand for biosensors. This is because these devices help in the quick and accurate monitoring of health conditions in real time. This makes them highly essential in the healthcare sector. The rising need to conduct point-of-care testing and to monitor patients at an early stage is also creating a strong market for these devices. The development in wearable devices is also helping in the improvement of patient conditions.
Biosensors Market Key Restraints:
-
High development costs and regulatory complexities limit the widespread adoption of biosensor technologies
The biosensors market is affected due to the high R&D costs associated with developing and launching cutting-edge biosensors technology. The stringent nature of regulatory clearances and quality demands for medical devices also contribute to product launches being delayed. In addition to this, accuracy and calibration issues with biosensors are also affecting the market. Overall, these factors are affecting the growth of the biosensors market.
Biosensors Market Key Opportunities:
-
Growing adoption of wearable devices and personalized healthcare creates opportunities for innovation and market expansion
Rising demand for wearable health monitoring devices and personalized medicine is generating new business opportunities in the biosensors market. The integration of biosensors with smartphones, IoT, and digital health is helping to track real-time data and remotely monitor patients. New opportunities in environmental monitoring, food safety, and biotechnology are being created, which is helping to increase the scope of biosensors. In addition, new innovations in nanotechnology are helping to create new business opportunities in the development of highly efficient and cost-effective biosensors.
Biosensors Market Segments:
-
By Product: In 2025, Wearable Biosensors dominated with 56% share; Non-Wearable Biosensors fastest growing segment during 2026–2035
-
By Type: In 2025, Sensor Patch dominated with 61% share; Embedded Device fastest growing segment during 2026–2035
-
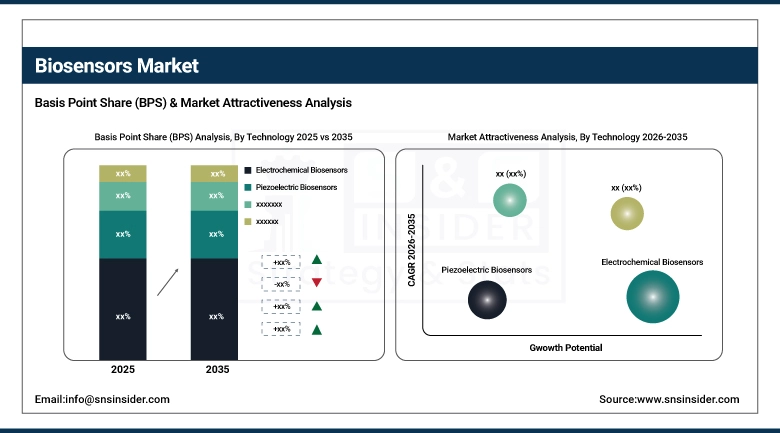
By Technology: In 2025, Electrochemical Biosensors dominated with 48% share; Optical Biosensors fastest growing segment during 2026–2035
-
By Application: In 2025, Medical Testing dominated with 46% share; Home Diagnostics fastest growing segment during 2026–2035
By Technology, Electrochemical Biosensors segment dominates the Market, Optical Biosensors segment expected to grow fastest
Electrochemical Biosensors segment held the largest share in the market in 2025. This is because they are sensitive, accurate, and cost-effective. These biosensors have been used extensively for glucose monitoring and diagnostics, which has led to their preference.
The Optical Biosensors segment is expected to register the highest CAGR in the market from 2026-2035. The increased requirement for quick and label-free detection, coupled with the rising use of optical sensing technology, is expected to boost the market. The increased use of optical biosensors in environmental monitoring and food safety is also expected to propel the market.
By Product, Wearable Biosensors segment dominates the Market, Non-Wearable Biosensors segment expected to grow fastest
Wearable Biosensors segment has been dominating the Biosensors Market in terms of revenue share up to 2025. The wearable biosensors are widely used to monitor health, glucose levels, heart rate, and fitness. The increase in health awareness and the use of smart wearable devices have boosted the wearable biosensors segment.
Non-Wearable Biosensors is expected to grow at the highest CAGR from 2026 to 2035 in the Biosensors Market. Non-wearable biosensors are mainly used in hospitals, labs, and industries. The increase in demand for accurate diagnosis and the advancement in technology have boosted the non-wearable biosensors segment.
By Type, Sensor Patch segment dominates the Market, Embedded Device segment expected to grow fastest
The Sensor Patch segment had the highest share in the Biosensors Market in 2025. These patches are used extensively due to their ease of use and non-invasive nature. They are also able to provide constant monitoring.
The Embedded Device segment is expected to register the highest CAGR growth rate in 2026-2035. These devices are part of complex medical equipment and provide monitoring facilities. The increasing need for smart medical equipment is driving this segment.
By Application, Medical Testing segment dominates the Market, Home Diagnostics segment expected to grow fastest
The Medical Testing segment had the highest market share in the Biosensors Market in 2025 due to the increased need for the diagnosis of diseases, patient monitoring, and testing. The increased usage of biosensors in medical institutions will continue to boost the market for this segment.
The Home Diagnostics segment is expected to witness the highest CAGR from 2026 to 2035. The increased preference for home healthcare services, user-friendly equipment, and awareness of preventive healthcare measures will boost the market for this segment.
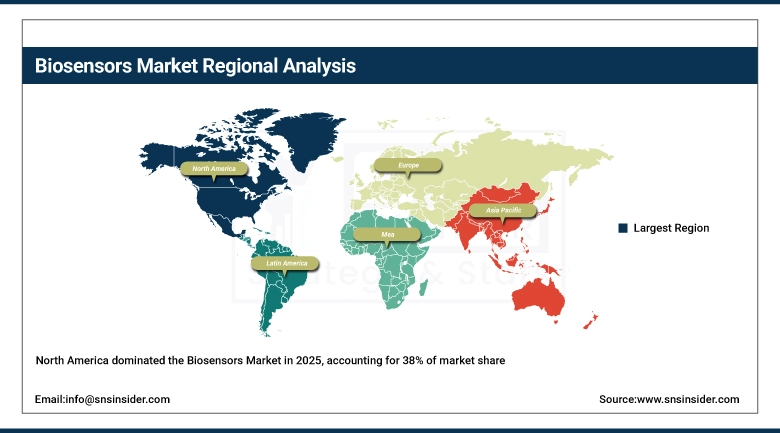
Biosensors Market Regional Analysis:
North America Biosensors Market Insights:
North America held the largest share of the Biosensors Market in 2025, accounting for a share of 38%. This is because of the presence of a strong healthcare infrastructure, a high adoption of wearable technology, and a strong footprint of key players. The region will also see an increase in demand for point-of-care diagnostics as well as health monitoring systems. Nevertheless, the Asia-Pacific region will see the fastest growth rate during the forecast period compared to other regions.
Get Customized Report as per Your Business Requirement - Enquiry Now
Asia-Pacific Biosensors Market Insights:
The region of Asia-Pacific accounted for a significant share of the Biosensors Market in 2025. This region is expected to grow at the fastest CAGR of 9.4% during the period of 2026-2035. Factors such as rapid urbanization, improvement in healthcare infrastructure, and increasing prevalence of chronic diseases are responsible for the growth of biosensors. Increasing healthcare technology investments and awareness of early disease diagnosis are other factors that are responsible for the growth of this market. Countries such as China, India, and Japan are showing strong growth in the adoption of wearable and portable diagnostic devices.
Europe Biosensors Market Insights:
Europe held a market share of about 27% in 2025. This is because the region has well-developed healthcare infrastructures and is increasingly embracing advanced diagnostic technologies. The region is growing steadily owing to factors such as an aging population and rising cases of chronic conditions. Additionally, the government is also supporting the development and adoption of digital health technologies and innovations. This is in addition to the availability of high-quality biosensor devices owing to well-developed research infrastructures.
Latin America Biosensors Market Insights:
Latin America accounted for a market share of 8% in 2025, which is expected to grow at a moderate rate. The market is fueled by the rise in healthcare infrastructure and awareness about the early detection of diseases and preventive healthcare. The increase in investments in medical technology and gradual adoption of biosensor-based diagnostic devices also add value to the market. The economic challenges and lack of advanced healthcare facilities might act as a barrier.
Middle East & Africa (MEA) Biosensors Market Insights:
The market share of the Middle East & Africa region is around 6% of the market in 2025. The market is expected to grow gradually in the coming years. Increasing investments in healthcare services, government efforts to enhance medical infrastructure, and awareness of advanced diagnostic technologies are some of the driving forces for the market. The region is witnessing increased demand for point-of-care testing and portable biosensors, mainly in urban areas. However, healthcare services may be limited in rural areas.
Biosensors Market Competitive Landscape:
Bio-Rad Laboratories Inc. is a global leader in providing products and solutions in the field of life science research and clinical diagnostics. The company operates from Hercules, California, USA. The firm has expertise in providing products and solutions in the field of laboratory research, healthcare diagnostics, and biosensor technology. The products of the company include reagents, instruments, and quality control products, which are used in clinical diagnostics and laboratory research. The company focuses on innovations in molecular diagnostics, life science research, and precision medicine.
-
2025: Bio-Rad expanded its portfolio of diagnostic solutions by introducing advanced quality control products for clinical laboratories, strengthening its position in the global diagnostics market.
Medtronic, based out of Dublin, Ireland, is one of the world’s leading medical technology companies offering a diverse range of healthcare solutions that include biosensors. The company mainly deals with medical technology solutions for cardiovascular, diabetes, neurological, and surgical applications. The company is best known for providing continuous glucose monitoring systems that use biosensors to enable real-time monitoring of patients. The company’s commitment to innovation, digital health, and minimally invasive therapies is helping to take biosensors-based healthcare solutions to the next level.
-
2026: Medtronic announced advancements in its continuous glucose monitoring technology, enhancing accuracy and connectivity for better diabetes management and remote patient care.
Abbott Laboratories is a healthcare company based in Abbott Park, Illinois, in the USA. The company specializes in producing healthcare products such as diagnostics, medical devices, nutrition products, and branded generic pharmaceuticals. Abbott Laboratories is one of the major players in the biosensors market, especially in the production of FreeStyle Libre Systems. The company specializes in creating innovative and easy-to-use biosensor devices to help users monitor their health in real time. The company’s global presence is also a major contributor to the success in creating innovative biosensors.
-
2025: Abbott expanded the availability of its FreeStyle Libre systems across new international markets, increasing accessibility to continuous glucose monitoring solutions worldwide.
Biosensors Market Companies are:
-
Medtronic
-
Abbott Laboratories
-
Biosensors International Group, Ltd.
-
Pinnacle Technologies Inc.
-
DuPont Biosensor Materials
-
Johnson & Johnson
-
Koninklijke Philips N.V.
-
LifeScan, Inc.
-
QTL Biodetection LLC
-
Molecular Devices Corp.
-
Nova Biomedical
-
Molex LLC
-
TDK Corp.
-
Zimmer & Peacock AS
-
Siemens Healthcare
| Report Attributes | Details |
|---|---|
| Market Size in 2025 | USD 32.59 Billion |
| Market Size by 2035 | USD 71.68 Billion |
| CAGR | CAGR of 8.20% From 2026 to 2035 |
| Base Year | 2025 |
| Forecast Period | 2026-2035 |
| Historical Data | 2022-2024 |
| Report Scope & Coverage | Market Size, Segments Analysis, Competitive Landscape, Regional Analysis, DROC & SWOT Analysis, Forecast Outlook |
| Key Segments | • By Product (Wearable Biosensors, Non-Wearable Biosensors) • By Type (Sensor Patch, Embedded Device) • By Technology (Piezoelectric Biosensors, Thermal Biosensors, Electrochemical Biosensors ) • By Application (Medical Testing, Industrial Process, Agricultural Testing) |
| Regional Analysis/Coverage | North America (US, Canada), Europe (Germany, UK, France, Italy, Spain, Russia, Poland, Rest of Europe), Asia Pacific (China, India, Japan, South Korea, Australia, ASEAN Countries, Rest of Asia Pacific), Middle East & Africa (UAE, Saudi Arabia, Qatar, South Africa, Rest of Middle East & Africa), Latin America (Brazil, Argentina, Mexico, Colombia, Rest of Latin America). |
| Company Profiles | Bio-Rad Laboratories Inc., Medtronic, Abbott Laboratories, Biosensors International Group, Ltd., Pinnacle Technologies Inc., Ercon, Inc., DuPont Biosensor Materials, Johnson & Johnson, Koninklijke Philips N.V., LifeScan, Inc., QTL Biodetection LLC, Molecular Devices Corp., Nova Biomedical, Molex LLC, TDK Corp., Zimmer & Peacock AS, Siemens Healthcare. |
Frequently Asked Questions
Ans: The Biosensors Market is expected to grow at a CAGR of 8.20% during 2026–2035.
Ans: The market was valued at USD 32.59 Billion in 2025 and is projected to reach USD 71.68 Billion by 2035.
Ans: Rising prevalence of chronic diseases, growing demand for point-of-care diagnostics, and increasing adoption of wearable and advanced biosensor technologies.
Ans: Electrochemical biosensors dominated the market during the projected period.
Ans: North America dominated the Biosensors Market in 2025.
Get in Touch
