High Power Transformers Market Size & Overview:
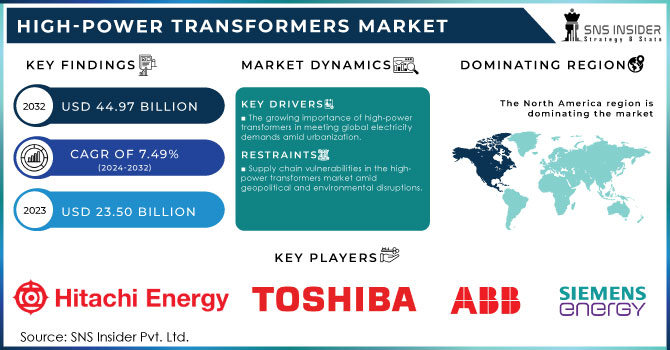
The High Power Transformers Market was valued at USD 23.50 Billion in 2023 and is expected to reach USD 44.97 Billion by 2032, growing at a CAGR of 7.49% over the forecast period 2024-2032. There is a substantial increase in the high-power transformers market due to the growing need for electrical energy in different sectors. As urbanization speeds up and industries grow, the demand for dependable and effective power supply systems has become crucial, driving the growth of the high-power transformers market. High-power transformers play a crucial role in electrical grids by transferring electricity from generation sources to end users and regulating voltage levels to reduce energy wastage. This is especially crucial in big applications like power plants, renewable energy systems, and industrial facilities. The increased popularity of wind and solar energy has also heightened the need for high-power transformers. by 2023, there has been a notable increase in the use of renewable energy sources in the United States, fueled by policy initiatives, technological progress, and growing public concern about climate change.
Get more information on High Power Transformers Market - Request Sample Report
As stated by the U.S. Energy Information Administration (EIA), around 22% of the U.S. total energy consumption comes from renewable sources, with wind and solar energy being the main contributors. Solar energy generation exceeded 140 gigawatts in 2023, marking a 23% surge from the prior year, with wind energy accounting for almost 10% of overall electricity production. Additionally, there is an anticipation for the ongoing increase in the implementation of renewable energy technologies, as the Biden administration aims to achieve 100% clean electricity by 2035. These setups need special transformers that can handle varying power inputs and ensure smooth integration into current grids.
Furthermore, improvements in transformer technology are boosting their effectiveness and lessening their environmental footprint. The sector is more and more embracing digital monitoring systems and smart transformers to enable real-time data analysis and predictive maintenance. In 2023, more than 70% of U.S. utilities are actively placing investments into digital monitoring systems to enhance grid performance and reliability. Moreover, the U.S. Department of Energy stated that incorporating advanced grid technologies, such as smart transformers, could result in a decrease of up to 25% in energy losses, highlighting the economic advantages of these systems. Due to growing regulatory support and advancements in technology, adoption rates are projected to speed up, leading to a significant change in the energy industry. These advancements not only enhance dependability but also allow operators to enhance their energy usage, thereby aiding in achieving sustainability objectives.
High Power Transformers Market Dynamics
Drivers
-
The growing importance of high-power transformers in meeting global electricity demands amid urbanization.
The advent of urbanization and industrialization coupled with a significant rise in the use of electric vehicles all over the world has been behind the exponentially growing need for electricity, which is a crucial resource for progression. In this sense, high-power transformers have been at the center of the transmission and distribution of electricity across different regions. The use of high-power transformers in grid management and ensuring grid safety and stability is increasingly becoming indispensable depending on the substantial increase in the populations of countries and their economic growth and development. Besides, rechargers used to charge personal electric vehicles are connected to transformers, hence feeding the ever-growing electricity demand. Governments in different countries have been significantly investing in their power grids to keep up with the high electricity demand. In developing countries, for instance, governments are now implementing projects that seek to electrify off-grid communities and rural households on a large scale. These projects require the use of transformers to step down voltage. Additionally, the integration of renewable energy sources such as wind and solar photovoltaic energies requires the use of high-power transformers. In conclusion, the fact that high-power transformers ensure the smooth transmission of electricity over long distances minimizes energy loss and ensures that electricity is received where intended and at the right time is a ready market for the transformers, bearing in mind that more and more countries are embracing the use of electricity.
-
The rising demand for high-power transformers is driven by the expansion of renewable energy sources.
The high-power transformers market is experiencing a significant influence on the global tendency of renewable energy sources. As the majority of countries seek to achieve climate goals and decrease their carbon footprint, investments in various renewable projects, such as wind farms or solar panels, are rising annually. In this regard, high-power transformers are in high demand, as they allow for an increase in the voltage coming from the renewable source to transmit it effectively through the grid. For example, in the case of offshore wind farms, high-power transformers process the energy collected by wind turbines at a low voltage and prepare it for sending across the ocean via high voltage. Therefore, the dominance of renewables not only increases the demand for high-power transformers but also stimulates manufacturers to create shipment transformers specific to green energy criteria. It can be concluded that renewable sources expand due to both social and economic reasons. The former is associated with the reduction of the carbon footprint and global warming effects on Earth. The latter is connected with the fact that such an expansion boosts the high-power transformers market.
Restraints
-
Supply chain vulnerabilities in the high-power transformers market amid geopolitical and environmental disruptions.
Supply chain deals of the high-power transformers market are very vulnerable to a variety of supply chain disruptions stimulated by geopolitical instability, devastating natural happenings, and worldwide pandemics. Therefore, there can be some issues regarding the delay related to the on-time supplies of transformers which may push deadlines for various projects. As studies show, projects of such type involve the whole assembly of various raw materials, components, and available modern technologies as it involves not just the electrical part but also the construction and processing part. If any of the supply chain links faces interruption, such as closing localities and suppliers of certain products, it may cause substantial delays in the overall completion as well as driving increases in various costs thereby imposing risks regarding engagement in such market by a variety of utilities and companies. Additionally, such perturbations create uncertainties for the providers of utilities as they cannot guarantee precise up-take of their products and installations thereof directly into the scheduled units.
High Power Transformers Market Segmentation
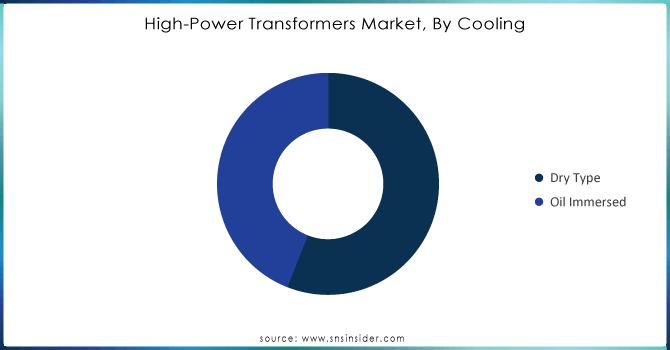
by Cooling
Dry type segment led the market with a 56% market share in 2023 because of their improved safety features and environmental advantages. In contrast to oil-filled transformers, dry type transformers employ air for cooling, decreasing the likelihood of fire incidents. They are perfect for use indoors, particularly in city settings with strict space and safety requirements. General Electric and Schneider Electric use dry type transformers in different contexts, such as renewable energy plants and commercial structures, to maintain reliability and safety in power distribution.
The oil immersed segment has the second-largest revenue share and is going to be the fastest-growing during 2024-2032. Their increased cooling effectiveness enables them to handle larger power loads, making them appropriate for extensive industrial uses and utility networks. The oil in these transformers functions as both a coolant and an insulator, enabling the creation of compact designs. Siemens and ABB are at the forefront of using oil immersed transformers in substations and large industrial plants to guarantee effective and dependable power transmission.
Need any customization research on High Power Transformers Market - Enquiry Now
by Voltage
The Large Power Transformers (LPT >60 MVA) segment, encompassing transformers with a capacity exceeding 60 MVA, held the major share of 59% in 2023, primarily due to the expansion of large-scale industrial operations, renewable energy projects, and extensive grid infrastructure development. LPTs play a vital role in high-voltage transmission and distribution systems by efficiently handling heavy electricity demands and improving grid resilience. This section plays a vital role in important industries like oil and gas, mining, and heavy manufacturing, where a dependable power source is essential. Big companies such as General Electric and ABB have launched modern LPT models with intelligent monitoring and maintenance features that enhance operational efficiency and lifespan.
The Small Power Transformers (SPT ≤ 60 MVA) segment is to experience the fastest CAGR during 2024-2032. The growth of this sector is mainly fueled by the rising need for power in homes, businesses, and small industries. SPTs are commonly utilized in urban power distribution networks, and substations, as well as in renewable energy systems like solar and wind farms. Schneider Electric and Siemens have created SPT solutions that provide better performance and reliability for smaller-scale uses, all while meeting strict environmental regulations.
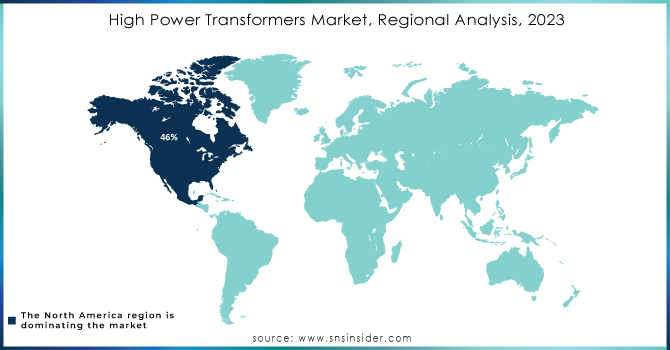
High Power Transformers Market Regional Analysis
North America dominated the market in 2023 with a 46% market share, mainly because of its significant investment in infrastructure and energy generation. The market is being additionally stimulated by the region's emphasis on modernizing outdated electrical infrastructure in order to accommodate increasing energy demands. Large corporations such as General Electric, Siemens, and ABB are well-established in North America, providing innovative high-power transformers for a range of uses, such as incorporating renewable energy and implementing smart grid solutions.
Europe is accounted to become the fastest-growing region in the market with 8.02% CAGR during the forecast period 2024-2032, due to the rising need for renewable energy and the necessity to upgrade electrical infrastructure. The European Union's dedication to sustainability and lowering greenhouse gas emissions has resulted in significant funding for renewable energy sources, requiring the utilization of high-capacity transformers for effective energy distribution. Schneider Electric and Siemens are actively participating in this market by creating new transformer technologies for the integration of wind and solar energy.
Key Players
The major key players in the High-Power Transformers Market are:
-
Hitachi Energy Ltd (Transformers for Offshore Wind, HVDC Transformers)
-
Siemens Energy AG (SITRANS FUS080 Flow Meter, Step-up Transformers)
-
Toshiba Energy Systems & Solutions Corporation (Power Transformers, Distribution Transformers)
-
CG Power and Industrial Solutions Limited (Power Transformers, Distribution Transformers)
-
General Electric Company (High-Voltage Transformers, Substation Transformers)
-
ABB Ltd. (Power Transformers, Traction Transformers)
-
Alstom (High-Voltage Transformers, Power and Distribution Transformers)
-
Crompton Greaves Limited (Power Transformers, Oil-Immersed Transformers)
-
Siemens AG (Traction Transformers, Power Distribution Transformers)
-
Eaton (Medium Voltage Transformers, Oil-Immersed Transformers)
-
Schneider Electric (Medium Voltage Transformer, Dry Type Transformers)
-
Hyosung Power & Industrial Systems (Large Power Transformers, Dry-Type Transformers)
-
Performance Group (High-Power Distribution Transformers, Substation Transformers)
-
Mitsubishi Electric Corporation (Power Transformers, Auto Transformers)
-
Prysmian Group (Power and Distribution Transformers, Special Transformers)
-
Rittal GmbH & Co. KG (Transformer Enclosures, Power Distribution Systems)
-
National Grid plc (Power Transformers, High-Voltage Direct Current (HVDC) Transformers)
-
WEG S.A. (Power Transformers, Distribution Transformers)
-
SGB-SMIT Group (Oil-Immersed Transformers, Dry-Type Transformers)
-
TBEA Co., Ltd. (Power Transformers, Shunt Reactors)
Recent Development
-
January 2024: Schneider Electric introduced a digital transformer at the IoT technology exhibition. The new digital transformer is intended to be used to optimize energy distribution and improve the reliability of the electric grid. It allows monitoring and managing the performance of the equipment.
-
February 2024: Siemens Energy announced its intention to invest 150 million dollars in the expansion of its transformer-producing facility in Charlotte, NC. The current shortage of power transformers in the U.S. prevents the country from developing and implementing new strategies for electric grid deployment. Production is scheduled to start in 2026.
-
April 2024: Hitachi Energy presented its intention to invest over 1.5 billion dollars in the renovation and development of global production facilities of transformers. One of the most recent plans includes a 180 million dollar investment in Vaasa, Finland, and the development of a new transformer manufacturing facility. It is to be used in support of new clean technology and renewables development.
-
September 2023: electrical equipment manufacturer GE Vernova launched a new production line. The line is to produce highly efficient transformers for renewable sources of energy. Their main benefit is a 50% reduction in losses which looks up to 99%. In addition, according to the developers of the new product, it helps to reduce carbon emissions.
-
November 2023: ABB introduced a new production facility for the creation of 2 MVA transformers. Their distinguishing features are the liquid cooling system and the monitoring system. The first pronged of new transformers will be used to facilitate the connection of renewable sources of electricity to the grid.
| Report Attributes | Details |
|---|---|
| Market Size in 2023 | USD 23.50 Billion |
| Market Size by 2032 | USD 44.97 Billion |
| CAGR | CAGR of 7.49% From 2024 to 2032 |
| Base Year | 2023 |
| Forecast Period | 2024-2032 |
| Historical Data | 2020-2022 |
| Report Scope & Coverage | Market Size, Segments Analysis, Competitive Landscape, Regional Analysis, DROC & SWOT Analysis, Forecast Outlook |
| Key Segments | • By Cooling (Dry Type, Oil Immersed) • By Voltage (SPT (≤ 60 MVA), LPT (> 60 MVA)) • By Application (Commercial, Industrial, Utility) |
| Regional Analysis/Coverage | North America (US, Canada, Mexico), Europe (Eastern Europe [Poland, Romania, Hungary, Turkey, Rest of Eastern Europe] Western Europe] Germany, France, UK, Italy, Spain, Netherlands, Switzerland, Austria, Rest of Western Europe]), Asia Pacific (China, India, Japan, South Korea, Vietnam, Singapore, Australia, Rest of Asia Pacific), Middle East & Africa (Middle East [UAE, Egypt, Saudi Arabia, Qatar, Rest of Middle East], Africa [Nigeria, South Africa, Rest of Africa], Latin America (Brazil, Argentina, Colombia, Rest of Latin America) |
| Company Profiles | Hitachi Energy Ltd, Siemens Energy AG, Toshiba Energy Systems & Solutions Corporation, CG Power and Industrial Solutions Limited, General Electric Company, ABB Ltd., Alstom, Crompton Greaves Limited, Siemens AG, Eaton, Schneider Electric, Hyosung Power & Industrial Systems, Performance Group, Mitsubishi Electric Corporation, Prysmian Group, Rittal GmbH & Co. KG, National Grid plc, WEG S.A., SGB-SMIT Group, TBEA Co., Ltd. |
| Key Drivers | • The growing importance of high-power transformers in meeting global electricity demands amid urbanization. • The rising demand for high-power transformers is driven by the expansion of renewable energy sources. |
| Restraints | • Supply chain vulnerabilities in the high-power transformers market amid geopolitical and environmental disruptions. |
Frequently Asked Questions
Ans: North America dominated the High-Power Transformers Market in 2023.
Ans: The Dry Type segment dominated the High-Power Transformers Market.
Ans: The growing importance of high power transformers in meeting global electricity demands amid urbanization is a major factor in its growth.
Ans: The High Power Transformers Market was USD 23.50 billion in 2023 and is expected to Reach USD 44.97 Billion by 2032.
Ans: The High Power Transformers Market is expected to grow at a CAGR of 7.49% during 2024-2032.
Get in Touch
