Get more information on Digital Farming Market - Request Sample Report
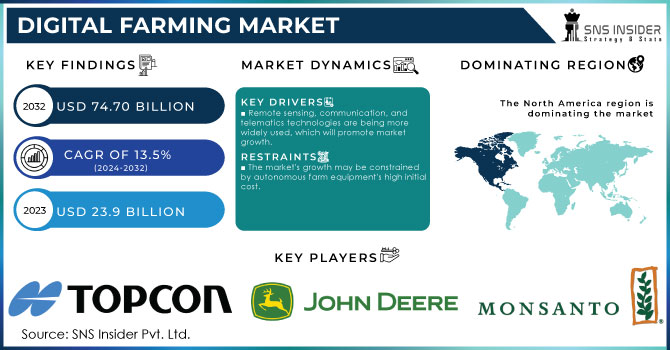
The Digital Farming Market size was valued at USD 23.9 Billion in 2023 and is expected to grow to USD 74.70 Billion by 2032 and grow at a CAGR of 13.5% over the forecast period of 2024-2032.
The digital farming market has been growing significantly due to the government introducing several measures to increase agricultural productivity through technology. In 2023, the adoption of digital technologies for farming was noted globally as governments prioritized food security, optimization of resources, and sustainability of the environment. For example, the U.S. Department of Agriculture revealed that 25% of U.S. farms were using precision agriculture by the end of 2023. In Europe, the European Commission stated that there was a growth of 30 % in the implementation of digital farming under the Common Agricultural Policy (CAP). Governments are facing challenges such as water shortage, changes in climate, and an increased demand for food and are thus driving the uptake of technology in farming, such as sensors, IoT, data analytics. The government’s push in the digital transformation of farming is likely to continue in many countries, which will influence the efficiency of operations and sustainability. For the maximization of farmers’ yield, digital farming uses advanced technologies like artificial intelligence (AI), big data analytics, and the Internet of Things (IoT), as well as gadgets like drones, smart crop sensors, and automatic systems
The Government of India has made several efforts to implement digital agriculture. Important digital agriculture initiative includes the development of a Digital Agriculture Mission worth Rs 2,817 crores. The mission’s aim is to enable farmers through the creation of a Digital Public Infrastructure that offers services such as soil health profiling, digital crop estimation, digital yield modeling, and credit access. The National e-Governance Plan in Agriculture was also another scheme that was revised to include the use of new and emerging technologies in digital agriculture. Also, the government has been offering funding to various agri-tech companies and enabling the use of artificial intelligence in agriculture.
Drivers
Remote sensing, communication, and telematics technologies are being more widely used, which will promote market growth.
Increasing the use of automation in poultry and livestock farming.
Farmers can map soil qualities, classify crop species, detect crop conditions, monitor weeds and agricultural diseases, and track yield using remote sensing technologies. The market is anticipated to expand as a result of the quick advancements in sensing technologies including GIS, GPS, sensors, and cameras. Farmers can obtain useful information about the weather, crop health, and production thanks to sensing devices. Similar to this, producers can now access information about their farms from a distance and help optimize the production process at every stage thanks to the development of cloud computing and data analytics. To manage farm data, market participants are investing in cloud infrastructure construction.
Restrains
The market's growth may be constrained by autonomous farm equipment's high initial cost.
Automated agricultural equipment is substantially more expensive than conventional farming equipment. Examples include automated harvesters, weeding robots, tillers, and irrigation systems supported by robots. Similar to how high maintenance costs for modern cars limit the use of smart digital agricultural techniques by small farms. The cost of maintaining these vehicles' cameras, sensors, software, and hardware restrains market expansion. It is important for farmers to invest in automated and technologically advanced vehicles in order to boost agricultural output and profitability, but it is challenging for them to make a larger initial investment. Farmers in nations like India, Brazil, and China have challenges due to the high initial cost of smart farming technologies.
Because of the complexity of the technology employed in smart agriculture solutions, operational costs rise. With changing weather patterns and crop varieties, grid management, software, and remote sensing must be updated on a regular basis. The high cost of drones equipped with tools, image sensors, high-resolution cameras, and software is expected to limit industry expansion.
Opportunities
IoT and AI technology adoption is increasing, which will lead to several opportunities for market expansion.
Less availability of labor the farmers are shifting towards digital farming.
Artificial intelligence and machine learning are being quickly incorporated into farming equipment and field practices. With its ability to improve productivity and aid in learning, understanding, and responding to various situations, cognitive computing is gaining popularity across the industry. The solutions as a service allow the farmers to keep up with cutting-edge technology, including chatbots and other conversational platforms.
By Product
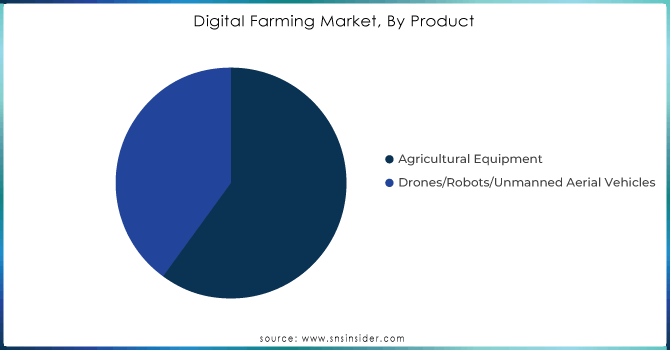
In 2023, Agricultural Equipment was the dominant segment in the digital farming market and held about 55% of the digital farming market share. This was mainly because with current farming practices that require new technology, both traditional and smart agriculture machinery are playing increasingly growing vital role. For instance, tractors, harvesters and planting equipment are integrated with global positioning systems, sensors and automation technologies are indispensable for large-scale and precision farming. The United States Department of Agriculture reported that the share of large farms using digital-enabled agricultural equipment was about 70% at the end of 2023. In different countries such as the European Union and India also, governments supported plans that supplied and invested in smart farming machinery greatly, strengthening the demand of agricultural equipment integrated with digital technologies.
The Drones/Robots/Unmanned Aerial Vehicles segment is also expected to register the highest growth at more than 15% between 2024 and 2032. Drones are used mainly in precision farming to monitor crops and spray pesticides and also map fields. The dominance of UAVs in precision farming and also because UAVs can collect data using aerial monitoring and surveillance in real time. For example, subsidies in China powered the adoption of UAVs; the Chinese Ministry of Agriculture reported that between 15 and 20 million UAVs were being sold annually in the country in 2023. The Federal Aviation Administration also reported that there were more than 35,000 drones that were registered for agricultural use in the United States in 2023.
Need any customization research/data on Digital Farming Market - Enquiry Now
By Technology
The on the basis of technology, digital farming market is dominated by Artificial Intelligence (AI), Machine Learning (ML), and Natural Language Processing (NLP). The rising need for automated and advanced equipment to improve farming efficiency is fueling the adoption of AI/ML technologies in agricultural machinery. These technologies allow for real-time data analysis to optimize farming activities, such as weather forecasting, soil health analysis, crop health monitoring, and pests and weed detection. AI solutions are being increasingly incorporated into smart farming systems to enhance precision and reduce input costs. Moreover, various government initiatives are aiding this adoption. For example, to support the implementation of AI in farming, India’s Digital Agriculture Mission offers grants for agri-tech startups to develop AI-supported tools. With such developments, AI/ML/NLP technologies are expected to define the digital farming market during the forecast period.
The Internet of Things segment is growing with significant growth rate, the demand for IoT technology is becoming prevalent as an increasing number of farms install sensors, drones, robots, and computer imaging systems fitted with analytics capabilities. These devices also continue to support IoT solutions by providing farmers with actionable insights to manage their resources better in real time. In particular, IoT solutions for precision irrigation, smart crop monitoring, and livestock management continue to be deployed in the market. IoT has significant support from the USDA, which funds these technologies’ development for resource management and monitoring. Such developments and increasing needs for data-driven farming are expected to cause IoT technology to record significant growth during the forecast period.
By Application
Among the several application segments, yield monitoring and mapping held the largest share in 2023, accounting for around 30% of the overall digital farming market. This segment’s growth is primarily driven by the need for data-driven decisions that increase crop performance and optimize input effectiveness. In addition, enhanced utilization of yield monitoring strategies is significantly stimulated by government measures to encourage precision farming. For example, according to the U.S. Department of Agriculture, many farmers inn U.S. actively using of precision farming practices were using yield monitoring technologies by 2023. These data collection and analysis systems allow farmers to monitor crop development and asses where more or fewer resources should be provided. Consequently, this increases the input yield relation and makes production more efficient.
The smart crop monitoring segment growing with significant CAGR. Its progress is mostly growing with increasing crop performance and health through continuous data collection. Additionally, Government initiatives promoting precision agriculture have significantly contributed to this trend. For instance, in the EU countries, wise crop monitoring is stimulated through various projects that have received funding under the European Commission’s Horizon Europe program. In the U.S., the USDA's National Institute of Food and Agriculture (NIFA) reported a 20% increase in funding for research on smart crop monitoring systems, emphasizing the importance of early detection of crop stress and disease. By utilizing remote sensing and machine learning algorithms, farmers can optimize resource usage, leading to reduced input costs and improved yields.
Regional Analysis
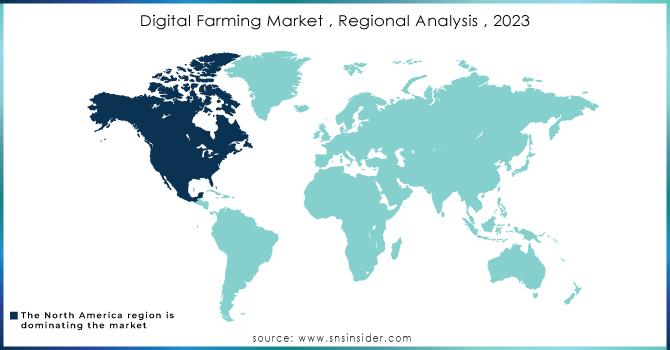
North America was the leading region in the digital farming market in 2023, accounting for approximately 34% of the total market share. This can be attributed to a high adoption level of the digital farming technology in addition to the strong government support for technological advancements in the agricultural. The USDA reported that at least one digital technology in farming was used in nearly 75% of large-scale farms in the U.S. through the appeals put in place as of the end of 2023, because of the program such as the Precision Agriculture Loan Program. The Canadian government budget for 2023 implied more than $1 billion on smart farming as a pilot project with the aim of enhancing yields and sustainability. The digital infrastructure in the region is urged on by the government policies that are encouraging for the technology, which includes the adoption of the Internet of Things technology, Artificial Intelligence, and drones. Perhaps the technology use was highly accepted in the region due to an effort to address specific challenges to farming in the region, for example, water management, and complications with the labour force.
Asia Pacific region is growing with the significant growth rate, with the significantly growing implementation of digital farming technologies in APAC region. A growing support from the government of various countries, want to increase farm productivity, especially in Japan and India. As a part of the digital goal, the Indian government has initiated multiple projects that leverage next-generation technologies like blockchains, cloud, drones, remote sensing, GIS, and robots.
Bayer AG (FieldView, Xarvio Digital Farming Solutions)
Syngenta Group (Cropwise, AgriEdge)
Deere & Company (John Deere) (John Deere Operations Center, JDLink)
CNH Industrial (Case IH & New Holland) (AFS Connect (Case IH), PLM Intelligence (New Holland))
AGCO Corporation (Fuse Connected Services, Precision Planting)
Trimble Inc. (Trimble Ag Software, GFX-750 Display System)
Kubota Corporation (Kubota Farm Solutions, K-Monitor)
Raven Industries (Slingshot, VSN Visual Guidance)
Taranis (Taranis Precision Scouting, Taranis SmartScout)
Tavant Technologies (AI-powered Agritech Solutions, IoT-based Farm Management Tools)
Hexagon Agriculture (HxGN AgrOn, AgrOn Machine Control)
Corteva Agriscience (Granular Farm Management, Encirca)
Topcon Agriculture (Topcon X35 Console, Horizon Software)
Climate Corporation (Subsidiary of Bayer) (Climate FieldView, Climate Insights)
Farmers Edge (FarmCommand, Smart VR)
Yara International (Atfarm, N-Sensor)
Prospera Technologies (Crop Monitoring Platform, Agronomy Analytics)
CropX (CropX Farm Management System, Soil Sensor Technology)
Sentera (FieldAgent Platform, NDVI Sensors)
Valmont Industries (Valley Irrigation, BaseStation Controller)
and others in final Report.
Latest News and Developments
In December 2023, Sonata Software announced the formation of a partnership with Bayer, one of the world’s leading corporations in consumer health, pharmaceuticals, agrochemicals, seeds and biotechnology. These corporations, supported by the Microsoft Azure Data Manager for Agriculture, will seek to facilitate a frictionless field activity data acquisition and integration, associated with a range of agricultural equipment manufacturers, when developing the new AgPowered services.
In November 2023, the Syngenta Group integrated its Cropwise digital platform with the agricultural brands of CNH Industrial. Moore claims that this step connects diverse precision farming systems, offering a reliable and following data source, used to make decisions by farmers and advisors, which, in turn, increase business insights. According to Surne, seven different brands, including the Cropwise platform, are linked to the strategic data in agriculture.
John Deere, one of the leading players in the market for agricultural equipment, initiated the launching of the first fully autonomous tractor in the U.S., aimed to change farming operations. The USDA suggests that this innovation will advance labor efficiency at large-scale farms by up to 30%. The tractor uses AI-driving software in soil analysis, real-time crop monitoring and resource management.
In May 2022, the Kubota Corporation partnered with a start-up Parcel THRIVE, Inc. to develop a platform to foster and speed up the production value chain optimization, increasing production for the crops, such as vegetables, fruits, nuts, and other. R-CISC reports that the solution allowed to improve face-herding cattle.
Report Attributes | Details |
Market Size in 2023 | USD 23.9 Bn |
Market Size by 2032 | USD 74.70 Bn |
CAGR | CAGR of 13.5% From 2024 to 2032 |
Base Year | 2023 |
Forecast Period | 2024-2032 |
Historical Data | 2020-2022 |
Report Scope & Coverage | Market Size, Segments Analysis, Competitive Landscape, Regional Analysis, DROC & SWOT Analysis, Forecast Outlook |
Key Segments | • By Infrastructure (Sensing & Monitoring, Communication Technology, Cloud & Data Processing, Telematics/Positioning, End-Use Components) • By Technology (AI/ML/NLP, IoT, Blockchain, Big Data & Analytics) • By Product (Agricultural Equipment, Drones/Robots/Unmanned Aerial Vehicles) • By Application (Yield Monitoring and Mapping, Smart Crop Monitoring, Soil & Fertilizer Management, Smart Irrigation Monitoring System, Weather Forecasting, Others) |
Regional Analysis/Coverage | North America (US, Canada, Mexico), Europe (Eastern Europe [Poland, Romania, Hungary, Turkey, Rest of Eastern Europe] Western Europe] Germany, France, UK, Italy, Spain, Netherlands, Switzerland, Austria, Rest of Western Europe]), Asia Pacific (China, India, Japan, South Korea, Vietnam, Singapore, Australia, Rest of Asia Pacific), Middle East & Africa (Middle East [UAE, Egypt, Saudi Arabia, Qatar, Rest of Middle East], Africa [Nigeria, South Africa, Rest of Africa], Latin America (Brazil, Argentina, Colombia, Rest of Latin America) |
Company Profiles | Monsanto Company, Topcon Corporation, Deere & Company, AGCO Corporation, Kubota Corporation, Hexagon AB, CNH Industrial N.V., Bayer Crop Science Limited, Agreena, CLAAS KGaA mbH, Trimble, Agleader, IBM Corporation, AgEagle Aerial Systems |
Key Drivers | • Remote sensing, communication, and telematics technologies are being more widely used, which will promote market growth. • Increasing the use of automation in poultry and livestock farming. |
Market Opportunities | • IoT and AI technology adoption is increasing, which will lead to several opportunities for market expansion. • Less availability of labor the farmers are shifting towards digital farming. |
The CAGR of the Digital Farming Market for the forecast period 2024-2032 is 13.5%.
USD 23.9 billion in 2023 is the market share of the Digital Farming Market.
The major worldwide key players in the Digital Farming Market are Monsanto Company, Topcon Corporation, Deere & Company, AGCO Corporation, Kubota Corporation, Hexagon AB, CNH Industrial N.V., Bayer Crop Science Limited, Agreena, CLAAS KGaA mbH, Trimble, Agleader, IBM Corporation, AgEagle Aerial Systems and others in the final report.
• Remote sensing, communication, and telematics technologies are being more widely used, which will promote market growth.
• Increasing the use of automation in poultry and livestock farming.
The forecast period for the Digital Farming Market is 2024-2032.
1. Introduction
1.1 Market Definition
1.2 Scope (Inclusion and Exclusions)
1.3 Research Assumptions
2. Executive Summary
2.1 Market Overview
2.2 Regional Synopsis
2.3 Competitive Summary
3. Research Methodology
3.1 Top-Down Approach
3.2 Bottom-up Approach
3.3. Data Validation
3.4 Primary Interviews
4. Market Dynamics Impact Analysis
4.1 Market Driving Factors Analysis
4.1.1 Drivers
4.1.2 Restraints
4.1.3 Opportunities
4.1.4 Challenges
4.2 PESTLE Analysis
4.3 Porter’s Five Forces Model
5. Statistical Insights and Trends Reporting
5.1 Adoption Rates of Emerging Technologies
5.2 Network Infrastructure Expansion, by Region
5.3 Cybersecurity Incidents, by Region (2020-2023)
5.4 Cloud Services Usage, by Region
6. Competitive Landscape
6.1 List of Major Companies, By Region
6.2 Market Share Analysis, By Region
6.3 Type Benchmarking
6.3.1 Type specifications and features
6.3.2 Pricing
6.4 Strategic Initiatives
6.4.1 Marketing and promotional activities
6.4.2 Distribution and supply chain strategies
6.4.3 Expansion plans and new Age Cohort launches
6.4.4 Strategic partnerships and collaborations
6.5 Technological Advancements
6.6 Market Positioning and Branding
7. Digital Farming Market Segmentation, By Infrastructure
7.1 Chapter Overview
7.2 Sensing & Monitoring
7.2.1 Sensing & Monitoring Market Trends Analysis (2020-2032)
7.2.2 Sensing & Monitoring Market Size Estimates and Forecasts to 2032 (USD Billion)
7.2.3 Sensors
7.2.3.1 Sensors Market Trends Analysis (2020-2032)
7.2.3.2 Sensors Market Size Estimates and Forecasts to 2032 (USD Billion)
7.2.4 Cameras
7.2.4.1 Cameras Market Trends Analysis (2020-2032)
7.2.4.2 Cameras Market Size Estimates and Forecasts to 2032 (USD Billion)
7.3 Communication Technology
7.3.1 Communication Technology Market Trends Analysis (2020-2032)
7.3.2 Communication Technology Market Size Estimates and Forecasts to 2032 (USD Billion)
7.3.3 Short Range
7.3.3.1 Short Range Market Trends Analysis (2020-2032)
7.3.3.2 Short Range Market Size Estimates and Forecasts to 2032 (USD Billion)
7.3.4 Medium Range
7.3.4.1 Medium Range Market Trends Analysis (2020-2032)
7.3.4.2 Medium Range Market Size Estimates and Forecasts to 2032 (USD Billion)
7.3.5 Long Range
7.3.5.1 Long Range Market Trends Analysis (2020-2032)
7.3.5.2 Long Range Market Size Estimates and Forecasts to 2032 (USD Billion)
7.4 Cloud & Data Processing
7.4.1 Cloud & Data Processing Market Trends Analysis (2020-2032)
7.4.2 Cloud & Data Processing Market Size Estimates and Forecasts to 2032 (USD Billion)
7.5 Telematics/Positioning
7.5.1 Telematics/Positioning Market Trends Analysis (2020-2032)
7.5.2 Telematics/Positioning Market Size Estimates and Forecasts to 2032 (USD Billion)
7.5.3 GPS/GNSS
7.5.3.1 GPS/GNSS Market Trends Analysis (2020-2032)
7.5.3.2 GPS/GNSS Market Size Estimates and Forecasts to 2032 (USD Billion)
7.5.4 GIS
7.5.4.1 GIS Market Trends Analysis (2020-2032)
7.5.4.2 GIS Market Size Estimates and Forecasts to 2032 (USD Billion)
7.6 End-Use Components
7.6.1 End-Use Components Market Trends Analysis (2020-2032)
7.6.2 End-Use Components Market Size Estimates and Forecasts to 2032 (USD Billion)
7.6.3 Hardware/Systems
7.6.3.1 Hardware/Systems Market Trends Analysis (2020-2032)
7.6.3.2 Hardware/Systems Market Size Estimates and Forecasts to 2032 (USD Billion)
7.6.4 Software/Apps
7.6.4.1 Software/Apps Market Trends Analysis (2020-2032)
7.6.4.2 Software/Apps Market Size Estimates and Forecasts to 2032 (USD Billion)
8. Digital Farming Market Segmentation, By Product
8.1 Chapter Overview
8.2 Agricultural Equipment
8.2.1 Agricultural Equipment Market Trends Analysis (2020-2032)
8.2.2 Agricultural Equipment Market Size Estimates and Forecasts to 2032 (USD Billion)
8.3 Drones/Robots/Unmanned Aerial Vehicles
8.3.1 Drones/Robots/Unmanned Aerial Vehicles Market Trends Analysis (2020-2032)
8.3.2 Drones/Robots/Unmanned Aerial Vehicles Market Size Estimates and Forecasts to 2032 (USD Billion)
9. Digital Farming Market Segmentation, by Technology
9.1 Chapter Overview
9.2 AI/ML/NLP
9.2.1 AI/ML/NLP Market Trends Analysis (2020-2032)
9.2.2 AI/ML/NLP Market Size Estimates and Forecasts to 2032 (USD Billion)
9.3 IoT
9.3.1 IoT Market Trends Analysis (2020-2032)
9.3.2 IoT Market Size Estimates and Forecasts to 2032 (USD Billion)
9.4 Blockchain
9.4.1 Blockchain Market Trends Analysis (2020-2032)
9.4.2 Blockchain Market Size Estimates and Forecasts to 2032 (USD Billion)
9.5 Big Data & Analytics
9.5.1 Big Data & Analytics Market Trends Analysis (2020-2032)
9.5.2 Big Data & Analytics Market Size Estimates and Forecasts to 2032 (USD Billion)
10. Digital Farming Market Segmentation, by Application
10.1 Chapter Overview
10.2 Yield Monitoring and Mapping
10.2.1 Yield Monitoring and Mapping Market Trends Analysis (2020-2032)
10.2.2 Yield Monitoring and Mapping Market Size Estimates and Forecasts to 2032 (USD Billion)
10.3 Smart Crop Monitoring
10.3.1 Smart Crop Monitoring Market Trends Analysis (2020-2032)
10.3.2 Smart Crop Monitoring Market Size Estimates and Forecasts to 2032 (USD Billion)
10.4 Soil & Fertilizer Management
10.4.1 Soil & Fertilizer Management Market Trends Analysis (2020-2032)
10.4.2 Soil & Fertilizer Management Market Size Estimates and Forecasts to 2032 (USD Billion)
10.5 Smart Irrigation Monitoring System
10.5.1 Smart Irrigation Monitoring System Market Trends Analysis (2020-2032)
10.5.2 Smart Irrigation Monitoring System Market Size Estimates and Forecasts to 2032 (USD Billion)
10.6 Weather Forecasting
10.6.1 Weather Forecasting Market Trends Analysis (2020-2032)
10.6.2 Weather Forecasting Market Size Estimates and Forecasts to 2032 (USD Billion)
10.7 Others
10.7.1 Others Market Trends Analysis (2020-2032)
10.7.2 Others Market Size Estimates and Forecasts to 2032 (USD Billion)
11. Regional Analysis
11.1 Chapter Overview
11.2 North America
11.2.1 Trends Analysis
11.2.2 North America Digital Farming Market Estimates and Forecasts, by Country (2020-2032) (USD Billion)
11.2.3 North America Digital Farming Market Estimates and Forecasts, By Infrastructure (2020-2032) (USD Billion)
11.2.4 North America Digital Farming Market Estimates and Forecasts, By Product (2020-2032) (USD Billion)
11.2.5 North America Digital Farming Market Estimates and Forecasts, by Technology (2020-2032) (USD Billion)
11.2.6 North America Digital Farming Market Estimates and Forecasts, by Application (2020-2032) (USD Billion)
11.2.7 USA
11.2.7.1 USA Digital Farming Market Estimates and Forecasts, By Infrastructure (2020-2032) (USD Billion)
11.2.7.2 USA Digital Farming Market Estimates and Forecasts, By Product (2020-2032) (USD Billion)
11.2.7.3 USA Digital Farming Market Estimates and Forecasts, by Technology (2020-2032) (USD Billion)
11.2.7.4 USA Digital Farming Market Estimates and Forecasts, by Application (2020-2032) (USD Billion)
11.2.8 Canada
11.2.8.1 Canada Digital Farming Market Estimates and Forecasts, By Infrastructure (2020-2032) (USD Billion)
11.2.8.2 Canada Digital Farming Market Estimates and Forecasts, By Product (2020-2032) (USD Billion)
11.2.8.3 Canada Digital Farming Market Estimates and Forecasts, by Technology (2020-2032) (USD Billion)
11.2.8.4 Canada Digital Farming Market Estimates and Forecasts, by Application (2020-2032) (USD Billion)
11.2.9 Mexico
11.2.9.1 Mexico Digital Farming Market Estimates and Forecasts, By Infrastructure (2020-2032) (USD Billion)
11.2.9.2 Mexico Digital Farming Market Estimates and Forecasts, By Product (2020-2032) (USD Billion)
11.2.9.3 Mexico Digital Farming Market Estimates and Forecasts, by Technology (2020-2032) (USD Billion)
11.2.9.4 Mexico Digital Farming Market Estimates and Forecasts, by Application (2020-2032) (USD Billion)
11.3 Europe
11.3.1 Eastern Europe
11.3.1.1 Trends Analysis
11.3.1.2 Eastern Europe Digital Farming Market Estimates and Forecasts, by Country (2020-2032) (USD Billion)
11.3.1.3 Eastern Europe Digital Farming Market Estimates and Forecasts, By Infrastructure (2020-2032) (USD Billion)
11.3.1.4 Eastern Europe Digital Farming Market Estimates and Forecasts, By Product (2020-2032) (USD Billion)
11.3.1.5 Eastern Europe Digital Farming Market Estimates and Forecasts, by Technology (2020-2032) (USD Billion)
11.3.1.6 Eastern Europe Digital Farming Market Estimates and Forecasts, by Application (2020-2032) (USD Billion)
11.3.1.7 Poland
11.3.1.7.1 Poland Digital Farming Market Estimates and Forecasts, By Infrastructure (2020-2032) (USD Billion)
11.3.1.7.2 Poland Digital Farming Market Estimates and Forecasts, By Product (2020-2032) (USD Billion)
11.3.1.7.3 Poland Digital Farming Market Estimates and Forecasts, by Technology (2020-2032) (USD Billion)
11.3.1.7.4 Poland Digital Farming Market Estimates and Forecasts, by Application (2020-2032) (USD Billion)
11.3.1.8 Romania
11.3.1.8.1 Romania Digital Farming Market Estimates and Forecasts, By Infrastructure (2020-2032) (USD Billion)
11.3.1.8.2 Romania Digital Farming Market Estimates and Forecasts, By Product (2020-2032) (USD Billion)
11.3.1.8.3 Romania Digital Farming Market Estimates and Forecasts, by Technology (2020-2032) (USD Billion)
11.3.1.8.4 Romania Digital Farming Market Estimates and Forecasts, by Application (2020-2032) (USD Billion)
11.3.1.9 Hungary
11.3.1.9.1 Hungary Digital Farming Market Estimates and Forecasts, By Infrastructure (2020-2032) (USD Billion)
11.3.1.9.2 Hungary Digital Farming Market Estimates and Forecasts, By Product (2020-2032) (USD Billion)
11.3.1.9.3 Hungary Digital Farming Market Estimates and Forecasts, by Technology (2020-2032) (USD Billion)
11.3.1.9.4 Hungary Digital Farming Market Estimates and Forecasts, by Application (2020-2032) (USD Billion)
11.3.1.10 Turkey
11.3.1.10.1 Turkey Digital Farming Market Estimates and Forecasts, By Infrastructure (2020-2032) (USD Billion)
11.3.1.10.2 Turkey Digital Farming Market Estimates and Forecasts, By Product (2020-2032) (USD Billion)
11.3.1.10.3 Turkey Digital Farming Market Estimates and Forecasts, by Technology (2020-2032) (USD Billion)
11.3.1.10.4 Turkey Digital Farming Market Estimates and Forecasts, by Application (2020-2032) (USD Billion)
11.3.1.11 Rest of Eastern Europe
11.3.1.11.1 Rest of Eastern Europe Digital Farming Market Estimates and Forecasts, By Infrastructure (2020-2032) (USD Billion)
11.3.1.11.2 Rest of Eastern Europe Digital Farming Market Estimates and Forecasts, By Product (2020-2032) (USD Billion)
11.3.1.11.3 Rest of Eastern Europe Digital Farming Market Estimates and Forecasts, by Technology (2020-2032) (USD Billion)
11.3.1.11.4 Rest of Eastern Europe Digital Farming Market Estimates and Forecasts, by Application (2020-2032) (USD Billion)
11.3.2 Western Europe
11.3.2.1 Trends Analysis
11.3.2.2 Western Europe Digital Farming Market Estimates and Forecasts, by Country (2020-2032) (USD Billion)
11.3.2.3 Western Europe Digital Farming Market Estimates and Forecasts, By Infrastructure (2020-2032) (USD Billion)
11.3.2.4 Western Europe Digital Farming Market Estimates and Forecasts, By Product (2020-2032) (USD Billion)
11.3.2.5 Western Europe Digital Farming Market Estimates and Forecasts, by Technology (2020-2032) (USD Billion)
11.3.2.6 Western Europe Digital Farming Market Estimates and Forecasts, by Application (2020-2032) (USD Billion)
11.3.2.7 Germany
11.3.2.7.1 Germany Digital Farming Market Estimates and Forecasts, By Infrastructure (2020-2032) (USD Billion)
11.3.2.7.2 Germany Digital Farming Market Estimates and Forecasts, By Product (2020-2032) (USD Billion)
11.3.2.7.3 Germany Digital Farming Market Estimates and Forecasts, by Technology (2020-2032) (USD Billion)
11.3.2.7.4 Germany Digital Farming Market Estimates and Forecasts, by Application (2020-2032) (USD Billion)
11.3.2.8 France
11.3.2.8.1 France Digital Farming Market Estimates and Forecasts, By Infrastructure (2020-2032) (USD Billion)
11.3.2.8.2 France Digital Farming Market Estimates and Forecasts, By Product (2020-2032) (USD Billion)
11.3.2.8.3 France Digital Farming Market Estimates and Forecasts, by Technology (2020-2032) (USD Billion)
11.3.2.8.4 France Digital Farming Market Estimates and Forecasts, by Application (2020-2032) (USD Billion)
11.3.2.9 UK
11.3.2.9.1 UK Digital Farming Market Estimates and Forecasts, By Infrastructure (2020-2032) (USD Billion)
11.3.2.9.2 UK Digital Farming Market Estimates and Forecasts, By Product (2020-2032) (USD Billion)
11.3.2.9.3 UK Digital Farming Market Estimates and Forecasts, by Technology (2020-2032) (USD Billion)
11.3.2.9.4 UK Digital Farming Market Estimates and Forecasts, by Application (2020-2032) (USD Billion)
11.3.2.10 Italy
11.3.2.10.1 Italy Digital Farming Market Estimates and Forecasts, By Infrastructure (2020-2032) (USD Billion)
11.3.2.10.2 Italy Digital Farming Market Estimates and Forecasts, By Product (2020-2032) (USD Billion)
11.3.2.10.3 Italy Digital Farming Market Estimates and Forecasts, by Technology (2020-2032) (USD Billion)
11.3.2.10.4 Italy Digital Farming Market Estimates and Forecasts, by Application (2020-2032) (USD Billion)
11.3.2.11 Spain
11.3.2.11.1 Spain Digital Farming Market Estimates and Forecasts, By Infrastructure (2020-2032) (USD Billion)
11.3.2.11.2 Spain Digital Farming Market Estimates and Forecasts, By Product (2020-2032) (USD Billion)
11.3.2.11.3 Spain Digital Farming Market Estimates and Forecasts, by Technology (2020-2032) (USD Billion)
11.3.2.11.4 Spain Digital Farming Market Estimates and Forecasts, by Application (2020-2032) (USD Billion)
11.3.2.12 Netherlands
11.3.2.12.1 Netherlands Digital Farming Market Estimates and Forecasts, By Infrastructure (2020-2032) (USD Billion)
11.3.2.12.2 Netherlands Digital Farming Market Estimates and Forecasts, By Product (2020-2032) (USD Billion)
11.3.2.12.3 Netherlands Digital Farming Market Estimates and Forecasts, by Technology (2020-2032) (USD Billion)
11.3.2.12.4 Netherlands Digital Farming Market Estimates and Forecasts, by Application (2020-2032) (USD Billion)
11.3.2.13 Switzerland
11.3.2.13.1 Switzerland Digital Farming Market Estimates and Forecasts, By Infrastructure (2020-2032) (USD Billion)
11.3.2.13.2 Switzerland Digital Farming Market Estimates and Forecasts, By Product (2020-2032) (USD Billion)
11.3.2.13.3 Switzerland Digital Farming Market Estimates and Forecasts, by Technology (2020-2032) (USD Billion)
11.3.2.13.4 Switzerland Digital Farming Market Estimates and Forecasts, by Application (2020-2032) (USD Billion)
11.3.2.14 Austria
11.3.2.14.1 Austria Digital Farming Market Estimates and Forecasts, By Infrastructure (2020-2032) (USD Billion)
11.3.2.14.2 Austria Digital Farming Market Estimates and Forecasts, By Product (2020-2032) (USD Billion)
11.3.2.14.3 Austria Digital Farming Market Estimates and Forecasts, by Technology (2020-2032) (USD Billion)
11.3.2.14.4 Austria Digital Farming Market Estimates and Forecasts, by Application (2020-2032) (USD Billion)
11.3.2.15 Rest of Western Europe
11.3.2.15.1 Rest of Western Europe Digital Farming Market Estimates and Forecasts, By Infrastructure (2020-2032) (USD Billion)
11.3.2.15.2 Rest of Western Europe Digital Farming Market Estimates and Forecasts, By Product (2020-2032) (USD Billion)
11.3.2.15.3 Rest of Western Europe Digital Farming Market Estimates and Forecasts, by Technology (2020-2032) (USD Billion)
11.3.2.15.4 Rest of Western Europe Digital Farming Market Estimates and Forecasts, by Application (2020-2032) (USD Billion)
11.4 Asia Pacific
11.4.1 Trends Analysis
11.4.2 Asia Pacific Digital Farming Market Estimates and Forecasts, by Country (2020-2032) (USD Billion)
11.4.3 Asia Pacific Digital Farming Market Estimates and Forecasts, By Infrastructure (2020-2032) (USD Billion)
11.4.4 Asia Pacific Digital Farming Market Estimates and Forecasts, By Product (2020-2032) (USD Billion)
11.4.5 Asia Pacific Digital Farming Market Estimates and Forecasts, by Technology (2020-2032) (USD Billion)
11.4.6 Asia Pacific Digital Farming Market Estimates and Forecasts, by Application (2020-2032) (USD Billion)
11.4.7 China
11.4.7.1 China Digital Farming Market Estimates and Forecasts, By Infrastructure (2020-2032) (USD Billion)
11.4.7.2 China Digital Farming Market Estimates and Forecasts, By Product (2020-2032) (USD Billion)
11.4.7.3 China Digital Farming Market Estimates and Forecasts, by Technology (2020-2032) (USD Billion)
11.4.7.4 China Digital Farming Market Estimates and Forecasts, by Application (2020-2032) (USD Billion)
11.4.8 India
11.4.8.1 India Digital Farming Market Estimates and Forecasts, By Infrastructure (2020-2032) (USD Billion)
11.4.8.2 India Digital Farming Market Estimates and Forecasts, By Product (2020-2032) (USD Billion)
11.4.8.3 India Digital Farming Market Estimates and Forecasts, by Technology (2020-2032) (USD Billion)
11.4.8.4 India Digital Farming Market Estimates and Forecasts, by Application (2020-2032) (USD Billion)
11.4.9 Japan
11.4.9.1 Japan Digital Farming Market Estimates and Forecasts, By Infrastructure (2020-2032) (USD Billion)
11.4.9.2 Japan Digital Farming Market Estimates and Forecasts, By Product (2020-2032) (USD Billion)
11.4.9.3 Japan Digital Farming Market Estimates and Forecasts, by Technology (2020-2032) (USD Billion)
11.4.9.4 Japan Digital Farming Market Estimates and Forecasts, by Application (2020-2032) (USD Billion)
11.4.10 South Korea
11.4.10.1 South Korea Digital Farming Market Estimates and Forecasts, By Infrastructure (2020-2032) (USD Billion)
11.4.10.2 South Korea Digital Farming Market Estimates and Forecasts, By Product (2020-2032) (USD Billion)
11.4.10.3 South Korea Digital Farming Market Estimates and Forecasts, by Technology (2020-2032) (USD Billion)
11.4.10.4 South Korea Digital Farming Market Estimates and Forecasts, by Application (2020-2032) (USD Billion)
11.4.11 Vietnam
11.4.11.1 Vietnam Digital Farming Market Estimates and Forecasts, By Infrastructure (2020-2032) (USD Billion)
11.4.11.2 Vietnam Digital Farming Market Estimates and Forecasts, By Product (2020-2032) (USD Billion)
11.4.11.3 Vietnam Digital Farming Market Estimates and Forecasts, by Technology (2020-2032) (USD Billion)
11.4.11.4 Vietnam Digital Farming Market Estimates and Forecasts, by Application (2020-2032) (USD Billion)
11.4.12 Singapore
11.4.12.1 Singapore Digital Farming Market Estimates and Forecasts, By Infrastructure (2020-2032) (USD Billion)
11.4.12.2 Singapore Digital Farming Market Estimates and Forecasts, By Product (2020-2032) (USD Billion)
11.4.12.3 Singapore Digital Farming Market Estimates and Forecasts, by Technology (2020-2032) (USD Billion)
11.4.12.4 Singapore Digital Farming Market Estimates and Forecasts, by Application (2020-2032) (USD Billion)
11.4.13 Australia
11.4.13.1 Australia Digital Farming Market Estimates and Forecasts, By Infrastructure (2020-2032) (USD Billion)
11.4.13.2 Australia Digital Farming Market Estimates and Forecasts, By Product (2020-2032) (USD Billion)
11.4.13.3 Australia Digital Farming Market Estimates and Forecasts, by Technology (2020-2032) (USD Billion)
11.4.13.4 Australia Digital Farming Market Estimates and Forecasts, by Application (2020-2032) (USD Billion)
11.4.14 Rest of Asia Pacific
11.4.14.1 Rest of Asia Pacific Digital Farming Market Estimates and Forecasts, By Infrastructure (2020-2032) (USD Billion)
11.4.14.2 Rest of Asia Pacific Digital Farming Market Estimates and Forecasts, By Product (2020-2032) (USD Billion)
11.4.14.3 Rest of Asia Pacific Digital Farming Market Estimates and Forecasts, by Technology (2020-2032) (USD Billion)
11.4.14.4 Rest of Asia Pacific Digital Farming Market Estimates and Forecasts, by Application (2020-2032) (USD Billion)
11.5 Middle East and Africa
11.5.1 Middle East
11.5.1.1 Trends Analysis
11.5.1.2 Middle East Digital Farming Market Estimates and Forecasts, by Country (2020-2032) (USD Billion)
11.5.1.3 Middle East Digital Farming Market Estimates and Forecasts, By Infrastructure (2020-2032) (USD Billion)
11.5.1.4 Middle East Digital Farming Market Estimates and Forecasts, By Product (2020-2032) (USD Billion)
11.5.1.5 Middle East Digital Farming Market Estimates and Forecasts, by Technology (2020-2032) (USD Billion)
11.5.1.6 Middle East Digital Farming Market Estimates and Forecasts, by Application (2020-2032) (USD Billion)
11.5.1.7 UAE
11.5.1.7.1 UAE Digital Farming Market Estimates and Forecasts, By Infrastructure (2020-2032) (USD Billion)
11.5.1.7.2 UAE Digital Farming Market Estimates and Forecasts, By Product (2020-2032) (USD Billion)
11.5.1.7.3 UAE Digital Farming Market Estimates and Forecasts, by Technology (2020-2032) (USD Billion)
11.5.1.7.4 UAE Digital Farming Market Estimates and Forecasts, by Application (2020-2032) (USD Billion)
11.5.1.8 Egypt
11.5.1.8.1 Egypt Digital Farming Market Estimates and Forecasts, By Infrastructure (2020-2032) (USD Billion)
11.5.1.8.2 Egypt Digital Farming Market Estimates and Forecasts, By Product (2020-2032) (USD Billion)
11.5.1.8.3 Egypt Digital Farming Market Estimates and Forecasts, by Technology (2020-2032) (USD Billion)
11.5.1.8.4 Egypt Digital Farming Market Estimates and Forecasts, by Application (2020-2032) (USD Billion)
11.5.1.9 Saudi Arabia
11.5.1.9.1 Saudi Arabia Digital Farming Market Estimates and Forecasts, By Infrastructure (2020-2032) (USD Billion)
11.5.1.9.2 Saudi Arabia Digital Farming Market Estimates and Forecasts, By Product (2020-2032) (USD Billion)
11.5.1.9.3 Saudi Arabia Digital Farming Market Estimates and Forecasts, by Technology (2020-2032) (USD Billion)
11.5.1.9.4 Saudi Arabia Digital Farming Market Estimates and Forecasts, by Application (2020-2032) (USD Billion)
11.5.1.10 Qatar
11.5.1.10.1 Qatar Digital Farming Market Estimates and Forecasts, By Infrastructure (2020-2032) (USD Billion)
11.5.1.10.2 Qatar Digital Farming Market Estimates and Forecasts, By Product (2020-2032) (USD Billion)
11.5.1.10.3 Qatar Digital Farming Market Estimates and Forecasts, by Technology (2020-2032) (USD Billion)
11.5.1.10.4 Qatar Digital Farming Market Estimates and Forecasts, by Application (2020-2032) (USD Billion)
11.5.1.11 Rest of Middle East
11.5.1.11.1 Rest of Middle East Digital Farming Market Estimates and Forecasts, By Infrastructure (2020-2032) (USD Billion)
11.5.1.11.2 Rest of Middle East Digital Farming Market Estimates and Forecasts, By Product (2020-2032) (USD Billion)
11.5.1.11.3 Rest of Middle East Digital Farming Market Estimates and Forecasts, by Technology (2020-2032) (USD Billion)
11.5.1.11.4 Rest of Middle East Digital Farming Market Estimates and Forecasts, by Application (2020-2032) (USD Billion)
11.5.2 Africa
11.5.2.1 Trends Analysis
11.5.2.2 Africa Digital Farming Market Estimates and Forecasts, by Country (2020-2032) (USD Billion)
11.5.2.3 Africa Digital Farming Market Estimates and Forecasts, By Infrastructure (2020-2032) (USD Billion)
11.5.2.4 Africa Digital Farming Market Estimates and Forecasts, By Product (2020-2032) (USD Billion)
11.5.2.5 Africa Digital Farming Market Estimates and Forecasts, by Technology (2020-2032) (USD Billion)
11.5.2.6 Africa Digital Farming Market Estimates and Forecasts, by Application (2020-2032) (USD Billion)
11.5.2.7 South Africa
11.5.2.7.1 South Africa Digital Farming Market Estimates and Forecasts, By Infrastructure (2020-2032) (USD Billion)
11.5.2.7.2 South Africa Digital Farming Market Estimates and Forecasts, By Product (2020-2032) (USD Billion)
11.5.2.7.3 South Africa Digital Farming Market Estimates and Forecasts, by Technology (2020-2032) (USD Billion)
11.5.2.7.4 South Africa Digital Farming Market Estimates and Forecasts, by Application (2020-2032) (USD Billion)
11.5.2.8 Nigeria
11.5.2.8.1 Nigeria Digital Farming Market Estimates and Forecasts, By Infrastructure (2020-2032) (USD Billion)
11.5.2.8.2 Nigeria Digital Farming Market Estimates and Forecasts, By Product (2020-2032) (USD Billion)
11.5.2.8.3 Nigeria Digital Farming Market Estimates and Forecasts, by Technology (2020-2032) (USD Billion)
11.5.2.8.4 Nigeria Digital Farming Market Estimates and Forecasts, by Application (2020-2032) (USD Billion)
11.5.2.9 Rest of Africa
11.5.2.9.1 Rest of Africa Digital Farming Market Estimates and Forecasts, By Infrastructure (2020-2032) (USD Billion)
11.5.2.9.2 Rest of Africa Digital Farming Market Estimates and Forecasts, By Product (2020-2032) (USD Billion)
11.5.2.9.3 Rest of Africa Digital Farming Market Estimates and Forecasts, by Technology (2020-2032) (USD Billion)
11.5.2.9.4 Rest of Africa Digital Farming Market Estimates and Forecasts, by Application (2020-2032) (USD Billion)
11.6 Latin America
11.6.1 Trends Analysis
11.6.2 Latin America Digital Farming Market Estimates and Forecasts, by Country (2020-2032) (USD Billion)
11.6.3 Latin America Digital Farming Market Estimates and Forecasts, By Infrastructure (2020-2032) (USD Billion)
11.6.4 Latin America Digital Farming Market Estimates and Forecasts, By Product (2020-2032) (USD Billion)
11.6.5 Latin America Digital Farming Market Estimates and Forecasts, by Technology (2020-2032) (USD Billion)
11.6.6 Latin America Digital Farming Market Estimates and Forecasts, by Application (2020-2032) (USD Billion)
11.6.7 Brazil
11.6.7.1 Brazil Digital Farming Market Estimates and Forecasts, By Infrastructure (2020-2032) (USD Billion)
11.6.7.2 Brazil Digital Farming Market Estimates and Forecasts, By Product (2020-2032) (USD Billion)
11.6.7.3 Brazil Digital Farming Market Estimates and Forecasts, by Technology (2020-2032) (USD Billion)
11.6.7.4 Brazil Digital Farming Market Estimates and Forecasts, by Application (2020-2032) (USD Billion)
11.6.8 Argentina
11.6.8.1 Argentina Digital Farming Market Estimates and Forecasts, By Infrastructure (2020-2032) (USD Billion)
11.6.8.2 Argentina Digital Farming Market Estimates and Forecasts, By Product (2020-2032) (USD Billion)
11.6.8.3 Argentina Digital Farming Market Estimates and Forecasts, by Technology (2020-2032) (USD Billion)
11.6.8.4 Argentina Digital Farming Market Estimates and Forecasts, by Application (2020-2032) (USD Billion)
11.6.9 Colombia
11.6.9.1 Colombia Digital Farming Market Estimates and Forecasts, By Infrastructure (2020-2032) (USD Billion)
11.6.9.2 Colombia Digital Farming Market Estimates and Forecasts, By Product (2020-2032) (USD Billion)
11.6.9.3 Colombia Digital Farming Market Estimates and Forecasts, by Technology (2020-2032) (USD Billion)
11.6.9.4 Colombia Digital Farming Market Estimates and Forecasts, by Application (2020-2032) (USD Billion)
11.6.10 Rest of Latin America
11.6.10.1 Rest of Latin America Digital Farming Market Estimates and Forecasts, By Infrastructure (2020-2032) (USD Billion)
11.6.10.2 Rest of Latin America Digital Farming Market Estimates and Forecasts, By Product (2020-2032) (USD Billion)
11.6.10.3 Rest of Latin America Digital Farming Market Estimates and Forecasts, by Technology (2020-2032) (USD Billion)
11.6.10.4 Rest of Latin America Digital Farming Market Estimates and Forecasts, by Application (2020-2032) (USD Billion)
12. Company Profiles
12.1 Topcon Corporation
12.1.1 Company Overview
12.1.2 Financial
12.1.3 Product / Services Offered
12.1.4 SWOT Analysis
12.2 Deere & Company
12.2.1 Company Overview
12.2.2 Financial
12.2.3 Product / Services Offered
12.2.4 SWOT Analysis
12.3 AGCO Corporation
12.3.1 Company Overview
12.3.2 Financial
12.3.3 Product / Services Offered
12.3.4 SWOT Analysis
12.4 Kubota Corporation
12.4.1 Company Overview
12.4.2 Financial
12.4.3 Product / Services Offered
12.4.4 SWOT Analysis
12.5 Hexagon AB
12.5.1 Company Overview
12.5.2 Financial
12.5.3 Product / Services Offered
12.5.4 SWOT Analysis
12.6 CNH Industrial N.V.
12.6.1 Company Overview
12.6.2 Financial
12.6.3 Product / Services Offered
12.6.4 SWOT Analysis
12.7 Bayer Crop Science Limited
12.7.1 Company Overview
12.7.2 Financial
12.7.3 Product / Services Offered
12.7.4 SWOT Analysis
12.8 Syngenta Group
12.8.1 Company Overview
12.8.2 Financial
12.8.3 Product / Services Offered
12.8.4 SWOT Analysis
12.9 Yara International
12.9.1 Company Overview
12.9.2 Financial
12.9.3 Product / Services Offered
12.9.4 SWOT Analysis
12.10 Corteva Agriscience
12.10.1 Company Overview
12.10.2 Financial
12.10.3 Product/ Services Offered
12.10.4 SWOT Analysis
13. Use Cases and Best Practices
14. Conclusion
An accurate research report requires proper strategizing as well as implementation. There are multiple factors involved in the completion of good and accurate research report and selecting the best methodology to compete the research is the toughest part. Since the research reports we provide play a crucial role in any company’s decision-making process, therefore we at SNS Insider always believe that we should choose the best method which gives us results closer to reality. This allows us to reach at a stage wherein we can provide our clients best and accurate investment to output ratio.
Each report that we prepare takes a timeframe of 350-400 business hours for production. Starting from the selection of titles through a couple of in-depth brain storming session to the final QC process before uploading our titles on our website we dedicate around 350 working hours. The titles are selected based on their current market cap and the foreseen CAGR and growth.
The 5 steps process:
Step 1: Secondary Research:
Secondary Research or Desk Research is as the name suggests is a research process wherein, we collect data through the readily available information. In this process we use various paid and unpaid databases which our team has access to and gather data through the same. This includes examining of listed companies’ annual reports, Journals, SEC filling etc. Apart from this our team has access to various associations across the globe across different industries. Lastly, we have exchange relationships with various university as well as individual libraries.
Step 2: Primary Research
When we talk about primary research, it is a type of study in which the researchers collect relevant data samples directly, rather than relying on previously collected data. This type of research is focused on gaining content specific facts that can be sued to solve specific problems. Since the collected data is fresh and first hand therefore it makes the study more accurate and genuine.
We at SNS Insider have divided Primary Research into 2 parts.
Part 1 wherein we interview the KOLs of major players as well as the upcoming ones across various geographic regions. This allows us to have their view over the market scenario and acts as an important tool to come closer to the accurate market numbers. As many as 45 paid and unpaid primary interviews are taken from both the demand and supply side of the industry to make sure we land at an accurate judgement and analysis of the market.
This step involves the triangulation of data wherein our team analyses the interview transcripts, online survey responses and observation of on filed participants. The below mentioned chart should give a better understanding of the part 1 of the primary interview.
Part 2: In this part of primary research the data collected via secondary research and the part 1 of the primary research is validated with the interviews from individual consultants and subject matter experts.
Consultants are those set of people who have at least 12 years of experience and expertise within the industry whereas Subject Matter Experts are those with at least 15 years of experience behind their back within the same space. The data with the help of two main processes i.e., FGDs (Focused Group Discussions) and IDs (Individual Discussions). This gives us a 3rd party nonbiased primary view of the market scenario making it a more dependable one while collation of the data pointers.
Step 3: Data Bank Validation
Once all the information is collected via primary and secondary sources, we run that information for data validation. At our intelligence centre our research heads track a lot of information related to the market which includes the quarterly reports, the daily stock prices, and other relevant information. Our data bank server gets updated every fortnight and that is how the information which we collected using our primary and secondary information is revalidated in real time.
Step 4: QA/QC Process
After all the data collection and validation our team does a final level of quality check and quality assurance to get rid of any unwanted or undesired mistakes. This might include but not limited to getting rid of the any typos, duplication of numbers or missing of any important information. The people involved in this process include technical content writers, research heads and graphics people. Once this process is completed the title gets uploader on our platform for our clients to read it.
Step 5: Final QC/QA Process:
This is the last process and comes when the client has ordered the study. In this process a final QA/QC is done before the study is emailed to the client. Since we believe in giving our clients a good experience of our research studies, therefore, to make sure that we do not lack at our end in any way humanly possible we do a final round of quality check and then dispatch the study to the client.
Key Segments:
By Infrastructure
Sensing & Monitoring
Sensors
Cameras
Communication Technology
Short Range
Medium Range
Long Range
Cloud & Data Processing
Telematics/Positioning
GPS/GNSS
GIS
End-Use Components
Hardware/Systems
Software/Apps
By Product
Agricultural Equipment
Drones/Robots/Unmanned Aerial Vehicles
By Technology
AI/ML/NLP
IoT
Blockchain
Big Data & Analytics
By Application
Yield Monitoring and Mapping
Smart Crop Monitoring
Soil & Fertilizer Management
Smart Irrigation Monitoring System
Weather Forecasting
Others
Request for Segment Customization as per your Business Requirement: Segment Customization Request
REGIONAL COVERAGE:
North America
US
Canada
Mexico
Europe
Eastern Europe
Poland
Romania
Hungary
Turkey
Rest of Eastern Europe
Western Europe
Germany
France
UK
Italy
Spain
Netherlands
Switzerland
Austria
Rest of Western Europe
Asia Pacific
China
India
Japan
South Korea
Vietnam
Singapore
Australia
Rest of Asia Pacific
Middle East & Africa
Middle East
UAE
Egypt
Saudi Arabia
Qatar
Rest of the Middle East
Africa
Nigeria
South Africa
Rest of Africa
Latin America
Brazil
Argentina
Colombia
Request for Country Level Research Report: Country Level Customization Request
Available Customization
With the given market data, SNS Insider offers customization as per the company’s specific needs. The following customization options are available for the report:
Product Analysis
Criss-Cross segment analysis (e.g. Product X Application)
Product Matrix which gives a detailed comparison of product portfolio of each company
Geographic Analysis
Additional countries in any of the regions
Company Information
Detailed analysis and profiling of additional market players (Up to five)
The Intelligent Airways Transportation System Market size was recorded at USD 9.13 billion in 2023 and is expected to reach USD 18.61 billion by 2032, growing at a CAGR of 8.29 % over the forecast period of 2024-2032.
Carbon Footprint Management Market Size was valued at USD 10.68 Billion in 2023 and is expected to reach USD 31.02 Billion by 2032 and grow at a CAGR of 12.60 % over the forecast period 2024-2032.
The Quantum Computing Market size was valued at USD 972.93 million in 2023 and will reach to USD 13,643.9 million by 2032 and grow at a CAGR of 34.1% by 2024-2032
The Conversational Systems Market size was USD 13.32 billion in 2023 and is expected to reach USD 150.30 billion by 2032 and grow at a CAGR of 30.9% over the forecast period of 2024-2032.
The Digital Farming Market size was valued at USD 23.9 Billion in 2023 and is expected to grow to USD 74.70 Billion by 2032 and grow at a CAGR of 13.5% over the forecast period of 2024-2032.
The QR Code Payments Market is anticipated to develop at a CAGR of 16.8% from 2024 to 2031, from an estimated value of USD 11.16 billion in 2023 to USD 38.65 billion in 2031.
Hi! Click one of our member below to chat on Phone