DisplayPort IP Market Report Scope and Overview:
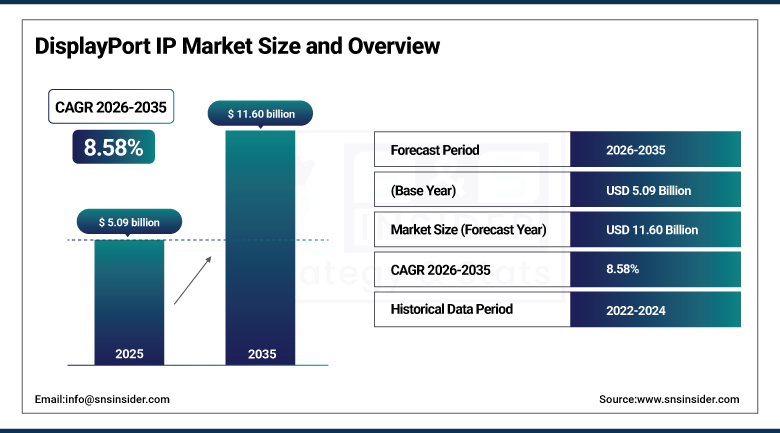
The DisplayPort IP Market size was valued at USD 5.09 Billion in 2025 and is projected to reach USD 11.60 Billion by 2035, growing at a CAGR of 8.58% during 2026-2035.
The DisplayPort IP landscape is ready for significant growth with high-resolution displays, multi-screen set-ups, and bandwidth-hungry use cases in gaming, professional content creation and automotive systems. With the industry showing signs of embracing 8k and higher video standards, the race for high-performance, low-latency video interface is on. DisplayPort IP, becoming a standard feature in GPUs, SoCs, and chipsets, enables compact, energy-efficient display implementations that respond to growing number of display types and choices. The increasingly common adoption of USB Type-C with DisplayPort Alt Mode and convergence with USB4 and Thunderbolt also make the market potential significantly larger. Increased OEM emphasis on immersive experiences and robust data transfers establishes DisplayPort IP as a critical enabler of future-generation visualization and infotainment systems.
VESA Introduces DP80LL Ultra-High-Bit-Rate Cables for DisplayPort 2.1b, Supporting 80 Gbps Speeds 3meters Away VESA, NVIDIA collaboration spawn’s new cables for fastest DP speeds and reach. The new cables are scheduled for Spring 2025, and will improve gaming and content creation, and automotive displays.
DisplayPort IP Market Size and Growth Forecast:
-
Market Size in 2025: USD 5.09 Billion
-
Market Size by 2035: USD 11.60 Billion
-
CAGR: 8.58% from 2026 to 2035
-
Base Year: 2025
-
Forecast Period: 2026–2035
-
Historical Data: 2022–2024
To Get more information On DisplayPort IP Market - Request Free Sample Report
DisplayPort IP Market Trends Highlights:
-
High-performance AV-over-IP extenders supporting 4K60 video transmission at low bandwidth are being introduced to meet rising demand in professional AV and control room environments
-
Adoption of JPEG XS compression is enabling ultra-low latency and visually lossless video transmission for real-time monitoring, broadcasting, and enterprise AV applications
-
Expansion of chiplet-based semiconductor ecosystems is reducing design complexity and accelerating time-to-market for advanced semiconductor solutions
-
Growing emphasis on standards-compliant chiplet interfaces is supporting scalable multi-die integration for data center, AI, and high-performance computing applications
-
Increasing convergence of USB-C and DisplayPort technologies is improving interoperability in enterprise, education, and hybrid work environments
-
Rising demand for flexible network-based AV systems is driving adoption of USB-over-IP, PoE, and IP-based audio-video distribution architectures
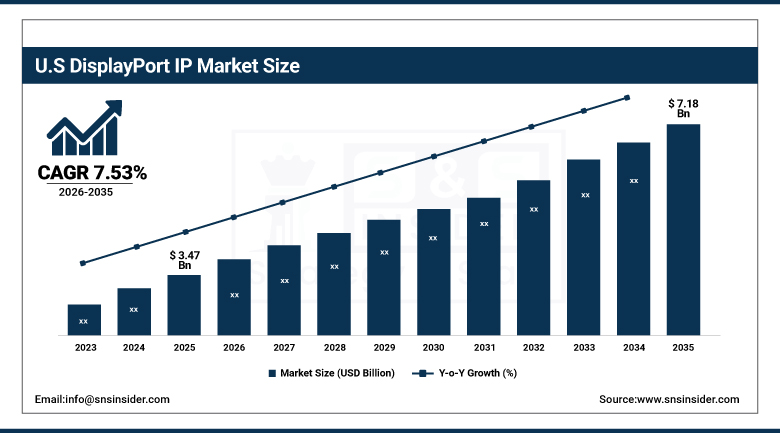
U.S DisplayPort IP Market Size Outlook
The U.S DisplayPort IP market size was valued at USD 3.47 Billion in 2025 and is projected to reach USD 7.18 Billion by 2035, growing at a CAGR of 7.53% during 2026-2035, with increase in demand for ultra-high-definition displays for consumer electronics, growing automotive infotainment systems deployment, and increasing adoption in industrial sectors such as healthcare and defense. Improvements in technology including increased data rates and USB-C compatibility are driving market expansion in various markets.
DisplayPort IP Market Drivers:
-
Rising Demand for Ultra-High-Definition Content Drives Innovation and Enhances DisplayPort IP Market Growth
The demand for ultra-high-definition content, such as 8K video and high-refresh-rate gaming, is driving DisplayPort IP providers to enhance data transfer speeds and integrate advanced power delivery features to stay competitive. The rising adoption of multi-functional cables combining video, data, and power pushes DisplayPort technology to evolve, ensuring compatibility with USB-C and Thunderbolt standards. This competitive pressure accelerates R&D investments and standard enhancements in DisplayPort IP, expanding its applications in consumer electronics, automotive, and industrial sectors, thereby fueling sustained market growth and technological advancement.
China launched GPMI, 192Gbps bandwidth 480W single line new media interface recruitment HDMI and DisplayPort. This one-size-fits-all standard is directed towards high-performance devices, such as 8K monitors and gaming laptops.
DisplayPort IP Market Restraints:
-
High Licensing Fees and Integration Complexity Cause Slower Innovation and Restrain DisplayPort IP Market Growth
High licensing fees associated with DisplayPort technology pose a significant financial challenge for manufacturers, increasing the overall cost of product development. Moreover, the technical difficulty for integrating new added functions supported by the latest version of DisplayPort. For instance, an accelerated data rate, power delivery and forward/backward compatibility with the standard upgrade, has become higher and demands a longer time for development and dedicated skills. This union of high expenses and technological challenges can be stifling to innovation, slowing time-to-market for products and disproportionately affecting smaller companies and new entrants that are resource-scarce. As a result, there are hindrances for the widespread use of DisplayPort IP in various industries. Rising development cost can also encourage manufacturers to look for alternative technologies with lower integration cost, which may limit the growth prospects for the DisplayPort IP market.
DisplayPort IP Market Opportunities:
-
Rising Demand for High-Resolution and Low-Latency AV Systems Fuels DisplayPort IP Opportunity
The increasing trend toward high definition, low latency video processing across Pro AV, broadcast and immersive display solutions is fueling demand for advanced DisplayPort IP. Increasing requirements to support 8K and beyond, and the shift to adaptive compute platforms is driving manufacturers to use DisplayPort IP trends that can support bandwidth-heavy applications that require real-time processing. This presents a large opportunity for the vendors of IP to deliver scalable, compliant and low power consumption DisplayPort solutions optimized for today's SoCs and FPGA based systems. Ranging from gaming and content creation to medical imaging and smart workspaces, the expansion of applications of DisplayPort IP makes the market grow and develops for next-gen visual and interactive technologies.
AMD Unveils Industry-First FPGA-Based DisplayPort 2.1 at ISE 2024, AMD showcased the first adaptive SoC implementation of DisplayPort 2.1 using its Radeon™ RX 7900 XTX GPU, enabling seamless 8K60 content delivery over Novastar LED systems.
DisplayPort IP Market Segment Analysis:
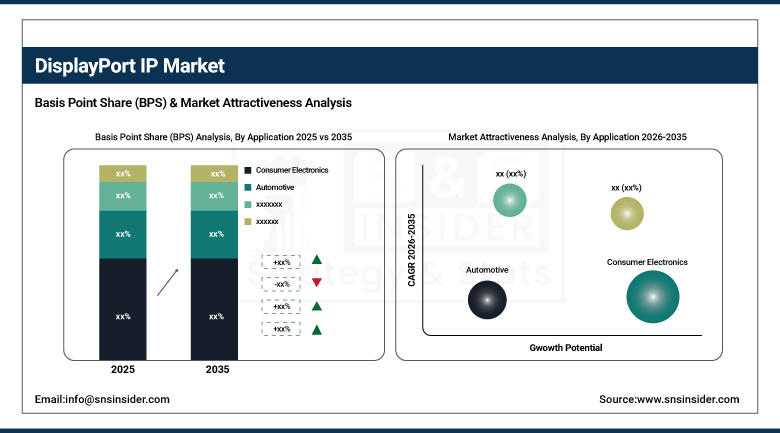
By Application
The Consumer Electronics segment held a dominant DisplayPort IP Market share of around 67% in 2025, driven by the widespread use of DisplayPort technology in devices, such as laptops, monitors, and tablets. Growing demand for high-resolution displays, enhanced multimedia experiences, and seamless connectivity in consumer gadgets continues to fuel the segment’s strong market presence and steady growth.
The Automotive segment is expected to experience the fastest growth in the DisplayPort IP Market over 2026-2035 with a CAGR of 13.21%. This growth is predicted to be driven by the increasing demand for higher-quality user interfaces including advanced infotainment systems, digital dashboards, electronic mirrors, and safety displays within vehicles that need high-speed, reliable video connections to meet stricter safety standards and to provide a richer and more dynamic user experience.
By Version
The DisplayPort 1.0/1.1/1.1a segment held a dominant DisplayPort IP Market share of around 38% in 2025, primarily due to their general compatibility with legacy devices, lower integration costs, and their continuous use in mainstream consumer applications. It has been time proven and reliable due to its stability, so it is commonly used in cost-no-object, and backwards compatible systems.
The DisplayPort 2.1 segment is expected to experience the fastest growth in the DisplayPort IP Market over 2026-2035 with a CAGR of 11.49%, owing to ultra-high bandwidth speeds, improved video resolutions along with better power efficiency. This growth is driven by rising demand for sophisticated displays in gaming, professional content creation, and automotive applications that need high-speed data signaling and future-ready connectivity.
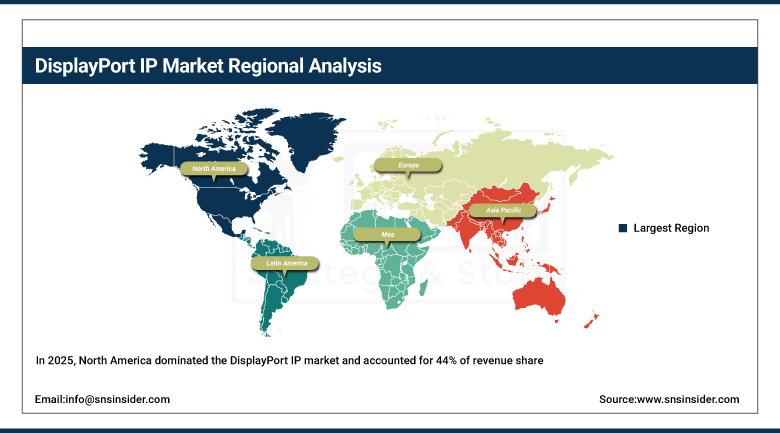
DisplayPort IP Market Regional Analysis:
North America DisplayPort IP Market Trends:
In 2025, North America dominated the DisplayPort IP market and accounted for 44% of revenue share, due to the presence of leading technology companies and early adoption of new-age display solutions. Increase in utilization of high-resolution consumer electronics, automotive infotainment systems, and professional AV applications is one of the factors that boost market growth. Rising R&D investments and well-established infrastructure also contribute to North America leading the DisplayPort IP market.
Get Customized Report as per Your Business Requirement - Enquiry Now
The DisplayPort IP market in the U.S. is growing on the back of increasing demand for high-resolution displays, surging acceptance of high-end consumer electronics, along with the mounting investments in the professional AV and automotive technologies.
Asia-Pacific DisplayPort IP Market Trends:
Asia-Pacific is projected to register the fastest CAGR of 10.27% during 2026-2035, which is attributed to rapid technological advancement, increasing consumer electronics penetration, and growth in the automotive and industrial sector. Increasing infrastructure investments and disposable income, coupled with government policies encouraging digital transformation are the key factors intensifying the demand for advanced DisplayPort IP solutions in the region.
Europe DisplayPort IP Market Trends:
In 2025, Europe emerged as a promising region in the DisplayPort IP market, owing to the rising use of high-definition displays in consumer electronics, industrial, and automotive applications. It is also due strong emphasis on innovation, increasing sustainability efforts, and escalating demand for advanced infotainment systems and professional AV solutions to the overall market size in the region and growth trend.
Latin America and Middle East & Africa DisplayPort IP Market Trends:
LATAM and MEA is experiencing steady growth in the DisplayPort IP market, on account of growing utilization of consumer electronic devices, burgeoning automotive sector and growing focus on digital infrastructure expenditure. An expanding market for high-resolution displays and enhanced connectivity solutions in the two regions is driving market growth, and new economies are carrying the torch by pushing the penetration and advancement of technology for DisplayPort-enabled devices.
DisplayPort IP Market Competitive Landscape:
Parade Technologies, established in 2005, is a Taiwan-based semiconductor company specializing in high-speed interface ICs, including DisplayPort, HDMI, USB-C, and eDP solutions. The company serves PC, display, and consumer electronics markets worldwide, focusing on power-efficient connectivity innovations.
- In March 2025, Parade Technologies announced its acquisition of most Spectra7 Microsystems’ assets, including advanced IP and technology, to enhance its high-speed connectivity solutions for data centers and AI computing.
DisplayPort IP Companies are:
-
Advanced Micro Devices (AMD)
-
Video Electronics Standards Association (VESA)
-
NVIDIA Corporation
-
Intel Corporation
-
Renesas Electronics Corporation
-
Silicon Image (Novatek Microelectronics)
-
Analogix Semiconductor
-
ROHM Semiconductor
-
Texas Instruments Incorporated
-
NXP Semiconductors
-
STMicroelectronics
-
Synopsys, Inc.
-
Cadence Design Systems, Inc.
-
Broadcom Inc.
-
MediaTek Inc.
-
Lattice Semiconductor
-
Realtek Semiconductor Corp.
-
Qualcomm Technologies, Inc.
| Report Attributes | Details |
|---|---|
| Market Size in 2025 | USD 5.09 Billion |
| Market Size by 2035 | USD 11.60 Billion |
| CAGR | CAGR of 8.58% From 2026 to 2035 |
| Base Year | 2025 |
| Forecast Period | 2026-2035 |
| Historical Data | 2022-2024 |
| Report Scope & Coverage | Market Size, Segments Analysis, Competitive Landscape, Regional Analysis, DROC & SWOT Analysis, Forecast Outlook |
| Key Segments | • By Version (DisplayPort 1.0/1.1/1.1a, DisplayPort 1.2/1.2a, DisplayPort 1.3, DisplayPort 1.4/1.4a, DisplayPort 2.0, DisplayPort 2.1) • By Application (Consumer Electronics, Automotive, Industrial (Healthcare, Defense, etc.) |
| Regional Analysis/Coverage | North America (US, Canada), Europe (Germany, UK, France, Italy, Spain, Russia, Poland, Rest of Europe), Asia Pacific (China, India, Japan, South Korea, Australia, ASEAN Countries, Rest of Asia Pacific), Middle East & Africa (UAE, Saudi Arabia, Qatar, South Africa, Rest of Middle East & Africa), Latin America (Brazil, Argentina, Mexico, Colombia, Rest of Latin America). |
| Company Profiles | Intel Corporation, Advanced Micro Devices (AMD), NVIDIA Corporation, Parade Technologies, Video Electronics Standards Association (VESA), Marvell Technology Group, Renesas Electronics Corporation, Silicon Image (Novatek Microelectronics), Analogix Semiconductor, ROHM Semiconductor, Texas Instruments Incorporated, NXP Semiconductors, STMicroelectronics, Synopsys, Inc., Cadence Design Systems, Inc., Broadcom Inc., MediaTek Inc., Lattice Semiconductor, Realtek Semiconductor Corp., Qualcomm Technologies, Inc. |
Get in Touch
