Domes for Semiconductor Equipment Market Size Analysis:
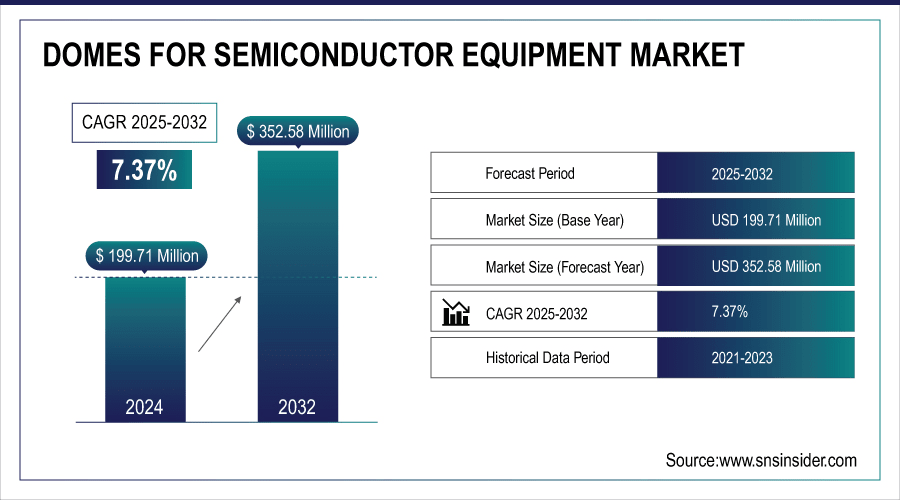
The Domes for Semiconductor Equipment Market size was valued at USD 199.71 Million in 2024 and is projected to reach USD 352.58 Million by 2032, growing at a CAGR of 7.37% during 2025-2032.
The Domes for Semiconductor Equipment market is experiencing robust growth, driven by growing complexity of the semiconductor fabrication and the demand for high-performance parts to maintain the precision, purity, and durability. With the rapid development of the global semiconductor manufacturing industry to cater to next-generation technologies, such as Artificial Intelligence (AI), the Internet of Things (IoT), and electric vehicles, the demand is increasing for trustworthy dome solutions in advanced equipment.
To Get More Information On Domes for Semiconductor Equipment Market - Request Free Sample Report
Industry stakeholders are focusing toward innovation, material upgrade, and strategic partnerships to comply with stringent industry standards and clean room demands. In addition, global imperative to develop technological autonomy and resilient supply chains are driving localization of production and infrastructure and thus adding to the demand. As technology continues to mature and the world’s capacity to manufacture photovoltaics grows, the market is well positioned for domes for semiconductor equipment growth in the future.
Despite U.S. restrictions, China remains the world’s top investor in chipmaking equipment, driving global demand and supply chain expansion. European and global manufacturers must strengthen cooperation with China to sustain competitiveness in the booming semiconductor equipment market.
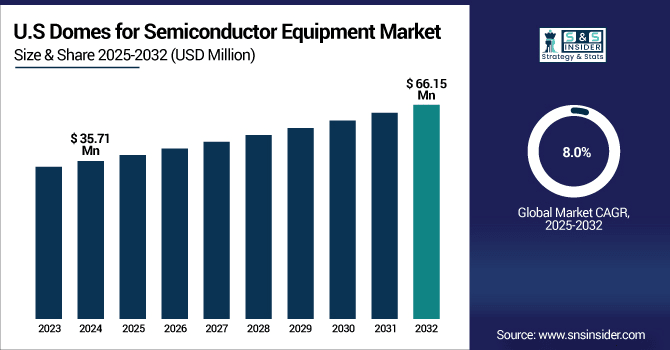
The U.S. Domes for Semiconductor Equipment Market size was valued at USD 35.71 Million in 2024 and is projected to reach USD 66.15 Million by 2032, growing at a CAGR of 8.0% during 2025-2032. The growth is driven by rising domestic investments in chip manufacturing, growing demand for high-end semiconductor devices and increasing demand for high-performance, long-lasting materials in cleanroom situations. Burgeoning government support and reshoring programs also contribute to market growth, as manufactures seek quality high performance parts to satisfy exacting manufacture and reliability test requirements
Domes for Semiconductor Equipment Market Dynamics:
Drivers:
-
Increasing Demand for High-Quality SiC Substrates Enhances Dome Fabrication Needs
Innovations in silicon carbide (SiC) boule fabrication, such as UV-based foreign polytype detection and digital twin process optimization, are significantly enhancing substrate quality and manufacturing efficiency. These developments allow manufacturers to produce larger, thinner wafers with greater precision and fewer defects, paving the way for increased use of SiC devices in electric vehicles, data centers, and "the grid" recall that "the grid" is as potentially high-performance as its "high-performance" end-applications and edge-devices.
With wafer sizes increasing and quality requirements becoming more arduous, the manufacturing process needs stronger domes of high purity to ensure equipment integrity and cleanroom standards. This is in turn growing the market for nitrogen purged domes used in the semiconductor equipment. This continuous progress in technology demands improvement in the SiC wafer making process and is a major reason for the growing demand of high performance dome materials used in producing the semiconductor.
USACH’s BoulePro-200AX revolutionizes SiC substrate production by integrating UV-based polytype detection and digital twin simulation, enabling faster, high-precision, and cost-efficient fabrication to meet soaring global SiC demand.
Restraints:
-
Rapid Semiconductor Tech Advancements Increasing Challenges for Dome Manufacturers
The rapid pace of innovation in semiconductor fabrication technologies creates significant challenges for the Domes for Semiconductor Equipment market. As fabrication schemes advance to more complex steps, the current domes may become unable to meet the requirement for new dimensions and purity of the dielectric material. This progression of the technology requires frequent updation of dome materials and design development by manufacturers. In addition, compatibility with state-of-the-art equipment must be kept up to date through ongoing investment that in turn can be a source of resource burden and can delay market uptake. Therefore, the fast pace of development in the field of semiconductor technology hampers the dome market by increasing complexity and costs of production, thus affecting the growth prospects and operational performance of the dome market.
Opportunities:
-
Increasing Fab Complexity and Labor Shortages Drive Demand for Automated Maintenance Solutions
The growing complexity and scale of semiconductor fabs, combined with a shortage of skilled maintenance engineers, are driving the need for automated and precise maintenance solutions. Automation reduces human error, decreases downtime, and improves yield by ensuring consistent, high-quality equipment upkeep. As fabs expand globally and chip demand surges, manufacturers seek advanced tools that enhance operational efficiency and cost-effectiveness. This creates significant market potential for innovative maintenance technologies that can keep pace with evolving semiconductor fabrication requirements, helping chipmakers maintain productivity and competitiveness in a rapidly changing industry.
Lam Research launched Dextro™, the semiconductor industry’s first collaborative robot for fab maintenance, enhancing precision and reducing tool downtime in advanced wafer fabs Globally.
Challenges:
-
Shortage of Skilled Workforce Causes Reduced Production Efficiency in Dome Manufacturing
The dome manufacturing sector for semiconductor equipment is facing significant challenges due to a shortage of skilled professionals. It demands high-specialized skills for the development and maintenance of these precision parts, only a small amount of experts are available so the production time develops the chances of errors increase. This skills gap prevents the industry from meeting ever-increasing pace of technology change and rising market demand. The industry has an issue of inefficiency and high costs, which could lead to delays on producing high quality domes on time. The need to address this skills deficit with targeted educational and training programs is critical to support productivity, quality, and competitive edge in the on-going transformation of the semiconductor equipment sector.
Domes for Semiconductor Equipment Market Segmentation Outlook:
By Type
The Al2O3 segment held a dominant domes for semiconductor equipment market share of around 49% in 2024. This predominance is due to superior thermal stability, electrical insulation and robustness of Al2O3 suitable for semiconductor in high-performance applications. Strong adoption in high-end manufacturing processes drives solid demand and market growth.
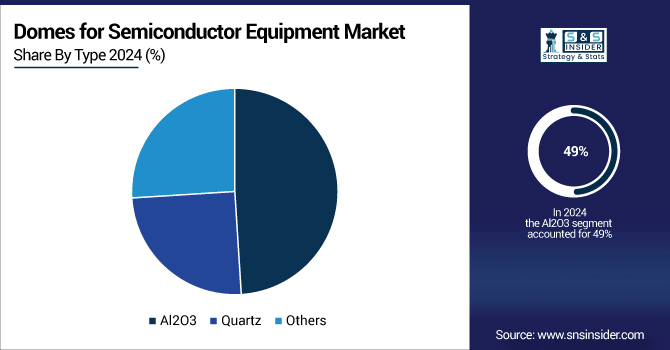
The Quartz segment is expected to experience the fastest growth in the domes for semiconductor equipment Market over 2025-2032 with a CAGR of 11.42%. This is attributed to Quartz’s high purity, high thermal resistance, and great chemical stability, which is critical in high-tech industry where precision and reliability is required for the most advanced semiconductor manufacturing processes.
By Application
300mm Semiconductor Equipment segment is to hold largest share for domes for semiconductor equipment market share of around 56% in 2024 and expected to reach fastest CAGR 8.03% during 2025-2032. This expansion is motivated by the industry drive toward high-volume, low-cost IC fabrication. The use of 300 mm wafers enables higher output and lower per-chip costs. Trending need for advanced technologies such as 5G, AI, and HPC among others also drives demand for 300mm-compatible domes, accentuating market penetration.
Domes for Semiconductor Equipment Market Regional Analysis:
In 2024, the Asia Pacific dominated the domes for semiconductor equipment market and accounted for 44% of revenue share. Fueled by the region’s robust semiconductor manufacturing hub in countries such as China, Taiwan, South Korea, and Japan. Government backing, growth in chip manufacturing capabilities and increasing consumer electronics and automotive semiconductor demand are the predominant factors driving dome uptake, and maintaining the regional dominance.

Get Customized Report as Per Your Business Requirement - Enquiry Now
China leads the Asia Pacific domes for semiconductor equipment market. The momentum is fueled by strong government support, an increase in domestic chip production, and growing investments in domestic semiconductor manufacturing infrastructure.
North America is projected to register the fastest CAGR of 9.04% during 2025-2032, on the back of robust government efforts to encourage domestic production of chips, growing adoption of advanced technologies such as AI and 5G, and higher investments in semiconductor manufacturing facilities & R&D to decrease reliance on overseas equipment suppliers.
The U.S. leads the domes for semiconductor equipment market, Supported by Japan and the Netherlands, tightening export control measures against export of equipment for making chips would contribute to country’s domestic semiconductor investment and allied countries’ equipment demand, and boost market growth.
In 2024, Europe emerged as a promising region in the domes for semiconductor equipment market, driven by increased government funding, strategic collaborations, and efforts to build a resilient semiconductor supply chain. The EU’s push for technological sovereignty, particularly through the European Chips Act, has fueled regional investments in advanced chip manufacturing infrastructure, accelerating demand for precision equipment components including domes.
LATAM and MEA is experiencing steady growth in the domes for semiconductor equipment market, owing to rise in foreign direct investments, rising focus on domestic semiconductor manufacturing and supportive government measures. These regions are undergoing infrastructure development and technology transfer as multinational companies aim to diversify supply chains and mine emerging markets, driving demand for advanced chip making components such as domes.
Key Players:
The domes for semiconductor equipment companies are ASML, Applied Materials, Tokyo Electron, Lam Research, Nikon Corporation, MKS Instruments, Advanced Energy, Murata Manufacturing, Corning Inc., Heraeus, SCHOTT AG, TSMC, and Fujifilm and others.
Recent Developments:
-
In October 2024, Nikon is developing a high-resolution digital lithography system for advanced semiconductor packaging, set for release in 2026. This innovation supports larger package sizes and higher productivity, aligning with growing demand in semiconductor equipment markets, including domes.
-
In August 2024, SCHOTT has launched a low-loss glass with superior high-frequency performance, boosting semiconductor packaging for 5G/6G and AI applications. This innovation enhances signal integrity and energy efficiency in advanced semiconductor manufacturing.
| Report Attributes | Details |
|---|---|
| Market Size in 2024 | USD 199.71 Million |
| Market Size by 2032 | USD 352.58 Million |
| CAGR | CAGR of 7.37% From 2025 to 2032 |
| Base Year | 2024 |
| Forecast Period | 2025-2032 |
| Historical Data | 2021-2023 |
| Report Scope & Coverage | Market Size, Segments Analysis, Competitive Landscape, Regional Analysis, DROC & SWOT Analysis, Forecast Outlook |
| Key Segments | • By Type (Al2O3, Quartz and Others) • By Application (200mm Semiconductor Equipment, 300mm Semiconductor Equipment and Others) |
| Regional Analysis/Coverage | North America (US, Canada, Mexico), Europe (Germany, France, UK, Italy, Spain, Poland, Turkey, Rest of Europe), Asia Pacific (China, India, Japan, South Korea, Singapore, Australia, Taiwan, Rest of Asia Pacific), Middle East & Africa (UAE, Saudi Arabia, Qatar, South Africa, Rest of Middle East & Africa), Latin America (Brazil, Argentina, Rest of Latin America) |
| Company Profiles | The domes for semiconductor equipment market companies are ASML, Applied Materials, Tokyo Electron, Lam Research, Nikon Corporation, MKS Instruments, Advanced Energy, Murata Manufacturing, Corning Inc., Heraeus, SCHOTT AG, TSMC, Fujifilm. |
Frequently Asked Questions
Asia-Pacific dominated the Domes for Semiconductor Equipment Market in 2024.
The “Al2O3” segment dominated the Domes for Semiconductor Equipment Market.
Rising demand for advanced semiconductor manufacturing and high-purity dome materials like Al2O3 and quartz drives the market.
The Domes for Semiconductor Equipment Market size was valued at USD 199.71 Million in 2024 and is projected to reach USD 352.58 Million by 2032
The Domes for Semiconductor Equipment Market is expected to grow at a CAGR of 7.37% during 2025-2032.
Get in Touch
