Drug Delivery Devices Market Report Scope & Overview:
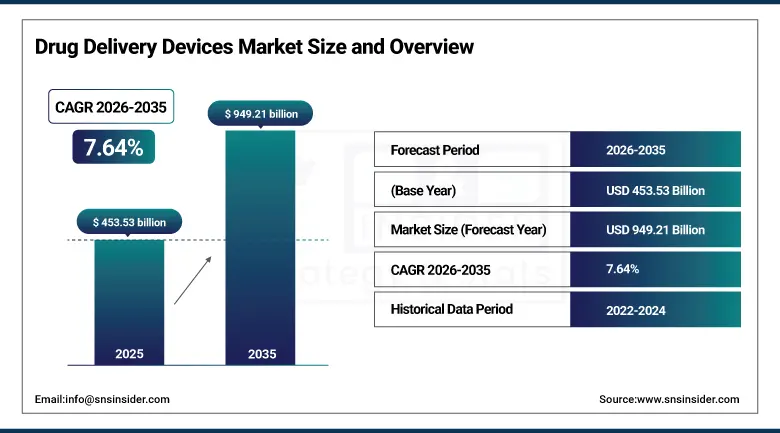
The Drugs Delivery Devices Market was estimated at USD 453.53 Billion in 2025 and is expected to reach USD 949.21 Billion by 2035 and grow at a CAGR of 7.64% over the forecast period of 2026-2035.
The global drug delivery devices market is undergoing a fundamental transformation driven by the convergence of three powerful and mutually reinforcing trends: the extraordinary expansion of biologic and specialty drug pipelines that require sophisticated parenteral, inhaled, and transdermal delivery systems capable of maintaining drug stability, ensuring precise dosing, and enabling patient self-administration outside clinical facility settings; the irreversible patient behaviour shift toward home-based and self-managed therapy driven by the post-pandemic recognition that chronic disease management does not require regular facility visits when appropriately designed devices, connected monitoring tools, and digital health support infrastructure are in place; and the technological leap represented by connected and smart drug delivery devices that integrate dose tracking, patient adherence monitoring, injection technique feedback, and real-world evidence generation into the physical act of drug administration in ways that simultaneously improve patient outcomes, reduce healthcare system costs, and generate proprietary clinical data assets for pharmaceutical manufacturers.
More than 1.2 billion injectable drug administrations were recorded globally in 2025, a volume that reflects both the extraordinary scale of the established insulin, monoclonal antibody, and vaccine injection market and the growth contribution of newer subcutaneous biologic therapies in rheumatology, dermatology, gastroenterology, and oncology that are collectively driving the rapid expansion of the self-injection device market beyond the diabetes-centric foundation on which it was historically built.
Market Size and Forecast
-
Market Size in 2026E: USD 488.16 Billion
-
Market Size by 2035: USD 949.21 Billion
-
CAGR: 7.64% from 2026 to 2035
-
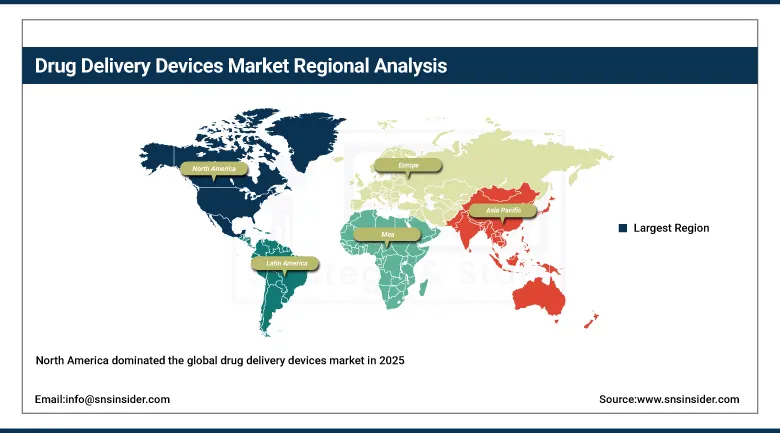
Fastest Growing Region: Asia Pacific
-
Largest Region: North America
To Get more information on Drug Delivery Devices Market - Request Free Sample Report
Drug Delivery Devices Market Trends
- Accelerating development and commercialisation of wearable and on-body injector platforms that enable subcutaneous delivery of large-volume biologic drug formulations over extended injection durations without patient discomfort or technique variation concerns.
-
Growing integration of digital health connectivity into inhaler, injector, and infusion pump devices through Bluetooth, NFC, and cellular communication technologies that enable dose event recording, patient adherence tracking, injection technique assessment.
-
Rising adoption of pre-filled syringe and auto-injector formats across the expanding biologic drug market as pharmaceutical manufacturers standardise their injectable biologic products in ready-to-use, patient-friendly delivery formats.
-
Expanding application of advanced polymer science, microfabrication technology, and nanoparticle drug formulation in transdermal and implantable delivery systems that provide sustained, controlled drug release over days, weeks, or months without the patient compliance requirements of oral daily dosing or the administration burden of regular injections.
-
Growing regulatory and commercial focus on combination product development that integrates drug and device into a single approved, labelled, and marketed product, reflecting the pharmaceutical and device industry’s recognition that the therapeutic value of a drug molecule is inseparable from the quality of the delivery system through which it is administered.
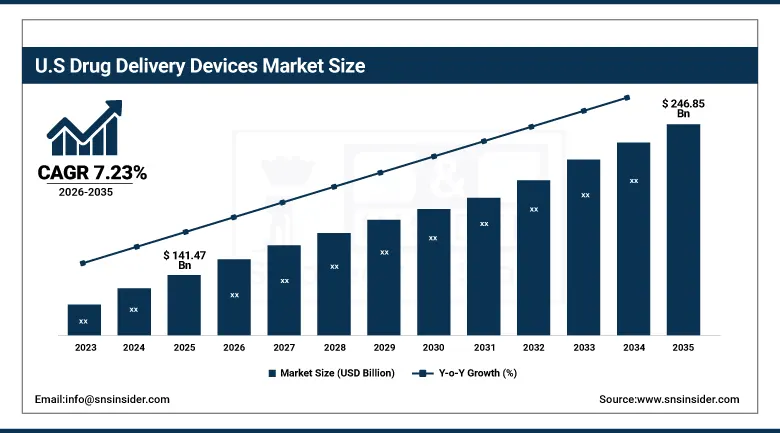
U.S. Drug Delivery Devices Market Outlook
The U.S. Drug Delivery Devices Market was valued at approximately USD 141.47 Billion in 2025 and is expected to reach approximately USD 246.85 Billion by 2035, growing at a CAGR of 7.23%, driven by the world’s largest and most commercially innovative pharmaceutical market that generates constant demand for advanced delivery systems aligned with each new wave of therapeutic innovation, the highest concentration of biologic drug-prescribing specialists, and the most supportive regulatory environment for combination product approval through the FDA’s Office of Combination Products.
The United States drug delivery device market is characterised by the extraordinary scale and commercial sophistication of its three dominant application segments: the diabetes device market anchored by continuous glucose monitoring systems, insulin pen injectors, and insulin pumps serving a diabetic population exceeding 37 million people with growing adoption of closed-loop artificial pancreas systems; the oncology infusion and targeted therapy delivery market serving millions of cancer patients through hospital and ambulatory infusion centre channels with intravenous chemotherapy, monoclonal antibody, and small molecule targeted therapy delivery; and the rapidly expanding self-injection biologic market across immunology indications where auto-injector and pre-filled syringe devices are enabling millions of rheumatoid arthritis, psoriasis, and inflammatory bowel disease patients to self-administer their biologic therapy at home rather than visiting infusion centres for intravenous administration. The FDA’s combination product regulatory pathway provides a defined and relatively predictable route to market for drug-device combination products that aligns device design, biocompatibility, usability engineering, and drug stability requirements within a single regulatory submission framework, creating a competitive advantage for the United States as the primary market where innovative drug delivery combination products are developed, clinically validated, and initially commercialised before seeking international regulatory approvals.
The Inflation Reduction Act’s drug price negotiation authority and its impact on biologic product pricing economics is creating complex incentive effects on pharmaceutical company combination product investment priorities, as any reduction in net drug revenue affects the return on investment calculation for proprietary delivery device development programmes that are justified in part by the extended commercial exclusivity and switching cost advantages they create relative to biosimilar drug-only alternatives that lack the proprietary device platform.
Drug Delivery Devices Market Segment Analysis
-
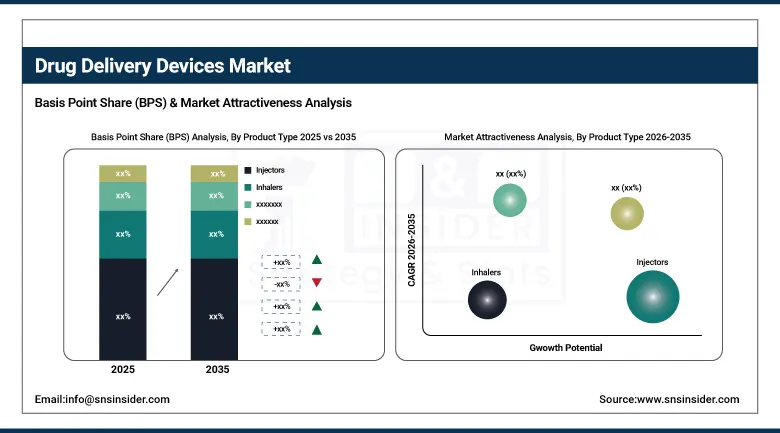
By Product Type, Injectors dominated the Drug Delivery Devices Market with approximately 55.42% revenue share in 2025 owing to widespread adoption of injectable therapies across diabetes, oncology, and cardiovascular disease management; Infusion Pumps are projected to register the fastest CAGR of approximately 8.85% during the forecast period driven by increasing home infusion therapy adoption and wearable pump innovations.
-
By Application, Diabetes accounted for the largest market share of approximately 50.35% in 2025 supported by rising insulin delivery demand and expanding continuous glucose monitoring integration; Oncology is anticipated to witness the fastest growth due to increasing biologics administration, immunotherapy adoption, and rising ambulatory infusion therapy volumes.
-
By End User, Hospitals held the highest revenue share in 2025 due to large-scale inpatient drug administration procedures, advanced infusion infrastructure, and higher surgical volumes; Home Care Settings are expected to grow at the fastest CAGR driven by increasing preference for self-administration devices and expansion of remote patient care models.
-
By Distribution Channel, Direct Sales dominated the market in 2025 owing to strong manufacturer-hospital procurement relationships and large institutional purchasing contracts; Online Platforms are projected to expand at the fastest CAGR supported by rising digital healthcare adoption and increasing demand for home-use drug delivery devices through e-commerce channels.
Injectors dominate, Infusion Pumps expected to grow fastest
Injectors retained the dominant product type position with approximately 55.42% of the drug delivery devices market in 2025, a dominance grounded in the structural reality that injectable drug administration represents the most clinically relied-upon route of delivery across the largest, fastest-growing, and highest-value pharmaceutical market segments globally, with insulin therapy for diabetes, monoclonal antibody biologics for inflammatory diseases and oncology, subcutaneous GLP-1 receptor agonists for diabetes and obesity, and vaccine administration collectively generating injection volumes measured in billions of device uses annually. The auto-injector sub-segment has been the most commercially dynamic component of the injector category, driven by the biologic drug industry’s comprehensive transition toward patient self-injection formats that reduce healthcare system administration burden and improve patient convenience while maintaining the dose precision, drug stability, and bioavailability characteristics required by complex biologic molecules that cannot be reformulated for non-parenteral administration without fundamental changes to their pharmacokinetic and pharmacodynamic profiles. Pre-filled syringes have become the industry-standard primary container and delivery format for a growing proportion of injectable biologic drugs at launch, reflecting pharmaceutical manufacturers’ recognition that integrating drug filling, storage, and administration into a single patient-ready device eliminates the reconstitution and preparation errors that contribute to medication safety incidents with multi-use vial presentations, while providing a physical delivery experience that supports the patient confidence and adherence consistency on which the clinical outcomes of complex biologic therapies depend.
Infusion Pumps are the fastest-growing product type segment at a CAGR of approximately 8.85% through 2035, driven by the expansion of home and ambulatory infusion therapy across oncology, pain management, antibiotic infusion, parenteral nutrition, and immunotherapy indications that is shifting high-volume infusion therapy delivery out of hospital inpatient and ambulatory infusion centre settings into patient homes where programmable wearable and portable infusion pump technologies can maintain the precise, controlled infusion rate delivery that complex drug molecules require. The oncology infusion therapy market represents the largest incremental demand driver for infusion pump growth, as the expanding adoption of intravenous checkpoint inhibitor immunotherapy, antibody-drug conjugate administration, and combination chemotherapy regimens across a growing global cancer patient population generates sustained demand for programmable infusion delivery systems at both healthcare facility and home care settings where infusion therapy volumes are growing faster than facility capacity can absorb them.
Diabetes dominates application, Oncology grows fastest
Diabetes retained the dominant application position with approximately 50.35% of drug delivery devices market revenues in 2025, reflecting the extraordinary breadth and depth of the drug delivery device ecosystem that has developed to serve the world’s over 500 million diabetic patients, encompassing insulin pen injectors and reusable pens from market leaders including Novo Nordisk and Eli Lilly, insulin pump systems from Medtronic, Tandem, and Insulet, continuous glucose monitoring devices from Dexcom and Abbott, and the rapidly growing closed-loop automated insulin delivery segment that integrates continuous glucose monitoring with algorithm-controlled insulin pump delivery to create artificial pancreas systems that substantially reduce the cognitive burden and glucose variability that manual insulin management imposes on patients with type 1 and increasingly type 2 diabetes. The GLP-1 receptor agonist commercial phenomenon has added a massive new device demand category within the diabetes application segment, as semaglutide, tirzepatide, and dulaglutide injection devices in prefilled pen formats have achieved prescription volumes that place them among the highest-volume drug delivery device products ever commercialised, with their expansion into obesity treatment adding tens of millions of additional device users beyond the existing diabetic patient population.
Oncology is the fastest-growing application segment for drug delivery devices through 2035, propelled by the extraordinary expansion of the cancer patient population receiving active systemic therapy, the proliferation of novel targeted therapy and immunotherapy products that require sophisticated infusion delivery infrastructure to administer safely and effectively, and the accelerating development of subcutaneous biologic oncology formulations and implantable local delivery systems that are expanding the drug delivery device market’s oncology application footprint beyond the predominantly intravenous infusion-centric position it occupied historically. The subcutaneous formulation development trend in oncology, exemplified by the subcutaneous administration approvals for trastuzumab, rituximab, and daratumumab that allow these monoclonal antibody therapies to be administered in minutes via subcutaneous injection rather than the hour-long intravenous infusion protocols they replaced, is creating a substantial new auto-injector and pre-filled syringe demand category within oncology that will grow significantly as additional intravenous biologics progress through subcutaneous formulation development programmes.
Regional Insights
|
Region |
Major Country |
Share within Region, 2025 (%) |
|---|---|---|
|
North America |
United States |
87.4% |
|
Europe |
Germany |
22.3% |
|
Asia Pacific |
China |
61.7% |
|
Middle East & Africa |
Saudi Arabia |
38.4% |
|
Latin America |
Brazil |
44.2% |
North America Drug Delivery Devices Market Insights
North America dominated the global drug delivery devices market in 2025, with the United States accounting for approximately 87.4% of North American revenues, driven by the world’s largest pharmaceutical market generating constant demand for innovative drug delivery systems, the highest concentration of biologic drug prescribing specialists, the most supportive regulatory environment for combination product development through the FDA’s Office of Combination Products, and a healthcare reimbursement structure that adequately compensates advanced drug delivery devices. The U.S. market benefits from the co-location of the world’s most productive pharmaceutical and biotechnology research ecosystem with the most commercially sophisticated drug delivery device manufacturing and development sector, creating a product development environment where pharmaceutical companies, contract device manufacturers, materials science innovators, and digital health technology companies collaborate on combination product development programmes with a speed and commercial orientation that no other geography can fully replicate. Canada contributes approximately 12.6% of North American drug delivery device revenues through a universal healthcare system that maintains broad device reimbursement coverage while managing healthcare technology assessment through provincial formulary processes that evaluate combination products for cost-effectiveness alongside clinical innovation assessment.
Get Customized Report as per Your Business Requirement - Enquiry Now
Europe Drug Delivery Devices Market Insights
Europe is a technically sophisticated and commercially important drug delivery device market characterised by harmonised CE marking regulatory pathways under the Medical Device Regulation framework that provide market access across all EU member states, a well-developed contract drug delivery device manufacturing sector concentrated in Germany, Switzerland, and the Nordic countries, and a healthcare system structure where national health insurance coverage of approved drug-device combination products creates reliable reimbursement access for patients across the full spectrum of delivery device categories. Germany accounts for approximately 22.3% of European drug delivery device revenues as the region’s largest national market, anchored by a large pharmaceutical and medical device manufacturing industry that includes global combination product leaders and a statutory health insurance system that provides comprehensive coverage for approved drug delivery devices within the context of their associated drug therapy reimbursement. The EU Medical Device Regulation’s enhanced clinical evidence and post-market surveillance requirements have raised the bar for drug delivery device approval and market maintenance across European markets, creating a quality floor that favours technically sophisticated established device manufacturers while creating compliance cost challenges for smaller device innovators.
Asia Pacific Drug Delivery Devices Market Insights
Asia Pacific is the fastest-growing regional drug delivery devices market, driven by China’s extraordinary pharmaceutical market growth creating massive new device demand, India’s rapid expansion as both a major drug delivery device manufacturing hub and a fast-growing domestic end market, Japan and South Korea’s sophisticated medical technology markets with strong device innovation capabilities, and the healthcare infrastructure build-out across Southeast Asian markets that is creating first-time institutional purchasing of advanced drug delivery systems across newly commissioned hospital networks. China accounts for approximately 61.7% of Asia Pacific drug delivery device revenues and represents the most consequential growth opportunity in global pharmaceutical device markets, as the combination of over 140 million insulin-dependent and insulin-requiring diabetic patients generating the world’s largest national insulin delivery device market, rapidly expanding biologic drug prescribing across oncology, rheumatology, and respiratory indications as domestic biologics and imported innovative therapies gain commercial scale, and growing home care self-injection adoption driven by convenience and cost considerations creates a device demand profile that international and domestic manufacturers are competing intensively to serve. India’s combination of rapidly growing pharmaceutical manufacturing scale, expanding domestic healthcare coverage, and emerging combination product development capability positions it as both the fastest-growing device manufacturing cost base for export market supply and a high-growth domestic end market that will generate substantial drug delivery device demand growth across the forecast period as insurance penetration and specialist physician capacity expand.
Latin America and MEA Drug Delivery Devices Market Insights
Latin America and the Middle East and Africa are growing drug delivery device markets where expanding healthcare coverage, rising chronic disease burden, and pharmaceutical market growth are driving sustained device demand increase across patient populations that were previously limited in access to the advanced delivery systems standard in higher-income markets. Brazil accounts for approximately 44.2% of Latin American drug delivery device revenues through its combination of a large public health system that provides injectable drug administration infrastructure for its extensive diabetes, oncology, and infectious disease treatment programmes and a substantial private insurance sector serving commercially insured patients with access to advanced self-injection device formats and innovative combination products that reach the Brazilian market through the ANVISA regulatory approval process. Saudi Arabia leads Middle East and Africa drug delivery device revenues at approximately 38.4% of the regional total, driven by Vision 2030’s healthcare transformation investment creating new hospital infrastructure equipped with modern infusion, injection, and inhaler device systems, high purchasing power enabling premium combination product adoption, and growing diabetes and oncology patient populations requiring sophisticated delivery system infrastructure to manage their growing therapy complexity.
Growth Drivers: Biologic drug pipeline expansion driving demand for sophisticated parenteral delivery systems, chronic disease burden increasing device-administered therapy volumes, and home care shift enabling self-injection and portable infusion device adoption
The primary structural growth drivers for the Drug Delivery Devices Market are the extraordinary expansion of the injectable biologic drug pipeline across oncology, immunology, neurology, and rare disease therapeutic areas that is generating constant demand for increasingly sophisticated injector, infusion pump, and wearable delivery platform development, combined with the demographic inevitability of rising chronic disease patient populations across diabetes, respiratory disease, cardiovascular disease, and cancer that are growing the device-administered therapy population at rates that consistently outpace broader healthcare market growth. The biopharmaceutical industry’s structural shift toward large molecule biologic therapies that require parenteral administration is the most powerful and durable device market demand driver, as every new biologic approval brings mandatory device co-development requirements that create sustained capital investment in prefilled syringe manufacturing, auto-injector engineering, and combination product regulatory development across the global pharmaceutical manufacturing ecosystem. The parallel expansion of the home care therapy market, enabled by improved device usability engineering, telehealth monitoring integration, and changing payer reimbursement frameworks that recognise home-based infusion and injection therapy’s cost advantages over facility-based administration, is expanding the total device-administered therapy market well beyond the institutional healthcare facility channel that historically dominated commercial drug delivery device revenues.
Restraints: Combination product regulatory complexity extending development timelines, device recall risk from manufacturing quality failures, and price sensitivity in emerging market healthcare systems limiting adoption of premium delivery platforms
A significant restraint on the Drug Delivery Devices Market is the regulatory complexity and extended development timelines associated with combination product approval, where the integration of drug and device into a single regulated product requires parallel demonstration of drug clinical efficacy, device biocompatibility, usability engineering validation, and container closure integrity within a single regulatory submission that must satisfy both pharmaceutical and medical device regulatory standards simultaneously, creating development programmes whose cost and duration substantially exceed standalone drug or device development and introduce combination-specific failure modes that can delay commercialisation well beyond individual component development timelines. Device recall risk from manufacturing quality failures, including dosing accuracy non-conformances, needle safety mechanism failures, and container closure integrity defects, represents an ongoing commercial and regulatory risk for drug delivery device manufacturers whose quality systems must simultaneously manage pharmaceutical grade sterility requirements and precision medical device manufacturing tolerances within integrated manufacturing operations that combine competencies historically maintained in separate industry sectors.
Opportunities: Smart and connected device development creating data asset and adherence improvement value propositions, wearable large-volume injector platform expansion enabling subcutaneous delivery of high-concentration biologic drugs, and emerging market healthcare infrastructure investment creating first-time institutional device purchasing demand
The connected drug delivery device market represents the most commercially dynamic development opportunity in the sector, as the integration of dose sensing, adherence tracking, and patient engagement functionality into inhaler, injector, and infusion pump devices creates value propositions that extend beyond the physical drug administration function to encompass the clinical data generation, adherence optimisation, and real-world evidence collection capabilities that pharmaceutical companies, payers, and health systems increasingly value as independent assets that complement the pharmacological value of the drugs being delivered. Wearable large-volume subcutaneous injector platforms represent a structurally important market expansion opportunity as the growing number of high-concentration, large-volume biologic drug formulations that require extended subcutaneous infusion for adequate absorption create demand for on-body wearable injector devices that can deliver 1 to 20 millilitre subcutaneous doses over injection durations of minutes to hours while maintaining patient comfort and enabling the home setting administration that both patients and payers prefer over facility-based intravenous infusion alternatives.
Recent Developments:
-
2025: Becton Dickinson announced the strategic separation of its BioPharma Systems business unit, focusing exclusively on biologic drug delivery device development for pharmaceutical industry partners, with particular emphasis on enabling GLP-1 and other biologic self-injection transitions and expanding prefilled syringe and wearable injection system manufacturing capacity globally.
-
2025: Medtronic launched a new generation of wearable drug delivery devices designed for chronic disease management outside traditional healthcare facility settings, incorporating advanced connectivity features for remote clinical monitoring, automated dose tracking, and integration with patient engagement platforms supporting adherence in complex multi-drug therapy regimens.
-
2025: AbbVie announced a strategic partnership with a leading technology platform provider to develop next-generation AI-powered drug delivery systems that incorporate personalised dosing algorithms and connected adherence monitoring into auto-injector platforms designed for its biologic immunology portfolio.
-
2025: Baxter International expanded its infusion pump software platform with enhanced connectivity features and AI-driven drug library management tools designed to reduce intravenous medication errors and improve clinical workflow efficiency across hospital pharmacy and bedside drug administration processes in its global installed base of smart infusion systems.
-
2025: Gerresheimer AG expanded its prefilled syringe manufacturing capacity in the United States and Europe through capital investment programmes responding to growing pharmaceutical industry demand for high-quality primary packaging and drug delivery systems for the expanding biologic and specialty drug pipeline reaching commercial launch stages.
Drug Delivery Devices Market Key Players
-
Becton, Dickinson and Company
-
Medtronic plc
-
Baxter International Inc.
-
Johnson & Johnson
-
Abbott Laboratories
-
Novartis AG
-
AbbVie Inc.
-
Roche Holding AG
-
GlaxoSmithKline plc
-
AptarGroup, Inc.
-
Gerresheimer AG
-
Owen Mumford Limited
-
Kindeva Drug Delivery L.P.
-
Enable Injections, Inc.
-
Credence MedSystems, Inc.
-
3M Company
-
Bayer AG
-
Insulet Corporation
-
Tandem Diabetes Care
-
Dexcom, Inc.
Drug Delivery Devices Market Report Scope:
| Report Attributes | Details |
|---|---|
| Market Size in 2025 | USD 453,53 Billion |
| Market Size by 2035 | USD 949.21 Billion |
| CAGR | CAGR of 7.64% From 2026 to 2035 |
| Base Year | 2025 |
| Forecast Period | 2026-2035 |
| Historical Data | 2022-2024 |
| Report Scope & Coverage | Market Size, Segments Analysis, Competitive Landscape, Regional Analysis, DROC & SWOT Analysis, Forecast Outlook |
| Key Segments | • By Product Type (Injectors, Inhalers, Infusion Pumps, Transdermal Patches, Others) • By Application (Diabetes, Oncology, Cardiovascular Diseases, Respiratory Diseases, Others) • By End User (Hospitals, Home Care Settings, Specialty Centers, Others) • By Distribution Channel (Direct Sales, Distributor Networks, Online Platforms) |
| Regional Analysis/Coverage | North America (US, Canada, Mexico), Europe (Eastern Europe [Poland, Romania, Hungary, Turkey, Rest of Eastern Europe] Western Europe] Germany, France, UK, Italy, Spain, Netherlands, Switzerland, Austria, Rest of Western Europe]), Asia Pacific (China, India, Japan, South Korea, Vietnam, Singapore, Australia, Rest of Asia Pacific), Middle East & Africa (Middle East [UAE, Egypt, Saudi Arabia, Qatar, Rest of Middle East], Africa [Nigeria, South Africa, Rest of Africa], Latin America (Brazil, Argentina, Colombia, Rest of Latin America) |
| Company Profiles | Becton, Dickinson and Company, Medtronic plc, Baxter International Inc., Johnson & Johnson, Abbott Laboratories, Novartis AG, AbbVie Inc., Roche Holding AG, GlaxoSmithKline plc, AptarGroup, Inc., Gerresheimer AG, Owen Mumford Limited, Kindeva Drug Delivery L.P., Enable Injections, Inc., Credence MedSystems, Inc., 3M Company, Bayer AG, Insulet Corporation, Tandem Diabetes Care, Dexcom, Inc. |
Frequently Asked Questions
The Drug Delivery Devices Market is expected to grow at a CAGR of 7.64% from 2026 to 2035.
The Drug Delivery Devices Market was valued at USD 453.53 Billion in 2025.
Ans: The extraordinary expansion of the injectable biologic drug pipeline across oncology, immunology, and chronic disease indications driving constant demand for sophisticated parenteral delivery system development, combined with the structural shift toward home care self-administration and the adoption of smart connected device technologies.
Injectors dominated with approximately 55.42% revenue share in 2025.
North America dominated the Drug Delivery Devices Market in 2025, with the United States as the leading national market within the region.
Get in Touch
