Electric Vehicle Adhesives Market Report Scope & Overview:
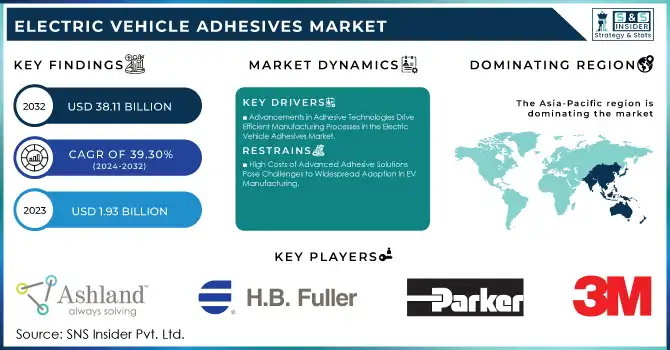
The Electric Vehicle Adhesives Market Size was valued at USD 1.93 billion in 2023 and is expected to reach USD 38.11 billion by 2032 and grow at a CAGR of 39.30% over the forecast period 2024-2032.
The Electric Vehicle (EV) Adhesives Market is witnessing significant growth, driven by the increasing demand for lightweight materials in EVs to enhance energy efficiency. Adhesives are critical for joining dissimilar materials, ensuring structural integrity, and improving thermal management in battery systems. This dynamic market is characterized by advancements in adhesive formulations to cater to the evolving needs of EV manufacturers. Factors such as the push for sustainable solutions, improved performance in extreme conditions, and compatibility with automated production processes are driving innovation. For instance, Henkel introduced a thermally conductive injectable adhesive in May 2023 to address thermal management challenges in EV battery systems. Similarly, Bostik showcased its advanced adhesive solutions at the India Battery Show in October 2023, underlining the industry's commitment to developing products tailored to battery assembly and durability.
Electric Vehicle Adhesives Market Size and Forecast:
-
Market Size in 2023: USD 1.93 billion
-
Market Size by 2032: USD 38.11 billion
-
CAGR: 39.30% from 2024 to 2032
-
Base Year: 2023
-
Forecast Period: 2024–2032
-
Historical Data: 2020–2022
Get more information on Electric Vehicle Adhesives Market - Request Sample Report
Leading companies are taking strides to expand production capacities and innovate to meet demand. In May 2024, Dow commenced operations at its new adhesive and gap filler production line in Ahlen, Germany, enhancing its capability to serve the European EV market. H.B. Fuller, in the same month, strengthened its product portfolio by acquiring ND Industries, focusing on specialty adhesives critical for automotive applications. By October 2024, LG Chem introduced high-performance adhesive solutions, aligning with the industry's focus on lightweighting and environmental sustainability. Additionally, DuPont’s Megum W series has been pivotal in advancing sustainable adhesive solutions for automotive mobility. February 2025 witnessed growing interest in advanced additives for EV adhesives and sealants, as reflected in trends towards developing eco-friendly and high-performance materials to support electrification efforts globally. These developments underscore the rapid technological evolution and strategic expansions shaping the EV adhesives market.
Electric Vehicle Adhesives Market Trends
-
Rapid growth in global electric vehicle production is significantly increasing demand for structural, battery bonding, and lightweight adhesives across passenger and commercial EV segments.
-
Increasing focus on lightweight vehicle design to improve battery efficiency and driving range is accelerating the replacement of mechanical fasteners with high-performance adhesive solutions.
-
Advancements in battery technology, including improved thermal management systems and battery pack designs, are driving demand for specialized adhesives with enhanced heat resistance and electrical insulation properties.
-
Growing adoption of epoxy, polyurethane, silicone, and acrylic-based adhesives is enabling stronger bonding, vibration resistance, and durability in EV assembly.
-
Stringent government regulations promoting zero-emission vehicles and carbon reduction initiatives are indirectly fueling the EV adhesives market through increased EV manufacturing incentives and subsidies.
-
Rising investments and partnerships between automotive OEMs, battery manufacturers, and adhesive suppliers are accelerating innovation in next-generation bonding technologies.
-
Emerging trends in automation and smart manufacturing are supporting precision adhesive application processes, improving production efficiency and quality control in EV assembly plants.
Electric Vehicle Adhesives Market Drivers
-
Advancements in Adhesive Technologies Drive Efficient Manufacturing Processes in the Electric Vehicle Adhesives Market
Advancements in adhesive technologies are revolutionizing manufacturing processes in the electric vehicle market. Adhesives provide an efficient solution for bonding dissimilar materials, such as metals, composites, and plastics, which are integral to the lightweight designs of modern EVs. By eliminating the need for traditional fasteners and welds, adhesives contribute to significant weight reductions, leading to improved energy efficiency and vehicle performance. Additionally, advanced adhesives offer enhanced durability and resistance to environmental factors, ensuring longer vehicle life cycles. These technologies also align with automation trends, enabling faster and more precise assembly processes. For instance, automated adhesive dispensing systems are streamlining production lines and reducing labor-intensive practices. The continuous development of thermally conductive adhesives further highlights their critical role in battery thermal management, a key factor in ensuring safety and operational efficiency. As manufacturers seek to meet stringent performance and regulatory requirements, adhesive technologies are becoming indispensable, driving their demand in the EV industry.
-
Increasing Consumer Demand for Electric Vehicles Accelerates the Growth of Adhesives in Automotive Applications
-
Stringent Regulations Promoting Lightweight Materials Propel the Demand for Advanced Adhesives in EV Manufacturing
Stringent regulations aimed at reducing carbon emissions and improving fuel efficiency are driving the demand for advanced adhesives in EV manufacturing. Governments worldwide are mandating the use of lightweight materials to minimize environmental impact, prompting automakers to replace traditional bonding methods with adhesives. Adhesives enable the use of lightweight substrates like aluminum and composites, which are essential for meeting regulatory requirements. Furthermore, their ability to distribute stress evenly across bonded surfaces enhances vehicle durability and crash safety. Regulatory frameworks, particularly in regions like Europe and North America, are fostering innovations in adhesive technologies that align with sustainability goals. For instance, low-VOC (volatile organic compound) adhesives are gaining traction due to their environmental compliance and superior performance. These regulations not only encourage adhesive adoption but also drive manufacturers to invest in research and development, resulting in advanced products that cater to evolving industry needs.
Electric Vehicle Adhesives Market Restraint:
-
High Costs of Advanced Adhesive Solutions Pose Challenges to Widespread Adoption in EV Manufacturing
Electric Vehicle Adhesives Market Opportunity:
-
Expansion of EV Infrastructure Creates New Opportunities for Adhesives in Charging Stations and Components
-
Growing Focus on Sustainability Drives Demand for Eco-Friendly Adhesives in the EV Market
The growing emphasis on sustainability in the automotive industry presents a significant opportunity for eco-friendly adhesives in EV manufacturing. With increasing regulatory pressure and consumer awareness, manufacturers are shifting toward materials that minimize environmental impact. Eco-friendly adhesives, often made from renewable resources or featuring recyclable properties, are gaining traction as a sustainable alternative to conventional bonding methods. These adhesives not only reduce the carbon footprint of EV production but also align with global sustainability goals, enhancing their appeal to environmentally conscious consumers. Adhesive producers are investing in research and development to create products that meet performance requirements while adhering to stringent environmental standards. This focus on sustainability is unlocking new opportunities in the market, particularly among automakers looking to enhance their green credentials.
Consumer and Market Sentiment Analysis for Electric Vehicle Adhesives Market
|
Aspect |
Sentiment/Findings |
|
Consumer Awareness of Adhesive Technologies |
Consumers are increasingly aware of the role of adhesives in enhancing EV performance and sustainability. |
|
Perception of Sustainability in Adhesive Solutions |
There is a growing demand for adhesives with low environmental impact, influencing market decisions. |
|
Consumer Preferences for Lightweight EV Components |
Consumers prioritize lightweight components for better vehicle efficiency, which adhesives can provide. |
|
Impact of Safety Standards on Adhesive Adoption |
Strict safety standards have led to an increased reliance on adhesives in EV manufacturing for better structural integrity. |
|
Willingness to Pay for Eco-friendly Adhesives |
Consumers show a willingness to pay a premium for eco-friendly adhesives, especially in regions with strong environmental consciousness. |
The consumer sentiment in the Electric Vehicle Adhesives Market is increasingly shaped by awareness of sustainability, safety, and the demand for lightweight components. There is a growing recognition of the importance of adhesive technologies in enhancing EV performance, especially in terms of durability and energy efficiency. Consumers also show strong preferences for eco-friendly adhesive solutions, which not only align with environmental concerns but also meet stricter safety standards required in electric vehicle manufacturing. Furthermore, the willingness to pay for premium eco-friendly adhesives highlights the evolving consumer mindset towards sustainable and efficient materials in EV production.
Electric Vehicle Adhesives Market Segments
By Resin Type
In 2023, the epoxy resin segment dominated the Electric Vehicle Adhesives Market with a market share of 38%. Epoxy adhesives are particularly valued in the automotive industry for their exceptional mechanical strength, durability, and excellent adhesion properties across a variety of substrates. Their ability to withstand harsh environmental conditions, including temperature variations and exposure to chemicals, makes them highly suitable for critical applications in electric vehicles. For instance, epoxy adhesives are commonly used in battery assembly and structural bonding, ensuring that components remain secure and intact during operation. Leading manufacturers, such as Henkel and 3M, have developed innovative epoxy formulations that not only meet the performance requirements of modern electric vehicles but also address specific industry needs, such as low VOC emissions and improved processing times. These advancements have solidified epoxy's position as the preferred choice among OEMs and suppliers, contributing significantly to its market dominance. As the electric vehicle market continues to expand, the demand for reliable, high-performance adhesive solutions like epoxies is expected to grow, further enhancing their critical role in vehicle assembly.
By Vehicle Type
In 2023, the Battery Electric Vehicle (BEV) segment dominated the Electric Vehicle Adhesives Market with a market share of 55%. The growing production and adoption of BEVs are significantly driven by the global transition towards sustainable and eco-friendly transportation solutions. This surge in demand for electric vehicles has heightened the need for specialized adhesives that can effectively bond critical components such as battery packs, body panels, and interior elements. For instance, leading manufacturers like Tesla and Nissan prioritize the use of advanced adhesives to ensure the integrity and safety of their battery systems, which are vital for overall vehicle performance. These adhesives not only enhance structural stability but also contribute to energy efficiency by reducing overall vehicle weight. Additionally, the innovation of adhesive technologies that cater specifically to BEVs, such as thermally conductive adhesives, showcases the industry's commitment to improving vehicle safety and efficiency. As the market for BEVs continues to grow, the demand for effective adhesive solutions that meet the unique challenges of electric vehicle manufacturing is anticipated to increase, further solidifying the dominance of this segment.
By Substrate
In 2023, the composite substrate segment dominated the Electric Vehicle Adhesives Market with a market share of 40%. Composites are increasingly preferred in the automotive sector due to their lightweight yet strong properties, which significantly enhance the performance and efficiency of electric vehicles. The use of composite materials helps in reducing overall vehicle weight, thereby improving energy consumption and extending the driving range of electric vehicles. Adhesives formulated specifically for composites provide excellent bonding capabilities essential for structural components and body panels. Manufacturers like DuPont and H.B. Fuller have developed specialized adhesive solutions that cater to the unique challenges presented by composite materials, such as differing thermal expansion rates and surface preparation needs. These advancements in adhesive technology ensure that the bonds formed are not only robust but also withstand the stresses encountered in various operating conditions. As electric vehicle manufacturers increasingly focus on utilizing lightweight materials to meet performance goals and regulatory requirements, the demand for effective adhesive solutions for composite substrates is projected to continue growing, reinforcing the segment's leading position.
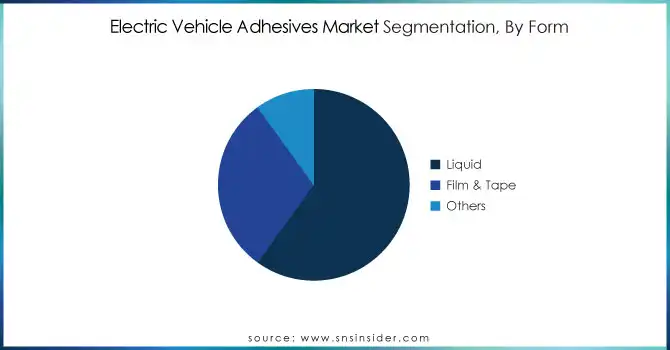
By Form
In 2023, the liquid form segment dominated the Electric Vehicle Adhesives Market, capturing a market share of 60%. Liquid adhesives are widely utilized across the automotive industry for their versatility and ease of application, making them an ideal choice for a variety of assembly processes. Their ability to penetrate and bond effectively with different substrates allows manufacturers to achieve strong and durable joints in electric vehicles. Brands like Sika and 3M have introduced liquid adhesive formulations that cater to the specific needs of electric vehicle assembly, including fast curing times, improved flow characteristics, and strong adhesion to various materials such as metals, plastics, and composites. Additionally, liquid adhesives often have lower application costs compared to other forms, such as films and tapes, making them more attractive to manufacturers looking to optimize production efficiency. As the electric vehicle market expands, the demand for liquid adhesives that meet stringent performance and environmental standards is expected to rise, further solidifying their position as the leading form of adhesive used in the industry.
By Application
In 2023, the powertrain system segment dominated the Electric Vehicle Adhesives Market, with a market share of 30%. Adhesives used in powertrain systems are crucial for ensuring the secure assembly of various components, including electric motors, battery systems, and drivetrains, where reliability and performance are paramount. The demand for high-performance adhesives that can withstand extreme temperatures and mechanical stress has led to innovations in adhesive formulations specifically designed for powertrain applications. Leading manufacturers such as Henkel and Lord Corporation have developed specialized adhesive solutions that address the unique challenges of bonding in powertrain systems, ensuring strong and durable connections that enhance the overall performance and safety of electric vehicles. These adhesives not only facilitate the assembly process but also contribute to the efficiency and longevity of the powertrain, making them a critical component in electric vehicle design. As the electric vehicle market continues to grow, the need for reliable adhesive solutions in powertrain systems is expected to increase, further reinforcing the significance of this application segment.
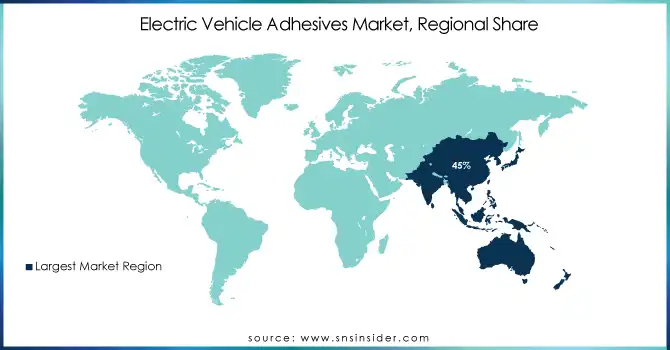
Electric Vehicle Adhesives Market Regional Analysis
In 2023, Asia-Pacific dominated the Electric Vehicle Adhesives Market with a market share of 45%. The region’s dominance is primarily driven by the rapid growth of the electric vehicle (EV) industry, particularly in countries like China, Japan, and South Korea. China remains the largest market for electric vehicles, with EV sales surpassing 6.9 million units in 2022, representing over 50% of global EV sales. This surge in demand has significantly boosted the need for specialized adhesives used in battery systems, powertrain assembly, and vehicle body parts. Japan and South Korea also contribute heavily to the market due to the presence of major automotive manufacturers like Toyota, Honda, Hyundai, and Kia, who are increasingly adopting advanced adhesive solutions to enhance the performance and safety of their EVs. Additionally, key adhesive manufacturers such as Henkel, 3M, and Dow are focusing on expanding their production capacities in these countries to cater to the growing demand from the EV sector. The Asia-Pacific region’s strong foothold in electric vehicle manufacturing and its ability to innovate in adhesive technologies solidify its dominant position in the market.
Moreover, in 2023, Europe emerged as the fastest-growing region in the Electric Vehicle Adhesives Market, with a CAGR of 20%. The continent is experiencing a rapid transition to electric vehicles, driven by stringent government regulations and strong consumer demand for cleaner transportation solutions. Countries like Germany, France, and the United Kingdom are leading the shift, with EV sales in Germany reaching over 1 million units in 2022, a 15% increase compared to the previous year. This growth is supported by the European Union's aggressive environmental targets, which aim to have at least 30 million electric vehicles on the road by 2030. The demand for electric vehicles in Europe has consequently raised the need for high-performance adhesives, especially in powertrain systems, battery assembly, and body construction, where adhesive solutions are critical for ensuring safety, efficiency, and weight reduction. Major automotive players in the region, such as Volkswagen, BMW, and Renault, are also investing heavily in EV production and, in turn, increasing their reliance on advanced adhesives to meet the specific requirements of electric vehicles. The growing adoption of adhesive technologies by these manufacturers is expected to continue driving market growth in Europe, positioning the region as the fastest-growing in the global Electric Vehicle Adhesives Market.
Get Customized Report as per your Business Requirement - Request For Customized Report
Electric Vehicle Adhesives Market Key Players
-
3M (3M Scotch-Weld Epoxy Adhesive DP420, 3M DP8810NS Structural Adhesive)
-
Ashland Inc. (AquaPolymers, Hexion EPON Resin)
-
DAP Global Inc. (DAP 3.0 Sealant, DAP Premium Clear Sealant)
-
H.B. Fuller (FullerBond 2168, FullHPR 2101)
-
Henkel AG & Co. KGaA (Loctite EA 3472, Loctite 9460)
-
Illinois Tool Works Inc. (ITW Devcon 5 Minute Epoxy, ITW Plexus MA300)
-
Kingspan Group (Kingspan Tarec Adhesive, Kingspan SF100)
-
LOCTITE (part of Henkel AG & Co. KGaA) (Loctite 406, Loctite EA 3478)
-
Paroc Group (Paroc XPS Sealant, Paroc Firestop Systems)
-
Parker Hannifin Corporation (Parker LORD 201, Parker LORD 200)
-
Permabond (Permabond ET500, Permabond A136)
-
PPG Industries, Inc. (PPG Lamineer 8150, PPG ULTRA-STRIKE adhesive)
-
Sika AG (SikaPower 4720, Sikaflex-221)
-
Specialty Polymer Co. (SPC-SS-GD, SPC-HS-300)
-
Sherwin-Williams Company (Sherwin-Williams 3M Adhesives, Sherwin-Williams 10-300)
-
Texwipe (part of ITW) (Texwipe DuraClean Adhesive, Texwipe CleanSeal)
-
The Dow Chemical Company (Dowsil 732 Sealant, Dow Adhesive D-521)
-
Trelleborg AB (Trelleborg Engineering Adhesives, Trelleborg Sealing Solutions)
-
Wacker Chemie AG (Wacker Elastosil, Wacker SilGel)
-
Weicon GmbH & Co. KG (Weicon Sealant, Weicon Bond 300)
Automotive OEMs (Original Equipment Manufacturers)
- Tesla
- BMW Group
- Volkswagen Group
- Ford Motor Company
- General Motors
- Rivian
- Lucid Motors
- BYD Auto
Sealant and Coating Providers
- Sika AG
- Henkel AG & Co. KGaA
- 3M
- PPG Industries, Inc.
- Permabond
- H.B. Fuller
- Bostik
- Dow
Automotive Aftermarket Suppliers
- AutoZone
- O'Reilly Auto Parts
- Advance Auto Parts
- NAPA Auto Parts
- Carquest Auto Parts
- Federated Auto Parts
- Pep Boys
- Midas
Recent Developments
-
May 2024: H.B. Fuller expanded its specialty solutions portfolio by acquiring ND Industries, strengthening its position as a leader in adhesives. ND Industries brought expertise in fastener locking and sealing solutions for automotive, electronics, and aerospace applications.
-
September 2023: H.B. Fuller showcased its innovative packaging solutions at PACK EXPO Las Vegas, focusing on efficiency and sustainability. The event highlighted its technology platform designed to support sustainable and streamlined packaging for brands and manufacturers.
-
February 2024: Henkel established its first innovation and technology center in Latin America, located in Jundiaí, São Paulo. The center aimed to drive collaboration, develop advanced adhesive solutions, and serve as a hub for training and customer interaction in the region.
| Report Attributes | Details |
|---|---|
| Market Size in 2023 | US$ 1.93 Billion |
| Market Size by 2032 | US$ 38.11 Billion |
| CAGR | CAGR of 39.30% From 2024 to 2032 |
| Base Year | 2023 |
| Forecast Period | 2024-2032 |
| Historical Data | 2020-2022 |
| Report Scope & Coverage | Market Size, Segments Analysis, Competitive Landscape, Regional Analysis, DROC & SWOT Analysis, Forecast Outlook |
| Key Segments | •By Resin Type (Epoxy, Polyurethane, Silicone, Acrylic, Others) •By Vehicle Type (Battery Electric Vehicle (BEV), Plug-in Hybrid Electric Vehicle (PHEV), Hybrid Electric Vehicle (HEV)) •By Substrate (Plastic, Composite, Metals, Others) •By Form (Liquid, Film & Tape, Others) •By Application (Powertrain System, Optical Element, Sensors & Communication, Body Frame, Others) |
| Regional Analysis/Coverage | North America (US, Canada, Mexico), Europe (Eastern Europe [Poland, Romania, Hungary, Turkey, Rest of Eastern Europe] Western Europe] Germany, France, UK, Italy, Spain, Netherlands, Switzerland, Austria, Rest of Western Europe]), Asia Pacific (China, India, Japan, South Korea, Vietnam, Singapore, Australia, Rest of Asia Pacific), Middle East & Africa (Middle East [UAE, Egypt, Saudi Arabia, Qatar, Rest of Middle East], Africa [Nigeria, South Africa, Rest of Africa], Latin America (Brazil, Argentina, Colombia, Rest of Latin America) |
| Company Profiles | Henkel AG & Co. KGaA, Illinois Tool Works Inc., H.B. Fuller, Parker Hannifin Corporation, Sika AG, 3M, Ashland Inc., Wacker Chemie AG, Kingspan Group, Permabond, Paroc Group, DAP Global Inc., PPG Industries, Inc. and other key players |
| Key Drivers | •Increasing Consumer Demand for Electric Vehicles Accelerates the Growth of Adhesives in Automotive Applications •Stringent Regulations Promoting Lightweight Materials Propel the Demand for Advanced Adhesives in EV Manufacturing |
| Restraints | •High Costs of Advanced Adhesive Solutions Pose Challenges to Widespread Adoption in EV Manufacturing |
Frequently Asked Questions
Ans: Asia-Pacific dominated the Electric Vehicle Adhesives Market with a 45% share, driven by the rapid growth of the EV industry in China, Japan, and South Korea, and supported by major manufacturers expanding production to meet the rising demand for specialized adhesives.
Ans: The adoption of adhesive applications in emerging EV markets is constrained by a lack of awareness and expertise, leading to a continued reliance on traditional bonding methods and insufficient technical proficiency.
Ans: The growing emphasis on sustainability, expansion of EV infrastructure, and rising demand for custom adhesive solutions are driving market growth in the Electric Vehicle Adhesives sector.
Ans: The Electric Vehicle Adhesives Market Size was valued at USD 1.93 billion in 2023 and is expected to reach USD 38.11 billion by 2032
Ans: The Electric Vehicle Adhesives Market is expected to grow at a CAGR of 39.3%
Get in Touch
