Filled Fluoropolymer Market Report Scope & Overview:
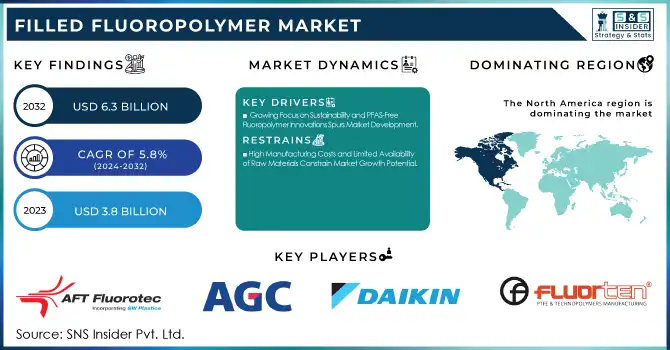
The Filled Fluoropolymer Market Size was valued at USD 3.8 billion in 2023 and is expected to reach USD 6.3 billion by 2032 and grow at a CAGR of 5.8% over the forecast period 2024-2032.
Get More Information on Filled Fluoropolymer Market - Request Sample Report
The Filled Fluoropolymer market has been gaining momentum due to its superior properties such as high chemical resistance, excellent thermal stability, and remarkable electrical insulation. These attributes have expanded its adoption in industries including automotive, electronics, and chemical processing. The market is also driven by the growing demand for lightweight and durable materials to enhance performance and efficiency in critical applications. In addition, environmental concerns have catalyzed the development of sustainable and advanced processing technologies. For instance, in March 2020, Inhance Technologies introduced a commercial process to eliminate PFAS from fluoropolymers, addressing regulatory pressures and aligning with global sustainability goals. Such initiatives reflect the evolving priorities in the market toward eco-friendly innovations.
The competitive landscape of the market is shaped by ongoing advancements and product launches. In July 2024, Alfa Chemistry expanded its product portfolio with advanced fluoropolymers, targeting diverse applications that require enhanced functionality and versatility. Similarly, AGC Inc. announced in August 2024 the establishment of a new production facility in Thailand to enhance its fluorochemical production capabilities. These developments highlight a robust focus on capacity expansion and technological enhancement to meet escalating demand. The dynamic interplay of innovation, environmental considerations, and strategic investments continues to redefine the market trajectory, making it a key area of growth for industry players.
Filled Fluoropolymer Market Dynamics:
Drivers:
-
Growing Focus on Sustainability and PFAS-Free Fluoropolymer Innovations Spurs Market Development
Environmental concerns and tightening regulations have pushed manufacturers toward the development of eco-friendly and PFAS-free fluoropolymers. Traditional fluoropolymers, while known for their high performance, have been associated with the release of harmful per- and polyfluoroalkyl substances (PFAS) during production and disposal, raising environmental and health concerns. To address this, manufacturers are investing in research to develop sustainable alternatives that maintain the chemical resistance, thermal stability, and durability of traditional fluoropolymers without the associated environmental risks. Recent innovations include the commercialization of fluoropolymer production technologies that eliminate PFAS byproducts, ensuring compliance with global environmental regulations. For example, companies have introduced proprietary processes to eliminate PFAS during the synthesis phase, making their products suitable for environmentally conscious applications. Such efforts not only align with regulatory mandates but also cater to consumer preferences for sustainable materials in industries like automotive, construction, and electronics. As more companies adopt PFAS-free innovations, they not only mitigate risks but also unlock new market opportunities, ensuring that the transition toward sustainability becomes a growth driver for the filled fluoropolymer market.
-
Rising Investments in Infrastructure Development and Industrial Applications Propel Demand for Filled Fluoropolymers
Restraint:
-
High Manufacturing Costs and Limited Availability of Raw Materials Constrain Market Growth Potential
The production of filled fluoropolymers involves advanced manufacturing techniques and the use of specialized raw materials, resulting in high production costs. Fluorite, a primary input in the production of fluoropolymers, is geographically concentrated, with a limited number of countries dominating its supply. This dependency on a restricted supply chain increases the risk of price volatility and supply shortages, further escalating production costs. Moreover, the need for advanced technologies to process these materials, such as extrusion and compounding with fillers, adds to the expenses. These costs are often transferred to end consumers, limiting the adoption of filled fluoropolymers, especially in price-sensitive markets. Small and medium-sized manufacturers face additional challenges in competing with established players due to the high capital investment required for production and R&D. While innovations aimed at reducing manufacturing costs and improving resource efficiency are underway, the persistent challenges related to raw material availability and cost management remain significant barriers to market growth.
Opportunity:
-
Advancements in Additive Manufacturing and 3D Printing Technologies Open New Avenues for Customized Applications
-
Growing Demand for Renewable Energy and Sustainable Technologies Enhances Market Opportunities
The transition toward renewable energy and sustainable technologies is creating lucrative opportunities for the filled fluoropolymer market. Solar panels, wind turbines, and energy storage systems rely on materials that can withstand harsh environmental conditions and ensure long-term performance. Filled fluoropolymers, known for their chemical resistance, thermal stability, and electrical insulation properties, are increasingly being utilized in these applications. For instance, they are used in the protective coatings of solar modules, electrical connectors in wind turbines, and insulation for battery components in energy storage systems. Additionally, the push for energy-efficient buildings has spurred demand for durable materials in HVAC systems and insulation solutions, where filled fluoropolymers excel. With governments and industries focusing on carbon neutrality and sustainable energy solutions, the adoption of high-performance materials that align with these goals is anticipated to grow, positioning the filled fluoropolymer market for robust expansion.
Challenge:
-
Stringent Regulatory Standards and Environmental Concerns Pose Barriers to Market Expansion
The filled fluoropolymer market faces significant challenges from stringent regulatory standards and growing environmental concerns. Fluoropolymer manufacturing often involves the use of hazardous chemicals and results in the emission of fluorinated gases, which have been linked to environmental pollution and health risks. Regulatory agencies worldwide are imposing strict guidelines to reduce emissions and eliminate the use of per- and polyfluoroalkyl substances (PFAS), which are commonly associated with traditional fluoropolymers. Complying with these regulations requires substantial investment in research, development, and process modifications, which can be cost-prohibitive for smaller manufacturers. Furthermore, public awareness of the environmental impact of fluoropolymer production has led to increased scrutiny, pressuring companies to adopt sustainable practices. While some manufacturers have made strides in developing PFAS-free alternatives and implementing eco-friendly processes, these transitions are time-consuming and resource-intensive, potentially limiting the market’s growth in the short term.
Consumer Purchase Behavior: Key Factors Driving Demand in the Filled Fluoropolymer Market
|
Consumer Behavior/Purchase Driver |
Description |
|
Product Performance and Durability |
Consumers prioritize materials that offer long-lasting performance under harsh conditions like high temperatures, chemicals, or UV exposure. |
|
Cost-Effectiveness |
While performance is essential, price remains a key factor in purchasing decisions. Consumers seek a balance between performance and cost-efficiency. |
|
Sustainability and Environmental Considerations |
Increasing demand for environmentally friendly products drives consumers to choose fluoropolymers with sustainable sourcing and minimal environmental impact. |
|
Customization and Tailored Solutions |
Consumers in industries like medical devices or aerospace seek tailored solutions, driving demand for customized formulations of filled fluoropolymers. |
|
Regulatory Compliance and Safety Standards |
Compliance with industry regulations, such as RoHS or FDA approvals, is crucial for consumers in regulated sectors like healthcare and electronics. |
Consumer behavior in the filled fluoropolymer market is heavily influenced by several key factors, including the material's performance, cost-effectiveness, and sustainability. Performance and durability are paramount for consumers, especially in industries that demand high-performance materials, such as aerospace or chemical processing, where products must withstand extreme conditions. However, consumers also look for a balance between these high-performing materials and cost-effectiveness, especially in competitive industries. Additionally, sustainability is becoming an increasingly important factor, with more consumers prioritizing eco-friendly products that align with global environmental goals. The need for customization is also strong in niche markets like medical devices, where tailored solutions can provide distinct advantages. Lastly, regulatory compliance and safety standards are vital, particularly in sectors like healthcare and electronics, where adherence to standards is non-negotiable. These behaviors are shaping demand for filled fluoropolymers and driving the evolution of products in this market.
Filled Fluoropolymer Market Segments
By Type
Filled PTFE dominated the Filled Fluoropolymer market in 2023 with a market share of 45%. PTFE, known for its exceptional chemical resistance, high-temperature stability, and outstanding electrical insulation properties, is widely used across industries such as automotive, chemical processing, and electronics. These properties make filled PTFE the go-to material for applications that require durability and long-lasting performance under harsh conditions. In the automotive sector, filled PTFE is crucial for gaskets, seals, and under-the-hood components exposed to high temperatures and aggressive chemicals. For instance, filled PTFE is commonly used in fuel lines, ensuring they remain unaffected by harsh chemicals and high temperatures. Similarly, in the chemical processing industry, PTFE’s non-reactive nature makes it ideal for use in pipes, valves, and pumps that come into contact with corrosive substances. In electronics, filled PTFE is used for insulating wires and cables. Its diverse applications across multiple industries cemented PTFE as the leading type of filled fluoropolymer in 2023.
By Fillers
Glass Fiber dominated the Filled Fluoropolymer market in 2023, with a market share of 40%. Glass fiber is favored due to its ability to significantly enhance the mechanical properties of fluoropolymers, including strength, stiffness, and dimensional stability. This makes it the filler of choice in industries such as automotive, aerospace, and industrial manufacturing. For example, in the automotive sector, glass fiber-filled fluoropolymers are used in bearings, bushings, seals, and other components that experience wear and need to maintain high performance over extended periods. The increased wear resistance of these materials is crucial for automotive parts that are exposed to high temperatures and friction. In the aerospace industry, glass fiber-filled fluoropolymers provide a lightweight yet durable solution for components exposed to extreme conditions, such as high heat and pressure. Their ability to withstand demanding operational environments ensures that glass fiber remains the top filler in the Filled Fluoropolymer market.
By End Use Industry
The Automotive industry dominated the end-use sector in the Filled Fluoropolymer market in 2023, accounting for 35% of the market share. The automotive sector’s demand for high-performance materials that can endure extreme temperatures, friction, and aggressive chemicals has driven the growth of filled fluoropolymers. These materials are crucial in automotive applications such as gaskets, seals, fuel lines, and under-the-hood parts that must maintain integrity and reliability under challenging conditions. For example, filled PTFE is commonly used in fuel systems to resist degradation from chemicals and high temperatures. The automotive sector’s push for lightweight yet durable materials has also driven demand for fluoropolymers in electric vehicles (EVs), where electrical insulation properties are essential for battery systems, wiring, and connectors. With the automotive industry continually evolving to meet environmental standards and improve vehicle performance, the demand for filled fluoropolymers in this sector remains robust, ensuring its leading position in the market.
Filled Fluoropolymer Market Regional Analysis
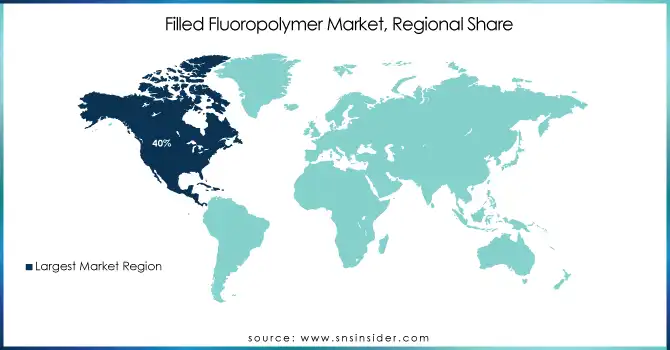
In 2023, North America dominated the Filled Fluoropolymer market, holding a market share of 40%. The dominance of North America can be attributed to the region’s advanced industrial base, strong manufacturing capabilities, and widespread adoption of high-performance materials in key sectors such as automotive, healthcare, and aerospace. The demand for filled fluoropolymers is particularly high in the U.S., which leads the region in manufacturing and technological innovation. The automotive industry in the U.S. is a key consumer of filled fluoropolymers, using materials like filled PTFE for gaskets, seals, and fuel lines that must endure high temperatures and aggressive chemicals. Moreover, U.S. companies such as 3M and The Chemours Company are prominent players in the fluoropolymer market, driving product innovation and market expansion. The healthcare sector in North America also contributes significantly to the demand for filled fluoropolymers, where these materials are used for medical tubing and implants due to their non-reactive and durable nature. Additionally, the region’s growing focus on sustainable manufacturing processes and electric vehicles has accelerated the adoption of fluoropolymers with enhanced electrical insulation properties. As a result, North America remains the dominant region in 2023, with the U.S. leading the charge in filled fluoropolymer consumption.
Moreover, in 2023, the Asia Pacific region emerged as the fastest-growing market for filled fluoropolymers, with a CAGR of 8%. The growth in this region is primarily driven by rapid industrialization, increasing automotive production, and expanding manufacturing capacities in countries like China, India, and Japan. China, in particular, stands out as the largest market in the region and is expected to continue its dominance due to its large-scale manufacturing industries and infrastructure projects. The automotive sector in China is one of the major drivers of the filled fluoropolymer market, as demand for high-performance materials for seals, gaskets, and under-the-hood components continues to rise with the country’s increasing production of both conventional and electric vehicles. The burgeoning electric vehicle market in China, along with government initiatives to promote clean energy, has further accelerated the adoption of advanced fluoropolymer materials, particularly in components such as battery casings and connectors. India is also showing significant growth, especially in automotive manufacturing, where the demand for durable, heat-resistant materials like filled PTFE is increasing. In Japan, the demand for filled fluoropolymers is driven by the aerospace and electronics sectors, where high-quality, reliable materials are essential. The overall expansion of manufacturing sectors in these countries, along with increasing investment in research and development for improved material performance, ensures that Asia Pacific will continue to lead the market’s growth trajectory in the coming years.
Get Customized Report as per your Business Requirement - Request For Customized Report
Key Players
-
AFT Fluorotec Ltd (Filled PTFE, Filled PFA)
-
AGC Inc. (Fluon ETFE, Fluon PFA)
-
DAIKIN INDUSTRIES, Ltd. (Daikin PTFE, Daikin FEP)
-
FLUORTEN (Fluoropolymer Films, Fluoropolymer Sheets)
-
HaloPolymer OJSC (Halar ECTFE, Polyfluor)
-
HINDUSTAN NYLONS (Hindustan PTFE, Hindifluor)
-
Mitsubishi Chemical Corporation (Lumiflon FEVE, PFA)
-
OJSC (Fluoropolymers, Teflon-based products)
-
Shashi Fluoroplastiks (PTFE Films, PFA Tubes)
-
Standard Fluoromers Pvt. Ltd. (PTFE Rods, PFA Tubes)
-
The Chemours Company (Teflon PTFE, Teflon PFA)
-
3M (Dyneon PTFE, Dyneon FEP)
-
U-Tech Polymers (U-Tech PTFE, U-Tech PFA)
-
Saint-Gobain Performance Plastics (Nexus PTFE, Chemfluor PFA)
-
Solvay S.A. (Solef PFA, Kalrez Perfluoroelastomers)
-
Daikin America, Inc. (Daikin FEP, Daikin PFA)
-
Nippon Electric Glass Co., Ltd. (Neoflon PTFE, Neoflon FEP)
-
Polyflon Technology Ltd. (Polyflon PTFE, Polyflon FEP)
-
Asahi Glass Co., Ltd. (Fluon ETFE, Fluon PFA)
-
Parker Hannifin Corporation (Parflex PTFE, Parflex PFA)
Recent Developments
-
May 2024: Asahi Kasei, Mitsui Chemicals, and Mitsubishi Chemical announced a collaborative feasibility study to convert feedstock and fuel at their ethylene production facilities in western Japan, aiming for carbon neutrality and leading decarbonization efforts.
-
February 2024: The Mitsubishi Chemical Group unveiled a groundbreaking ceramic matrix composite (CMC) for the space industry, offering exceptional heat resistance up to 1,500°C. This innovation, made with pitch-based carbon fibers, promises to revolutionize space applications.
| Report Attributes | Details |
|---|---|
| Market Size in 2023 | US$ 3.8 Billion |
| Market Size by 2032 | US$ 6.3 Billion |
| CAGR | CAGR of 5.8% From 2024 to 2032 |
| Base Year | 2023 |
| Forecast Period | 2024-2032 |
| Historical Data | 2020-2022 |
| Report Scope & Coverage | Market Size, Segments Analysis, Competitive Landscape, Regional Analysis, DROC & SWOT Analysis, Forecast Outlook |
| Key Segments | •By Type (Filled PTFE (Polytetrafluoroethylene), Filled FEP (Fluorinated Ethylene Propylene), Filled PFA (Perfluoroalkoxy Alkanes), Others) •By Fillers (Glass Fiber, Carbon Black, Metal Fillers, Others) •By End Use Industry (Automotive, Oil & Gas, Healthcare, Electrical & Electronics, Construction, Others) |
| Regional Analysis/Coverage | North America (US, Canada, Mexico), Europe (Eastern Europe [Poland, Romania, Hungary, Turkey, Rest of Eastern Europe] Western Europe] Germany, France, UK, Italy, Spain, Netherlands, Switzerland, Austria, Rest of Western Europe]), Asia Pacific (China, India, Japan, South Korea, Vietnam, Singapore, Australia, Rest of Asia Pacific), Middle East & Africa (Middle East [UAE, Egypt, Saudi Arabia, Qatar, Rest of Middle East], Africa [Nigeria, South Africa, Rest of Africa], Latin America (Brazil, Argentina, Colombia, Rest of Latin America) |
| Company Profiles | HaloPolymer, OJSC, Mitsubishi Chemical Corporation, 3M, HINDUSTAN NYLONS, The Chemours Company, AGC Inc., Shashi Fluoroplastiks, DAIKIN INDUSTRIES, Ltd., U-Tech Polymers, FLUORTEN, .AFT Fluorotec Ltd, Standard Fluoromers Pvt. Ltd. and other key players |
| Key Drivers | •Growing Focus on Sustainability and PFAS-Free Fluoropolymer Innovations Spurs Market Development •Rising Investments in Infrastructure Development and Industrial Applications Propel Demand for Filled Fluoropolymers |
| Restraints | •High Manufacturing Costs and Limited Availability of Raw Materials Constrain Market Growth Potential |
Frequently Asked Questions
North America dominated the filled fluoropolymer market with a 40% share, driven by advanced industrial capabilities, strong manufacturing in key sectors like automotive, healthcare, and aerospace, and the U.S.'s leadership in innovation and demand for high-performance materials.
The filled fluoropolymer market faces challenges from stringent regulations and environmental concerns, requiring costly investments in sustainable practices and PFAS-free alternatives, which may hinder short-term growth.
The filled fluoropolymer market is growing due to its applications in medical devices, 3D printing advancements, and the demand for sustainable energy solutions, driven by its unique properties like biocompatibility and thermal stability.
The Filled Fluoropolymer Market Size was valued at USD 3.8 billion in 2023 and is expected to reach USD 6.3 billion by 2032.
The Filled Fluoropolymer Market is expected to grow at a CAGR of 5.8%
Get in Touch
