Electronic Shelf Label Market Report Scope & Overview:
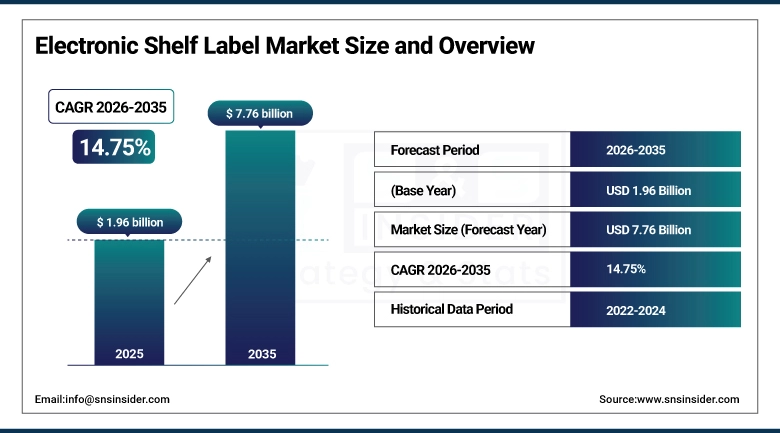
The Electronic Shelf Label Market size was valued at USD 1.96 Billion in 2025 and is projected to reach USD 7.76 Billion by 2035, growing at a CAGR of 14.75% during 2026–2035.
The Electronic Shelf Label (ESL) Market is expanding as the demand for automation and digitalization in retail operations is high. Even retailers are embracing ESLs in order to attain price accuracy, inventory management, minimize labor costs, and maximize operational efficiency. This demand is fueled by escalating consumer expectations for dynamic pricing, up to the minute product availability details, and personalized shopping experiences. The ESL performance is enhanced by the growing technology enabling like IoT based connectivity, cloud-based management systems, energy efficient e-paper display, etc. Worldwide expansion of modern retail chains further bolsters the market growth.
Electronic Shelf Label Market Size and Growth:
-
Market Size in 2025: USD 1.96 Billion
-
Market Size by 2035: USD 7.76 Billion
-
CAGR: 14.75% during 2026–2035
-
Base Year: 2025
-
Forecast Period: 2026–2035
-
Historical Data: 2022–2024
To Get more information on Electronic Shelf Label Market - Request Free Sample Report
Electronic Shelf Label Market Key Trends:
-
Increasing adoption of automation and digital solutions in retail is driving consistent demand for electronic shelf labels (ESLs) across supermarkets, hypermarkets, and convenience stores.
-
Rising focus on pricing accuracy, dynamic pricing, and real-time product information is accelerating ESL deployment in retail chains and e-commerce fulfillment centers.
-
Advancements in IoT connectivity, cloud-based management systems, and energy-efficient e-paper displays are enhancing ESL performance, reliability, and integration capabilities.
-
Growing demand for personalized shopping experiences and smart store initiatives is strengthening revenue opportunities for ESL providers.
-
Integration with inventory management, analytics, and mobile applications is enabling real-time stock updates, pricing changes, and operational efficiency.
-
Expansion of modern retail infrastructure in emerging economies is boosting ESL adoption and contributing to overall market growth.
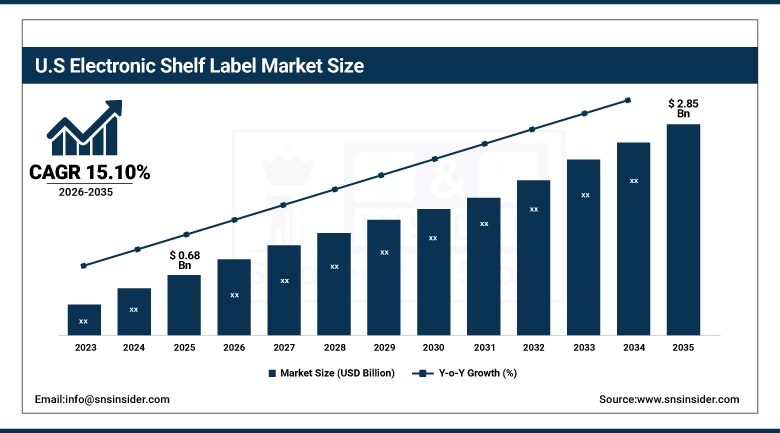
U.S. Electronic Shelf Label (ESL) Market Size Outlook:
The U.S. Electronic Shelf Label (ESL) Market was valued at USD 0.68 Billion in 2025 and is projected to reach USD 2.85 Billion by 2035, growing at a CAGR of 15.10% during 2026–2035. The U.S. Electronic Shelf Label Market is growing due to increasing retail automation, demand for real-time pricing and inventory management, adoption of IoT-enabled e-paper displays, and expansion of modern supermarkets and convenience stores seeking operational efficiency and enhanced customer experiences.
Electronic Shelf Label Market Key Drivers:
-
Key Drivers Fueling the Growth of the Electronic Shelf Label Market
This trend is one of the major factors driving the Electronic Shelf Label (ESL) Market, as the shift towards automation and digitization of retail is continuously increasing exponentially. Electronics shelf labels (ESLs) are increasingly being adopted by retailers as a means to improve pricing precision, drive automation in inventory management, and improve operating efficiency. With real-time pricing updates and dynamic pricing capabilities, businesses can react fast to market changes and competitor landscape, as well as customer stickiness. Advancements in IoT-enabled connectivity, cloud-based management solutions, and energy-efficient e-paper displays are also propelling the adoption. Moreover, the rising emphasis on improving in-store customer experience and minimizing labor costs is further contributing to the market growth across the globe.
Electronic Shelf Label Market Key Restraints:
-
Challenges and Constraints Delaying the Adoption of ESL Technology
The high initial capital cost combined with the cost to install ESL systems is a major barrier to their adoption, especially for cash-strapped SMEs. You also have functional hurdles as integration complexities with existing retail IT infrastructure such as legacy point-of-sale, inventory systems become operational pain points as well. They also restrain the market, as enterprises are not inclined towards any solution that requires high maintenance, technical support, data security, software compatibility, and reliability of wireless connectivity. Third, the absence of communication standards in ESL devices for each region may restrict the large-scale deployment in one market, thus slowing down their adoption.
Electronic Shelf Label Market Key Opportunities:
-
Emerging Opportunities for Expansion and Innovation in ESL Solutions
The expansion of modern retail chains, supermarkets and smart store initiatives in the emerging economies are some of the lucrative opportunity creating factor for ESL market growth. Mobile apps, AI-based analytics, and omnichannel retail strategies can integrate with ESLs, allowing personalized promotions, dynamic pricing, and enhanced inventory visibility. As consumers increasingly favor a more interactive and streamlined shopping experience, retailers are turning to digital shelf solutions. Emerging technological innovations (next-generation e-paper displays, low-power communication protocol, upgrades in cloud-based management systems) offer prospects for new product developers and strategic partnerships, propelling market growth during the forecast period.
Electronic Shelf Label Market Segments:
-
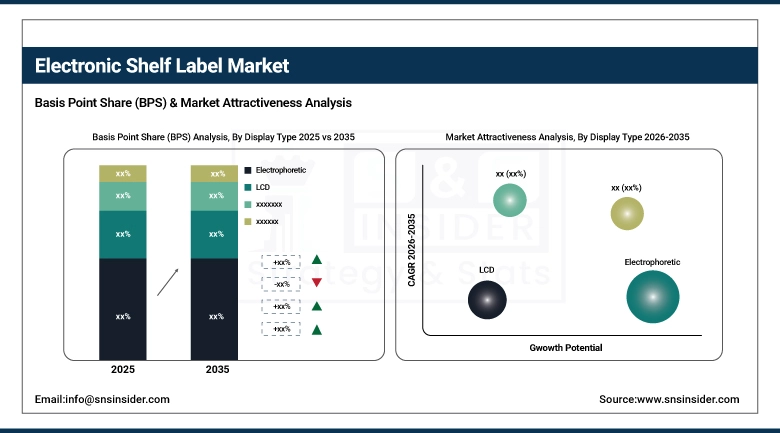
By Display Type: In 2025, Electrophoretic dominated with 55% share; OLED fastest growing segment during 2026–2035
-
By Communication Technology: In 2025, Radio Frequency (RF) dominated with 50% share; Bluetooth Low Energy (BLE) fastest growing segment during 2026–2035
-
By Application: In 2025, Price Tagging dominated with 48% share; Promotions & Advertising fastest growing segment during 2026–2035
-
By End User: In 2025, Supermarkets & Hypermarkets dominated with 52% share; Specialty Retail fastest growing segment during 2026–2035
By Display Type, Electrophoretic Dominates While OLED Grows Rapidly:
ESL market is still dominated by electrophoretic displays, thanks to their low power requirements, good visibility in different lighting conditions, and comparatively lower costs. The ESL solutions portfolio of the global ESL market comprises of these displays which are extensively used for price tagging and inventory management in supermarkets hypermarkets and convenience stores thus forming the basis of ESL solutions globally.
OLEDs, meanwhile, have become the fastest-growing segment thanks to their high-resolution capabilities and vivid colors, as well as their flexibility for quickly updating product information on-the-fly. This is providing high growth in this segment where retailers are adopting OLED-based ESLs for premium product displays, interactive promotions, and digital advertising.
By Communication Technology, Radio Frequency (RF) Dominates While Bluetooth Low Energy (BLE) Grows Rapidly:
Currently, RF-based ESL solutions dominate the market, as they offer secure long-distance communication, reliable integration with store management software, and tend to perform well in large-scale system deployments, especially in retail chains. Advantage of RF technology has the above mentioned merits, so it is quite commonly adopted to assure uniform performance in various store layouts and conditions.
Smart shoppers have seen the rapid adoption of BLE technology, one of the coolest new technologies available today because of its low energy requirements, ease of integration with mobile devices, and unique customer service features that facilitate interactive, real-time engagement with customers. Retailers are using ESLs with embedded BLE to enable proximity marketing, personalized alerts, and improved omnichannel retail experiences.
By Application, Price Tagging Dominates While Promotions & Advertising Grow Rapidly:
The price tagging is the most promising application of ESLs as its popularity is stirred by regulatory compliance, quick price updates and inventory visibility at the retail stores. Supermarkets and hypermarkets are some of the largest users of ESLs, as they need to ensure accurate prices and operations at scale.
This high growth is primarily attributed to the increasing usage of ESLs by the retailers to display the dynamic offers, personalized promotions, and cross-selling messages behind the ESL applications for promotions and advertisement. This integration with artificial intelligence and analytics allows to update these efficiently and from anywhere, increasing customer interaction as well as increasing sales.
By End User, Supermarkets & Hypermarkets Dominate While Specialty Retail Expands Rapidly:
At present, supermarkets and hypermarkets occupy the majority of the ESL market by virtue of their extensive store lands, significant SKU counts, and the need for price and inventory management across numerous locations. The ESL adoption in these stores enhances operation efficiency and lowers the labor cost.
Specialty retail segment is anticipated to grow the fastest among end-user segments, as it is expected to witness the increasing adoption of ESLs in boutique stores, electronics, fashion and luxury retailers for improved overall customer experience, interactive product displays, and dynamically controlled pricing, creating new revenue opportunities for ESL vendors and further broadening market adoption.
Electronic Shelf Label Market Regional Analysis:
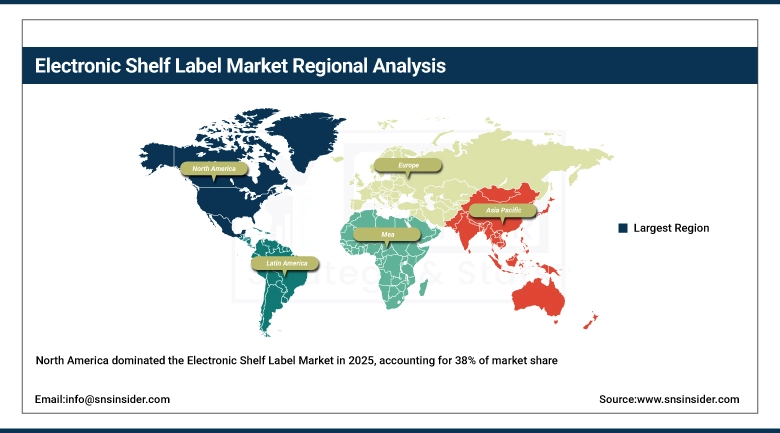
North America Electronic Shelf Label Market Insights:
North America Electronic Shelf Label Market is the highest contributor as it accounted for approximately 38% of market share in 2025. For instance, increase in adoption of automation and digital retail technologies in supermarkets, hypermarkets and convenience stores in U.S. and Canada support the growth of the market. Traditionally ESLs have been used for real time price changes, live promotions, and to manage inventory. North America is ranked at the top market for IoT retail solutions, due to high investment in IoT retail solutions and modern store infrastructure.
Get Customized Report as per Your Business Requirement - Enquiry Now
Asia-Pacific Electronic Shelf Label Market Insights:
The Asia-Pacific region is poised to witness the highest growth over the forecast period with a CAGR of 16.2% during 2026–2035, owing to growing modern retail chains coupled with smart store initiatives and rapid urbanization in several economies such as China, India, Japan, and South Korea. The high growth of this region has been attributed to the increasing adoption of digital retail solutions, increasing consumer demand for live price visibility, and government initiatives for smart retail infrastructure.
Europe Electronic Shelf Label Market Insights:
Europe is an advanced ESL marketplace, dominated by supermarket chains and hypermarkets in Germany, France and the UK. High consumer awareness coupled with penetration of digital pricing solutions and regulatory focus on operational efficiency and energy-saving technologies, add to the market potential. More and more retailers are making ESLs smarter with artificial intelligence and analytics to make pricing and promotions assessment and optimization across many stores.
Latin America Electronic Shelf Label Market Insights:
Latin America ESL Market will lead towards initial growth stage developments in retail modernization of stores on ongoing in top three countries Brazil, Mexico and Argentina. The gradual growth of the global digital price tags market is projected to be driven by rising adoption of digital price tags to manage the inventory and operational efficiency, coupled with increased awareness among consumers.
Middle East & Africa (MEA) Electronic Shelf Label Market Insights:
MEA ESL Market Growth and InnovationEssence of the ResearchThe MEA ESL market is still in a developing stage with the new trend of retail infrastructure modernization, smart store expansion and growing adoption of digital pricing solutions across UAE, Saudi Arabia and South Africa are fuelling the demand for ESL in the region. While adoption is not as widespread as North America and Europe, government initiatives, exporting interest in retail investments, and supermarket chains will help drive the market.
Electronic Shelf Label Market Competitive Landscape:
Advantech Inc is also a Taiwanese leader in smart manufacturing and retail automation solutions, including Electronic Shelf Label (ESL) systems. The firm applies its domain knowledge in IoT, embedded computing, and cloud-based management platforms to provide seizable ESL solutions to supermarkets, hypermarkets and convenience stores around the globe. Advantech specializes in energy-saving displays and seamless integration with retail management systems as well as featuring up-to-date specifications for real-time pricing and inventory management, which provides both operational benefits and a better shopping experience.
-
2026: Advantech launched an upgraded ESL platform with AI-enabled dynamic pricing and cloud-based inventory analytics, allowing retailers to optimize pricing strategies, reduce operational costs, and enhance personalized promotions in real-time.
Altierre Corporation is a provider of ESL and IoT retail solutions headquartered in the U.S. Altierre offers wireless shelf labelling systems, digital price tags with cloud-connected software for inventory visibility and pricing automation. It works on store efficiency, labor cost and also making lives easier through interface between ERP and point-of-sale systems, hence competing with the big names in smart retail transformation.
-
2026: Altierre introduced a next-generation BLE-enabled ESL system with enhanced range, lower power consumption, and AI-driven pricing management, targeting large-scale supermarket chains and specialty retail stores in North America and Europe.
Electronic Shelf Label Companies are:
-
Advantech Inc
-
E Ink Holdings Inc
-
Herbert Retail Limited
-
M2COMM
-
Opticon Sensors Europe B.V
-
Teraoka Seiko Co Ltd
-
SoluM
-
SES-imagotag
-
Samsung Electronics Co. Ltd
| Report Attributes | Details |
|---|---|
| Market Size in 2025 | USD 1.96 Billion |
| Market Size by 2035 | USD 7.76 Billion |
| CAGR | CAGR of 14.75% From 2026 to 2035 |
| Base Year | 2025 |
| Forecast Period | 2026-2035 |
| Historical Data | 2022-2024 |
| Report Scope & Coverage | Market Size, Segments Analysis, Competitive Landscape, Regional Analysis, DROC & SWOT Analysis, Forecast Outlook |
| Key Segments | • By Display Type: (Electrophoretic, LCD, OLED) • By Communication Technology: (Radio Frequency (RF), Infrared (IR), Bluetooth Low Energy (BLE)) • By Application: (Price Tagging, Inventory Management, Promotions & Advertising) • By End User: (Supermarkets & Hypermarkets, Convenience Stores, Specialty Retail) |
| Regional Analysis/Coverage | North America (US, Canada), Europe (Germany, UK, France, Italy, Spain, Russia, Poland, Rest of Europe), Asia Pacific (China, India, Japan, South Korea, Australia, ASEAN Countries, Rest of Asia Pacific), Middle East & Africa (UAE, Saudi Arabia, Qatar, South Africa, Rest of Middle East & Africa), Latin America (Brazil, Argentina, Mexico, Colombia, Rest of Latin America). |
| Company Profiles | Advantech Inc, Displaydata Limited, E Ink Holdings Inc, Herbert Retail Limited, M2COMM, Opticon Sensors Europe B.V, Diebold Nixdorf Incorporated, Teraoka Seiko Co Ltd, SoluM, SES-imagotag, Samsung Electronics Co. Ltd. |
Get in Touch
