Battery-free Sensors Market Size & Overview:
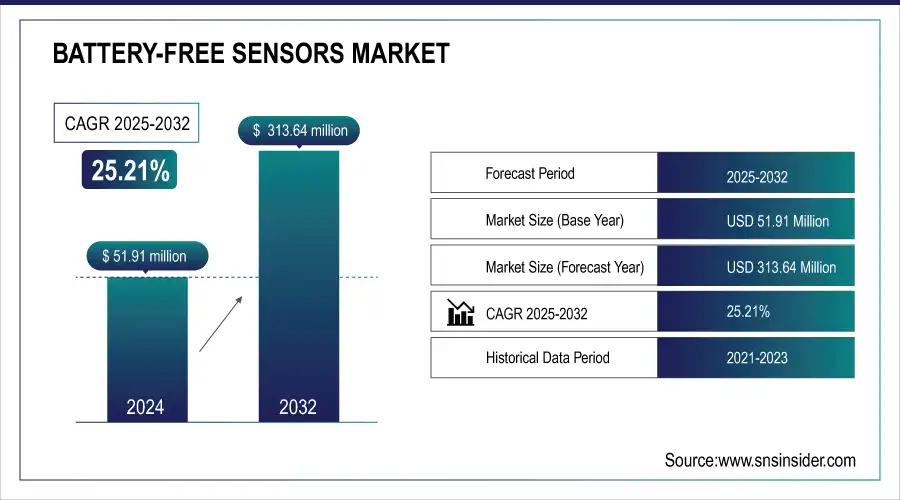
The Battery-free Sensors Market Size was valued at USD 51.91 Million in 2024 and is expected to reach USD 313.64 Million by 2032 and grow at a CAGR of 25.21% over the forecast period 2025-2032.
The battery-free sensors market is experiencing rapid growth and has the potential to reshape the Internet of Things (IoT) landscape significantly. These sensors, distinct from traditional battery-dependent counterparts, utilize energy from their surroundings, eliminating the need for frequent replacements and enabling broader, more sustainable deployments. Employing diverse energy harvesting techniques, such as ambient radio waves, vibrations, and thermal energy, battery-free sensors find applications in industrial automation, healthcare, smart buildings, and logistics. Key drivers of market growth include the increasing demand for IoT, advancements in microelectronics for smaller and more efficient sensors, reduced maintenance costs, and sustainability benefits.

Get more information on Battery-Free Sensors Market - Request Sample Report
Battery-Free Sensors Market Size and Forecast:
-
Market Size in 2024: USD 51.91 Million
-
Market Size by 2032: USD 313.64 Million
-
CAGR: 25.21% from 2025 to 2032
-
Base Year: 2024
-
Forecast Period: 2025–2032
-
Historical Data: 2021–2023
key trends for the Battery-Free Sensors Market:
-
Rising integration of energy-harvesting technologies (RF, solar, piezoelectric, thermoelectric) to enable maintenance-free, self-powered operation.
-
Accelerated adoption in IoT, smart cities, and industrial automation as stakeholders seek sustainable, low-maintenance sensor networks.
-
Ultra-low-power electronics and improved wireless protocols (UHF RFID, NFC, BLE) boosting reliability and deployment range.
-
Growth in healthcare, logistics, and environmental monitoring applications where battery replacement is impractical.
-
Increasing regulatory and sustainability pressures pushing for devices that reduce electronic waste and energy consumption.
-
Challenges remain: limited energy availability in low-power or harsh environments, and the need for standardization and integration with legacy systems.
Despite challenges such as limited range and power compared to battery-powered sensors, ongoing research and development in energy harvesting techniques and sensor design are expected to overcome these obstacles, indicating a promising future for the battery-free sensors market, poised to revolutionize various industries and foster a pervasive and sustainable IoT ecosystem. Sensors that do not require batteries are used to measure, monitor, and record parameters such as humidity, temperature, heat losses, and so on. Essentially, battery-free sensors sense temperature and strain. Sensors that do not require batteries are widely utilized in a variety of sectors, including smart homes and consumer electronics.
Sensors that do not require batteries operate on the radio frequency concept. With expenditures in development, research, and testing, the battery-free sensors business is predicted to earn moderate income in the next years. However, the market for battery-free sensors is developing and is projected to provide moderate income for important companies in the future years.
Battery-Free Sensors Market Drivers:
-
The adoption of automated condition monitoring technologies in smart factories is on the rise.
-
Improving productivity by increasing the installation of battery-free sensors in industrial plants during the COVID-19 scenario.
-
The growing usage of battery-free sensors in IoT applications to save maintenance costs, along with fast developments in sensing technology, is driving this trend.
The increasing adoption of automated condition-monitoring technologies in smart factories signifies a notable trend in industrial innovation. As industries embrace the era of Industry 4.0, automated condition monitoring plays a crucial role in ensuring the optimal performance and health of machinery. This involves the integration of sensors and monitoring systems that can continuously assess and analyze various parameters, such as temperature, vibration, and other operational metrics. By deploying these technologies, smart factories can enhance their predictive maintenance capabilities, minimizing downtime, and improving overall efficiency. The shift towards automated condition monitoring reflects a strategic move towards proactive maintenance strategies, enabling industries to address potential issues before they escalate, thereby optimizing production processes and reducing operational disruptions.
Battery-Free Sensors Market Restraints:
-
Concerns regarding data security
While the Internet of Things (IoT) presents vast possibilities, apprehensions about data privacy and security are widespread due to the inherent nature of IoT devices. Given their inherently data-centric operation, IoT-enabled devices and sensors generate a substantial volume of data continuously. Various sensor types are employed by companies and organizations to monitor and make decisions based on this data. As the reliance on machine-generated data for real-time business processes increases, ensuring the authenticity of the data becomes paramount, necessitating attention to the security, resilience, and reliability of the devices collecting this data. The interconnected nature of IoT introduces numerous decentralized entry points for malware, posing a significant threat if the IoT infrastructure lacks robust security measures. Cyber attackers can exploit these vulnerabilities and potentially cause harm to other devices within the network.
Battery-Free Sensors Market Opportunities:
-
Predictive maintenance methods are widely used in industrial settings.
-
Government efforts and subsidies have been approved to support IoT projects.
The adoption of predictive maintenance techniques has become prevalent in industrial settings, marking a transformative approach to equipment upkeep. Utilizing the capabilities of data analytics and IoT technology, predictive maintenance involves real-time monitoring of operational parameters in machinery and equipment. By gathering and analyzing data related to factors like temperature, vibration, and performance metrics, organizations can anticipate potential equipment failures before they occur. This proactive strategy enables timely and targeted maintenance interventions, leading to minimized downtime, reduced repair costs, and extended lifespan for industrial assets. The widespread embrace of predictive maintenance signifies a strategic departure from traditional reactive maintenance practices towards a more efficient and cost-effective model that aligns with the principles of Industry 4.0.
Battery-Free Sensors Market Challenges:
-
Inadequate expertise in managing extensive datasets.
Battery-free sensors, equipped with RFID tags, are utilized to relay extensive volumes of tracked, identified, and monitored data to operators. In environments like data centers, where assets such as servers, tapes, media, routers, and other devices are constantly tracked, terabytes of data are generated daily. Consequently, managing the exponentially increasing data poses a significant challenge for companies. If not handled meticulously, this surge in data could lead to issues such as increased server load or insufficient storage capacity.
Battery-Free Sensors Market Segmentation Analysis:
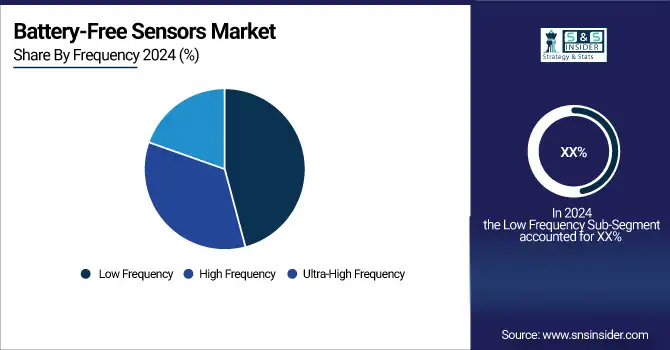
By Frequency, Ultra-High Frequency Leads Market While High Frequency Registers Fastest Growth
The Ultra-High Frequency (UHF) segment dominates revenue share in 2024 as it delivers long read ranges (up to 20 feet), metal compatibility, and the ability to read multiple sensors simultaneously. This cause, the scalability of UHF in industrial, logistics, and supply chain environments, affects its adoption in wireless sensor networks, cementing its market leadership. Its role in enhancing efficiency and traceability across high-volume operations secures its dominance.
The High Frequency (HF) segment is registering the fastest CAGR, driven by its increasing role in healthcare devices, smartphones, and supply chains. This cause, rising demand for precise, short-range wireless monitoring, affects product innovation in patient monitoring, contactless data exchange, and retail automation, making HF the fastest-expanding frequency category.

By Sensor Type, Temperature Sensors Dominate Market While Motion & Position Sensors Register Fastest Growth
The Temperature Sensors segment dominates the market in 2024, as they are widely used across healthcare, logistics, food & beverages, and industrial applications. This cause, the universal need to monitor and maintain thermal conditions, affects widespread adoption in medical devices, supply chains, and energy-sensitive systems, securing temperature sensors’ leadership.
The Motion & Position Sensors segment is projected to grow at the fastest CAGR, fueled by rising adoption in automotive, robotics, and IoT-enabled devices. This cause, demand for real-time movement tracking without battery dependency, affects automotive safety, industrial automation, and smart mobility applications, driving the highest growth trajectory in the market.
By Industry Vertical, Healthcare Leads Market While Automotive Registers Fastest Growth
The Healthcare segment dominates the market in 2024, contributing to over a quarter of total revenues. This cause, the rising use of sensors in patient monitoring, temperature/humidity control, and medical device integration, affects consistent demand for wireless, battery-free solutions, establishing healthcare as the revenue leader.
The Automotive segment is experiencing the fastest growth, driven by the shift toward EVs, connected vehicles, and predictive maintenance. This cause, the demand for wireless monitoring of tire pressure, safety systems, and vehicle diagnostics, affects innovation in automotive IoT ecosystems, fueling rapid adoption of battery-free sensors in this sector.
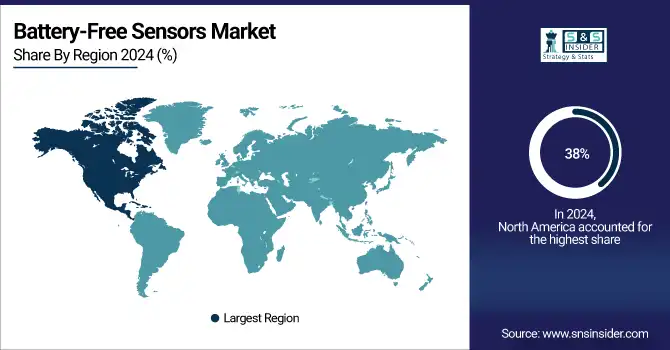
Need any customization research on Battery-Free Sensors Market - Enquiry Now
Battery-Free Sensors Market Regional Analysis:
North America Dominates Battery-Free Sensors Market in 2024
In 2024, North America commands an estimated 38% share of the Battery-Free Sensors Market, solidifying its leadership position. The region’s dominance is fueled by robust IoT adoption, expanding use in advanced healthcare applications, and widespread integration within industrial automation and smart infrastructure projects. Strong R&D ecosystems, significant government investments, and the presence of leading sensor technology providers further strengthen its market standing. With industries increasingly focused on efficiency, sustainability, and real-time monitoring, North America continues to drive innovation and large-scale adoption.
-
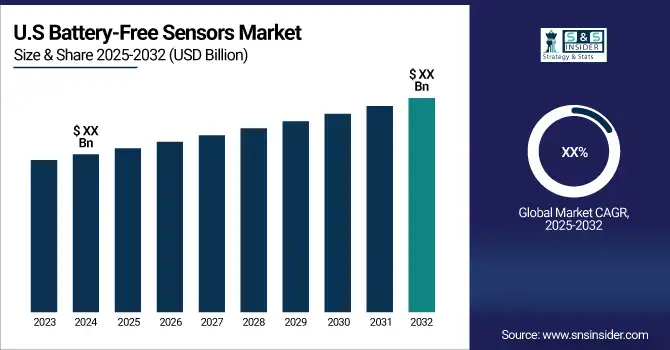
United States Leads North America’s Battery-Free Sensors Market
The U.S. dominates due to its advanced R&D ecosystem, large-scale deployment of IoT solutions, and early adoption in healthcare, logistics, and automotive sectors. Strong government investments in smart infrastructure, coupled with corporate spending on Industry 4.0, are driving adoption of wireless and battery-free sensors. Leading technology companies and startups operate across the U.S., ensuring a robust innovation pipeline. With healthcare monitoring, supply chain management, and industrial predictive maintenance as major use cases, the U.S. maintains its leadership in North America’s battery-free sensors market in 2024.
Asia Pacific is the Fastest-Growing Region in Battery-Free Sensors Market in 2024
The Asia Pacific battery-free sensors market is projected to grow at a robust CAGR of 27.5% from 2025 to 2032. This growth is fueled by rapid industrialization, expansion of electronics manufacturing hubs, and widespread adoption of IoT-enabled solutions. Increasing healthcare applications, such as patient monitoring and diagnostics, along with government-backed smart city projects, are accelerating deployment. Countries like China, Japan, and South Korea are investing heavily in next-generation wireless technologies, making the region a key driver of global market expansion.
-
China Leads Asia Pacific’s Battery-Free Sensors Market
China dominates due to its vast electronics manufacturing base, aggressive industrial automation, and large-scale adoption of IoT solutions. With cost-efficient production capabilities and government-backed smart infrastructure projects, China has emerged as a key hub for battery-free sensor innovation and export. Demand from automotive, logistics, and healthcare applications is rapidly increasing, supported by domestic and international manufacturers setting up operations in the country. Combined with strong investments in next-generation wireless technologies, China secures its position as the leading market for battery-free sensors in Asia Pacific.
Europe Battery-Free Sensors Market Insights, 2024
Europe shows steady growth in 2024, driven by Industry 4.0 adoption, strong sustainability mandates, and growing demand in automotive and healthcare sectors. Germany’s strong automotive and industrial manufacturing sectors accelerate demand for advanced wireless sensing technologies, leading to higher adoption of battery-free sensors.
-
Germany Leads Europe’s Battery-Free Sensors Market
Germany dominates due to its leadership in automotive engineering, industrial automation, and smart manufacturing. The country’s advanced R&D investments and adherence to EU sustainability regulations promote widespread adoption of energy-efficient, wireless, and battery-free sensor systems. German automotive giants and industrial leaders are integrating these technologies into connected vehicles, predictive maintenance, and logistics solutions. With its strong innovation culture and focus on eco-friendly technologies, Germany remains the primary driver of Europe’s battery-free sensors market in 2024.
Middle East & Africa and Latin America Battery-Free Sensors Market Insights, 2024
The battery-free sensors market in the Middle East & Africa and Latin America is experiencing steady growth in 2024, fueled by emerging IoT adoption and infrastructure modernization. In the Middle East, smart city initiatives in Saudi Arabia and the UAE are driving demand for wireless sensing solutions across utilities and construction. In Latin America, Brazil and Mexico are leading adoption with growing deployment in healthcare, logistics, and manufacturing. Rising urbanization, industrialization, and foreign investment in technology ecosystems further enhance growth across both regions.

Competitive Landscape for the Battery-Free Sensors Market:
Texas Instruments Inc.
Texas Instruments Inc. is a U.S.-based global leader in semiconductor design and manufacturing, with a strong presence in analog and embedded processing technologies. The company develops energy-efficient and scalable solutions, including ultra-low-power microcontrollers and wireless connectivity systems that support battery-free sensor applications. Its role in the battery-free sensors market is critical, as TI enables reliable energy harvesting and wireless sensing technologies used across automotive, industrial, and healthcare sectors, ensuring efficiency, sustainability, and long-term performance.
-
In 2024, Texas Instruments launched new ultra-low-power MCUs designed to extend energy-harvesting sensor applications, supporting IoT-enabled monitoring systems.
STMicroelectronics N.V.
STMicroelectronics N.V. is a Switzerland-based multinational semiconductor company specializing in smart sensor technologies, analog solutions, and microcontrollers. The company develops battery-free and energy-harvesting sensor solutions for applications in smart homes, healthcare, and industrial automation. Its role in the battery-free sensors market is significant, offering innovation in RF energy harvesting and secure IoT-enabled devices that enhance real-time monitoring. STMicroelectronics partners with global OEMs to integrate its solutions into smart infrastructure, driving market adoption.
-
In 2024, STMicroelectronics introduced next-generation energy-harvesting sensor platforms optimized for wearables and industrial IoT, boosting real-time wireless sensing applications.
Infineon Technologies AG
Infineon Technologies AG, headquartered in Germany, is a leading provider of semiconductor solutions focusing on energy efficiency, mobility, and security. The company designs innovative battery-free sensor technologies that leverage NFC, RFID, and energy-harvesting systems for sustainable IoT applications. Its role in the battery-free sensors market is pivotal, enabling solutions in automotive, healthcare, and smart cities through reliable, maintenance-free sensor systems. Infineon’s strong R&D capabilities and partnerships with global industries reinforce its leadership in advancing wireless, power-independent sensing technologies.
-
In 2024, Infineon launched an advanced NFC-based passive sensor solution tailored for smart healthcare monitoring and secure industrial asset tracking.
ON Semiconductor Corporation
ON Semiconductor Corporation (Onsemi) is a U.S.-based semiconductor manufacturer with expertise in intelligent power and sensing technologies. The company develops innovative battery-free sensor solutions integrated with ultra-low-power designs, energy harvesting, and wireless connectivity features. Its role in the battery-free sensors market is vital, as Onsemi focuses on sustainable IoT applications across automotive, logistics, and industrial sectors, delivering maintenance-free sensing systems. By driving advancements in edge intelligence and low-energy wireless technologies, Onsemi supports the growing adoption of battery-free sensor networks.
-
In 2024, ON Semiconductor unveiled its latest energy-harvesting sensor platform tailored for smart logistics and automotive asset management applications.
General Electric-Company Financial Analysis

Battery-Free Sensors Market Key Players:
-
Texas Instruments Inc.
-
STMicroelectronics N.V.
-
Infineon Technologies AG
-
ON Semiconductor Corporation
-
EnOcean GmbH
-
Everactive, Inc.
-
Axzon Inc.
-
Powercast Corporation
-
Farsens S.L.
-
Bridg Inc.
-
DCO Systems Ltd.
-
Inductosense Ltd.
-
Phase IV Engineering
-
Fuji Electric Co., Ltd.
-
General Electric
-
NXP Semiconductors N.V.
-
Analog Devices, Inc.
-
Broadcom Inc.
-
Robert Bosch GmbH
-
Sensirion AG
Report Attributes | Details |
---|---|
Market Size in 2024 | US$ 51.91 Million |
Market Size by 2032 | US$ 313.64 Million |
CAGR | CAGR of 25.21% From 2025 to 2032 |
Base Year | 2024 |
Forecast Period | 2025-2032 |
Historical Data | 2021-2023 |
Report Scope & Coverage | Market Size, Segments Analysis, Competitive Landscape, Regional Analysis, DROC & SWOT Analysis, Forecast Outlook |
Key Segments | • By Frequency (Low Frequency, High Frequency, Ultra-High Frequency) • By Sensor Type (Temperature Sensors, Pressure Sensors, Light Sensors, Humidity/Moisture Sensors, Motion and Position Sensors, Others) • By Industry Vertical (Automotive, Logistics, Oil & Gas, IT & Telecommunications, Healthcare, Food & Beverages, Others) |
Regional Analysis/Coverage | North America (US, Canada, Mexico), Europe (Germany, France, UK, Italy, Spain, Poland, Turkey, Rest of Europe), Asia Pacific (China, India, Japan, South Korea, Singapore, Australia, Taiwan, Rest of Asia Pacific), Middle East & Africa (UAE, Saudi Arabia, Qatar, South Africa, Rest of Middle East & Africa), Latin America (Brazil, Argentina, Rest of Latin America) |
Company Profiles | Advantech, Enocean, On Semiconductor Corporation, Texas Instruments, General Electric, Infineon Technologies, Axzon, Powercast, Inductosense and Farsens. |
Table Of Contents
1. Introduction
1.1 Market Definition & Scope
1.2 Research Assumptions & Abbreviations
1.3 Research Methodology
2. Executive Summary
2.1 Market Snapshot
2.2 Market Absolute $ Opportunity Assessment & Y-o-Y Analysis, 2021–2032
2.3 Market Size & Forecast, By Segmentation, 2021–2032
2.3.1 Market Size By Frequency
2.3.2 Market Size By Sensor Type
2.3.3 Market Size By Industry Vertical
2.4 Market Share & Bps Analysis By Region, 2024
2.5 Industry Growth Scenarios – Conservative, Likely & Optimistic
2.6 Industry CxO’s Perspective
3. Market Overview
3.1 Market Dynamics
3.1.1 Drivers
3.1.2 Restraints
3.1.3 Opportunities
3.1.4 Key Market Trends
3.2 Industry PESTLE Analysis
3.3 Key Industry Forces (Porter’s) Impacting Market Growth
3.4 Industry Supply Chain Analysis
3.4.1 Raw Material Suppliers
3.4.2 Manufacturers
3.4.3 Distributors/Suppliers
3.4.4 Customers/End-Users
3.5 Industry Life Cycle Assessment
3.6 Parent Market Overview
3.7 Market Risk Assessment
4. Statistical Insights & Trends Reporting
4.1 Technology Efficiency & Performance Metrics
4.1.1 Average power harvested per sensor (µW–mW range) across applications
4.1.2 Data transmission range (meters) of battery-free sensors by type
4.1.3 Signal latency (milliseconds) in industrial vs. consumer applications
4.2 Adoption & Deployment Statistics
4.2.1 Percentage of IoT devices using battery-free sensor technology
4.2.2 Growth rate of deployments in smart homes, healthcare, and industrial automation
4.2.3 Average number of battery-free sensors per installation in manufacturing plants
4.3 Cost & Sustainability Impact
4.3.1 Reduction in total cost of ownership (%) compared to battery-powered sensors
4.3.2 Estimated number of batteries eliminated annually due to battery-free alternatives
4.3.3 Payback period (months/years) for enterprises adopting large-scale deployments
4.4 Industry-Specific Utilization Rates
4.4.1 Percentage share of adoption in healthcare monitoring devices
4.4.2 Usage statistics in logistics & supply chain (RFID, asset tracking)
4.4.3 Share of adoption in environmental monitoring and smart agriculture
5. Battery-Free Sensors Market Segmental Analysis & Forecast, By Frequency, 2021 – 2032, Value (USD Million)
5.1 Introduction
5.2 Low Frequency
5.2.1 Key Trends
5.2.2 Market Size & Forecast, 2021 – 2032
5.3 High Frequency
5.4 Ultra-High Frequency
6. Battery-Free Sensors Market Segmental Analysis & Forecast, By Sensor Type, 2021 – 2032, Value (USD Million)
6.1 Introduction
6.2 Temperature Sensors
6.2.1 Key Trends
6.2.2 Market Size & Forecast, 2021 – 2032
6.3 Pressure Sensors
6.4 Light Sensors
6.5 Humidity/Moisture Sensors
6.6 Motion and Position Sensors
6.7 Others
7. Battery-Free Sensors Market Segmental Analysis & Forecast, By Industry Vertical, 2021 – 2032, Value (USD Million)
7.1 Introduction
7.2 Automotive
7.2.1 Key Trends
7.2.2 Market Size & Forecast, 2021 – 2032
7.3 Logistics
7.4 Oil & Gas
7.5 IT & Telecommunications
7.6 Healthcare
7.7 Food & Beverages
7.8 Others
8. Battery-Free Sensors Market Segmental Analysis & Forecast By Region, 2021 – 2025, Value (USD Million)
8.1 Introduction
8.2 North America
8.2.1 Key Trends
8.2.2 Battery-Free Sensors Market Size & Forecast, By Frequency, 2021 – 2032
8.2.3 Battery-Free Sensors Market Size & Forecast, By Sensor Type, 2021 – 2032
8.2.4 Battery-Free Sensors Market Size & Forecast, By Industry Vertical, 2021 – 2032
8.2.5 Battery-Free Sensors Market Size & Forecast, By Country, 2021 – 2032
8.2.5.1 USA
8.2.5.1.1 Battery-Free Sensors Market Size & Forecast, By Frequency, 2021 – 2032
8.2.5.1.2 Battery-Free Sensors Market Size & Forecast, By Sensor Type, 2021 – 2032
8.2.5.1.3 Battery-Free Sensors Market Size & Forecast, By Industry Vertical, 2021 – 2032
8.2.5.2 Canada
8.2.5.2.1 Battery-Free Sensors Market Size & Forecast, By Frequency, 2021 – 2032
8.2.5.2.2 Battery-Free Sensors Market Size & Forecast, By Sensor Type, 2021 – 2032
8.2.5.2.3 Battery-Free Sensors Market Size & Forecast, By Industry Vertical, 2021 – 2032
8.3 Europe
8.3.1 Key Trends
8.3.2 Battery-Free Sensors Market Size & Forecast, By Frequency, 2021 – 2032
8.3.3 Battery-Free Sensors Market Size & Forecast, By Sensor Type, 2021 – 2032
8.3.4 Battery-Free Sensors Market Size & Forecast, By Industry Vertical, 2021 – 2032
8.3.5 Battery-Free Sensors Market Size & Forecast, By Country, 2021 – 2032
8.3.5.1 Germany
8.3.5.1.1 Battery-Free Sensors Market Size & Forecast, By Frequency, 2021 – 2032
8.3.5.1.2 Battery-Free Sensors Market Size & Forecast, By Sensor Type, 2021 – 2032
8.3.5.1.3 Battery-Free Sensors Market Size & Forecast, By Industry Vertical, 2021 – 2032
8.3.5.2 UK
8.3.5.2.1 Battery-Free Sensors Market Size & Forecast, By Frequency, 2021 – 2032
8.3.5.2.2 Battery-Free Sensors Market Size & Forecast, By Sensor Type, 2021 – 2032
8.3.5.2.3 Battery-Free Sensors Market Size & Forecast, By Industry Vertical, 2021 – 2032
8.3.5.3 France
8.3.5.3.1 Battery-Free Sensors Market Size & Forecast, By Frequency, 2021 – 2032
8.3.5.3.2 Battery-Free Sensors Market Size & Forecast, By Sensor Type, 2021 – 2032
8.3.5.3.3 Battery-Free Sensors Market Size & Forecast, By Industry Vertical, 2021 – 2032
8.3.5.4 Italy
8.3.5.4.1 Battery-Free Sensors Market Size & Forecast, By Frequency, 2021 – 2032
8.3.5.4.2 Battery-Free Sensors Market Size & Forecast, By Sensor Type, 2021 – 2032
8.3.5.4.3 Battery-Free Sensors Market Size & Forecast, By Industry Vertical, 2021 – 2032
8.3.5.5 Spain
8.3.5.5.1 Battery-Free Sensors Market Size & Forecast, By Frequency, 2021 – 2032
8.3.5.5.2 Battery-Free Sensors Market Size & Forecast, By Sensor Type, 2021 – 2032
8.3.5.5.3 Battery-Free Sensors Market Size & Forecast, By Industry Vertical, 2021 – 2032
8.3.5.6 Russia
8.3.5.6.1 Battery-Free Sensors Market Size & Forecast, By Frequency, 2021 – 2032
8.3.5.6.2 Battery-Free Sensors Market Size & Forecast, By Sensor Type, 2021 – 2032
8.3.5.6.3 Battery-Free Sensors Market Size & Forecast, By Industry Vertical, 2021 – 2032
8.3.5.7 Poland
8.3.5.7.1 Battery-Free Sensors Market Size & Forecast, By Frequency, 2021 – 2032
8.3.5.7.2 Battery-Free Sensors Market Size & Forecast, By Sensor Type, 2021 – 2032
8.3.5.7.3 Battery-Free Sensors Market Size & Forecast, By Industry Vertical, 2021 – 2032
8.3.5.8 Rest of Europe
8.3.5.8.1 Battery-Free Sensors Market Size & Forecast, By Frequency, 2021 – 2032
8.3.5.8.2 Battery-Free Sensors Market Size & Forecast, By Sensor Type, 2021 – 2032
8.3.5.8.3 Battery-Free Sensors Market Size & Forecast, By Industry Vertical, 2021 – 2032
8.4 Asia-Pacific
8.4.1 Key Trends
8.4.2 Battery-Free Sensors Market Size & Forecast, By Frequency, 2021 – 2032
8.4.3 Battery-Free Sensors Market Size & Forecast, By Sensor Type, 2021 – 2032
8.4.4 Battery-Free Sensors Market Size & Forecast, By Industry Vertical, 2021 – 2032
8.4.5 Battery-Free Sensors Market Size & Forecast, By Country, 2021 – 2032
8.4.5.1 China
8.4.5.1.1 Battery-Free Sensors Market Size & Forecast, By Frequency, 2021 – 2032
8.4.5.1.2 Battery-Free Sensors Market Size & Forecast, By Sensor Type, 2021 – 2032
8.4.5.1.3 Battery-Free Sensors Market Size & Forecast, By Industry Vertical, 2021 – 2032
8.4.5.2 India
8.4.5.2.1 Battery-Free Sensors Market Size & Forecast, By Frequency, 2021 – 2032
8.4.5.2.2 Battery-Free Sensors Market Size & Forecast, By Sensor Type, 2021 – 2032
8.4.5.2.3 Battery-Free Sensors Market Size & Forecast, By Industry Vertical, 2021 – 2032
8.4.5.3 Japan
8.4.5.3.1 Battery-Free Sensors Market Size & Forecast, By Frequency, 2021 – 2032
8.4.5.3.2 Battery-Free Sensors Market Size & Forecast, By Sensor Type, 2021 – 2032
8.4.5.3.3 Battery-Free Sensors Market Size & Forecast, By Industry Vertical, 2021 – 2032
8.4.5.4 South Korea
8.4.5.4.1 Battery-Free Sensors Market Size & Forecast, By Frequency, 2021 – 2032
8.4.5.4.2 Battery-Free Sensors Market Size & Forecast, By Sensor Type, 2021 – 2032
8.4.5.4.3 Battery-Free Sensors Market Size & Forecast, By Industry Vertical, 2021 – 2032
8.4.5.5 Australia
8.4.5.5.1 Battery-Free Sensors Market Size & Forecast, By Frequency, 2021 – 2032
8.4.5.5.2 Battery-Free Sensors Market Size & Forecast, By Sensor Type, 2021 – 2032
8.4.5.5.3 Battery-Free Sensors Market Size & Forecast, By Industry Vertical, 2021 – 2032
8.4.5.6 ASEAN Countries
8.4.5.6.1 Battery-Free Sensors Market Size & Forecast, By Frequency, 2021 – 2032
8.4.5.6.2 Battery-Free Sensors Market Size & Forecast, By Sensor Type, 2021 – 2032
8.4.5.6.3 Battery-Free Sensors Market Size & Forecast, By Industry Vertical, 2021 – 2032
8.4.5.7 Rest of Asia-Pacific
8.4.5.7.1 Battery-Free Sensors Market Size & Forecast, By Frequency, 2021 – 2032
8.4.5.7.2 Battery-Free Sensors Market Size & Forecast, By Sensor Type, 2021 – 2032
8.4.5.7.3 Battery-Free Sensors Market Size & Forecast, By Industry Vertical, 2021 – 2032
8.5 Latin America
8.5.1 Key Trends
8.5.2 Battery-Free Sensors Market Size & Forecast, By Frequency, 2021 – 2032
8.5.3 Battery-Free Sensors Market Size & Forecast, By Sensor Type, 2021 – 2032
8.5.4 Battery-Free Sensors Market Size & Forecast, By Industry Vertical, 2021 – 2032
8.5.5 Battery-Free Sensors Market Size & Forecast, By Country, 2021 – 2032
8.5.5.1 Brazil
8.5.5.1.1 Battery-Free Sensors Market Size & Forecast, By Frequency, 2021 – 2032
8.5.5.1.2 Battery-Free Sensors Market Size & Forecast, By Sensor Type, 2021 – 2032
8.5.5.1.3 Battery-Free Sensors Market Size & Forecast, By Industry Vertical, 2021 – 2032
8.5.5.2 Argentina
8.5.5.2.1 Battery-Free Sensors Market Size & Forecast, By Frequency, 2021 – 2032
8.5.5.2.2 Battery-Free Sensors Market Size & Forecast, By Sensor Type, 2021 – 2032
8.5.5.2.3 Battery-Free Sensors Market Size & Forecast, By Industry Vertical, 2021 – 2032
8.5.5.3 Mexico
8.5.5.3.1 Battery-Free Sensors Market Size & Forecast, By Frequency, 2021 – 2032
8.5.5.3.2 Battery-Free Sensors Market Size & Forecast, By Sensor Type, 2021 – 2032
8.5.5.3.3 Battery-Free Sensors Market Size & Forecast, By Industry Vertical, 2021 – 2032
8.5.5.4 Colombia
8.5.5.4.1 Battery-Free Sensors Market Size & Forecast, By Frequency, 2021 – 2032
8.5.5.4.2 Battery-Free Sensors Market Size & Forecast, By Sensor Type, 2021 – 2032
8.5.5.4.3 Battery-Free Sensors Market Size & Forecast, By Industry Vertical, 2021 – 2032
8.5.5.5 Rest of Latin America
8.5.5.5.1 Battery-Free Sensors Market Size & Forecast, By Frequency, 2021 – 2032
8.5.5.5.2 Battery-Free Sensors Market Size & Forecast, By Sensor Type, 2021 – 2032
8.5.5.5.3 Battery-Free Sensors Market Size & Forecast, By Industry Vertical, 2021 – 2032
8.6 Middle East & Africa
8.6.1 Key Trends
8.6.2 Battery-Free Sensors Market Size & Forecast, By Frequency, 2021 – 2032
8.6.3 Battery-Free Sensors Market Size & Forecast, By Sensor Type, 2021 – 2032
8.6.4 Battery-Free Sensors Market Size & Forecast, By Industry Vertical, 2021 – 2032
8.6.5 Battery-Free Sensors Market Size & Forecast, By Country, 2021 – 2032
8.6.5.1 UAE
8.6.5.1.1 Battery-Free Sensors Market Size & Forecast, By Frequency, 2021 – 2032
8.6.5.1.2 Battery-Free Sensors Market Size & Forecast, By Sensor Type, 2021 – 2032
8.6.5.1.3 Battery-Free Sensors Market Size & Forecast, By Industry Vertical, 2021 – 2032
8.6.5.2 Saudi Arabia
8.6.5.2.1 Battery-Free Sensors Market Size & Forecast, By Frequency, 2021 – 2032
8.6.5.2.2 Battery-Free Sensors Market Size & Forecast, By Sensor Type, 2021 – 2032
8.6.5.2.3 Battery-Free Sensors Market Size & Forecast, By Industry Vertical, 2021 – 2032
8.6.5.3 Qatar
8.6.5.3.1 Battery-Free Sensors Market Size & Forecast, By Frequency, 2021 – 2032
8.6.5.3.2 Battery-Free Sensors Market Size & Forecast, By Sensor Type, 2021 – 2032
8.6.5.3.3 Battery-Free Sensors Market Size & Forecast, By Industry Vertical, 2021 – 2032
8.6.5.4 Egypt
8.6.5.4.1 Battery-Free Sensors Market Size & Forecast, By Frequency, 2021 – 2032
8.6.5.4.2 Battery-Free Sensors Market Size & Forecast, By Sensor Type, 2021 – 2032
8.6.5.4.3 Battery-Free Sensors Market Size & Forecast, By Industry Vertical, 2021 – 2032
8.6.5.5 South Africa
8.6.5.5.1 Battery-Free Sensors Market Size & Forecast, By Frequency, 2021 – 2032
8.6.5.5.2 Battery-Free Sensors Market Size & Forecast, By Sensor Type, 2021 – 2032
8.6.5.5.3 Battery-Free Sensors Market Size & Forecast, By Industry Vertical, 2021 – 2032
8.6.5.6 Rest of Middle East & Africa
8.6.5.6.1 Battery-Free Sensors Market Size & Forecast, By Frequency, 2021 – 2032
8.6.5.6.2 Battery-Free Sensors Market Size & Forecast, By Sensor Type, 2021 – 2032
8.6.5.6.3 Battery-Free Sensors Market Size & Forecast, By Industry Vertical, 2021 – 2032
9. Competitive Landscape
9.1 Key Players' Positioning
9.2 Competitive Developments
9.2.1 Key Strategies Adopted (%), By Key Players, 2024
9.2.2 Year-Wise Strategies & Development, 2021 – 2025
9.2.3 Number Of Strategies Adopted By Key Players, 2024
9.3 Market Share Analysis, 2024
9.4 Product/Service & Application Benchmarking
9.4.1 Product/Service Specifications & Features By Key Players
9.4.2 Product/Service Heatmap By Key Players
9.4.3 Application Heatmap By Key Players
9.5 Industry Start-Up & Innovation Landscape
9.6 Key Company Profiles
9.6.1 Texas Instruments Inc.
9.6.1.1 Company Overview & Snapshot
9.6.1.2 Product/Service Portfolio
9.6.1.3 Key Company Financials
9.6.1.4 SWOT Analysis
9.6.2 STMicroelectronics N.V.
9.6.3 Infineon Technologies AG
9.6.4 ON Semiconductor Corporation
9.6.5 EnOcean GmbH
9.6.6 Everactive, Inc.
9.6.7 Axzon Inc.
9.6.8 Powercast Corporation
9.6.9 Farsens S.L.
9.6.10 Bridg Inc.
9.6.11 DCO Systems Ltd.
9.6.12 Inductosense Ltd.
9.6.13 Phase IV Engineering
9.6.14 Fuji Electric Co., Ltd.
9.6.15 General Electric
9.6.16 NXP Semiconductors N.V.
9.6.17 Analog Devices, Inc.
9.6.18 Broadcom Inc.
9.6.19 Robert Bosch GmbH
9.6.20 Sensirion AG
10. Analyst Recommendations
10.1 SNS Insider Opportunity Map
10.2 Industry Low-Hanging Fruit Assessment
10.3 Market Entry & Growth Strategy
10.4 Analyst Viewpoint & Suggestions On Market Growth
11. Assumptions
12. Disclaimer
13. Appendix
13.1 List Of Tables
13.2 List Of Figures
Key Segments
BY FREQUENCY
-
Low Frequency
-
High Frequency
-
Ultra-High Frequency
BY SENSOR TYPE
-
Light Sensors
-
Humidity/Moisture Sensors
-
Motion and Position Sensors
-
Others
BY INDUSTRY VERTICAL
-
Automotive
-
Logistics
-
Oil & Gas
-
IT & Telecommunications
-
Healthcare
-
Food & Beverages
-
Others
Request for Segment Customization as per your Business Requirement: Segment Customization Request
Regional Coverage:
North America
-
US
-
Canada
-
Mexico
Europe
-
Eastern Europe
-
Poland
-
Romania
-
Hungary
-
Turkey
-
Rest of Eastern Europe
-
-
Western Europe
-
Germany
-
France
-
UK
-
Italy
-
Spain
-
Netherlands
-
Switzerland
-
Austria
-
Rest of Western Europe
-
Asia Pacific
-
China
-
India
-
Japan
-
South Korea
-
Vietnam
-
Singapore
-
Australia
-
Rest of Asia Pacific
Middle East & Africa
-
Middle East
-
UAE
-
Egypt
-
Saudi Arabia
-
Qatar
-
Rest of Middle East
-
-
Africa
-
Nigeria
-
South Africa
-
Rest of Africa
-
Latin America
-
Brazil
-
Argentina
-
Colombia
-
Rest of Latin America
Request for Country Level Research Report: Country Level Customization Request
Available Customization
-
With the given market data, SNS Insider offers customization as per the company’s specific needs. The following customization options are available for the report:
-
Product Analysis
-
Criss-Cross segment analysis (e.g. Product X Application)
-
Product Matrix which gives a detailed comparison of product portfolio of each company
-
Geographic Analysis
-
Additional countries in any of the regions
-
Company Information
-
Detailed analysis and profiling of additional market players (Up to five)
An accurate research report requires proper strategizing as well as implementation. There are multiple factors involved in the completion of good and accurate research report and selecting the best methodology to compete the research is the toughest part. Since the research reports we provide play a crucial role in any company’s decision-making process, therefore we at SNS Insider always believe that we should choose the best method which gives us results closer to reality. This allows us to reach at a stage wherein we can provide our clients best and accurate investment to output ratio.
Each report that we prepare takes a timeframe of 350-400 business hours for production. Starting from the selection of titles through a couple of in-depth brain storming session to the final QC process before uploading our titles on our website we dedicate around 350 working hours. The titles are selected based on their current market cap and the foreseen CAGR and growth.
The 5 steps process:
Step 1: Secondary Research:
Secondary Research or Desk Research is as the name suggests is a research process wherein, we collect data through the readily available information. In this process we use various paid and unpaid databases which our team has access to and gather data through the same. This includes examining of listed companies’ annual reports, Journals, SEC filling etc. Apart from this our team has access to various associations across the globe across different industries. Lastly, we have exchange relationships with various university as well as individual libraries.

Step 2: Primary Research
When we talk about primary research, it is a type of study in which the researchers collect relevant data samples directly, rather than relying on previously collected data. This type of research is focused on gaining content specific facts that can be sued to solve specific problems. Since the collected data is fresh and first hand therefore it makes the study more accurate and genuine.
We at SNS Insider have divided Primary Research into 2 parts.
Part 1 wherein we interview the KOLs of major players as well as the upcoming ones across various geographic regions. This allows us to have their view over the market scenario and acts as an important tool to come closer to the accurate market numbers. As many as 45 paid and unpaid primary interviews are taken from both the demand and supply side of the industry to make sure we land at an accurate judgement and analysis of the market.
This step involves the triangulation of data wherein our team analyses the interview transcripts, online survey responses and observation of on filed participants. The below mentioned chart should give a better understanding of the part 1 of the primary interview.

Part 2: In this part of primary research the data collected via secondary research and the part 1 of the primary research is validated with the interviews from individual consultants and subject matter experts.
Consultants are those set of people who have at least 12 years of experience and expertise within the industry whereas Subject Matter Experts are those with at least 15 years of experience behind their back within the same space. The data with the help of two main processes i.e., FGDs (Focused Group Discussions) and IDs (Individual Discussions). This gives us a 3rd party nonbiased primary view of the market scenario making it a more dependable one while collation of the data pointers.
Step 3: Data Bank Validation
Once all the information is collected via primary and secondary sources, we run that information for data validation. At our intelligence centre our research heads track a lot of information related to the market which includes the quarterly reports, the daily stock prices, and other relevant information. Our data bank server gets updated every fortnight and that is how the information which we collected using our primary and secondary information is revalidated in real time.

Step 4: QA/QC Process
After all the data collection and validation our team does a final level of quality check and quality assurance to get rid of any unwanted or undesired mistakes. This might include but not limited to getting rid of the any typos, duplication of numbers or missing of any important information. The people involved in this process include technical content writers, research heads and graphics people. Once this process is completed the title gets uploader on our platform for our clients to read it.
Step 5: Final QC/QA Process:
This is the last process and comes when the client has ordered the study. In this process a final QA/QC is done before the study is emailed to the client. Since we believe in giving our clients a good experience of our research studies, therefore, to make sure that we do not lack at our end in any way humanly possible we do a final round of quality check and then dispatch the study to the client.