Ethernet Switch Market Size & Trends:
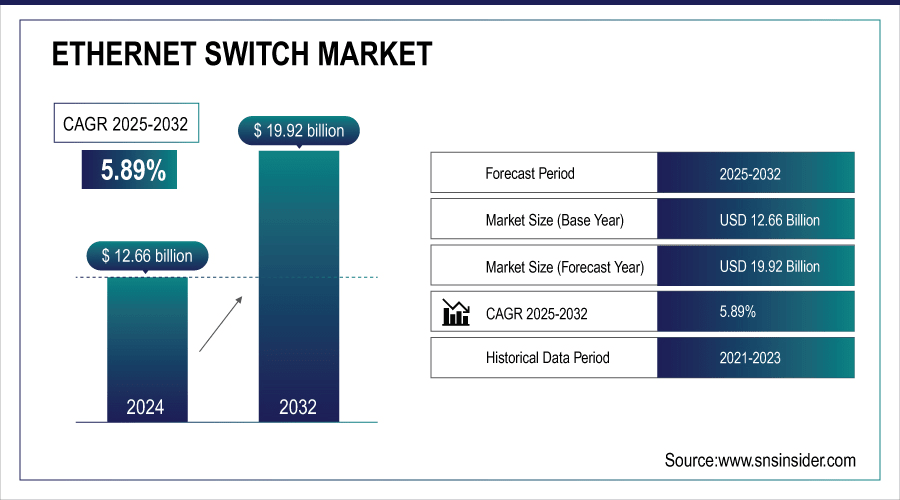
The Ethernet Switch Market Size was valued at USD 12.66 billion in 2024 and is expected to reach USD 19.92 billion by 2032 and grow at a CAGR of 5.89% over the forecast period of 2025-2032.
The global market report is a comprehensive ethernet switch market analysis segmented by type, configuration, speed, end-user, and region with competitive landscape. This is driven by the rise in enterprise digitization, the proliferation of cloud computing infrastructures, and increasing data center deployments. With the accelerated growth of new, bandwidth-intensive applications in various industries, advancement in high-speed networking technologies is supporting these applications. Taken together, these factors fuel demand for ethernet switches and lead to widespread adoption in enterprises of all sizes, service providers, industrial applications, and emerging digital transformation efforts globally.
For instance, adoption of 100G and above Ethernet ports has doubled over the past three years, accounting for over 60% of new switch deployments in hyperscale facilities.
Ethernet Switch Market Size and Forecast:
-
Market Size in 2024: USD 12.66 Billion
-
Market Size by 2032: USD 19.92 Billion
-
CAGR: 5.89% from 2025 to 2032
-
Base Year: 2024
-
Forecast Period: 2025–2032
-
Historical Data: 2021–2023
To Get More Information On Ethernet Switch Market - Request Free Sample Report
Ethernet Switch Market Trends:
-
Rising demand for high-speed data transmission driven by cloud computing, AI workloads, and data center expansion is accelerating Ethernet switch adoption.
-
Increasing deployment of 5G networks and edge computing infrastructure is boosting demand for high-performance and low-latency switching solutions.
-
Growing enterprise digital transformation initiatives are supporting the integration of managed and smart Ethernet switches.
-
Expansion of hyperscale data centers and colocation facilities is increasing investments in high-capacity 25G, 100G, and 400G Ethernet switches.
-
Technological advancements such as software-defined networking (SDN) and network automation are enhancing scalability, flexibility, and operational efficiency.
-
Rising adoption across industrial IoT, smart cities, and connected devices is expanding the market footprint globally.
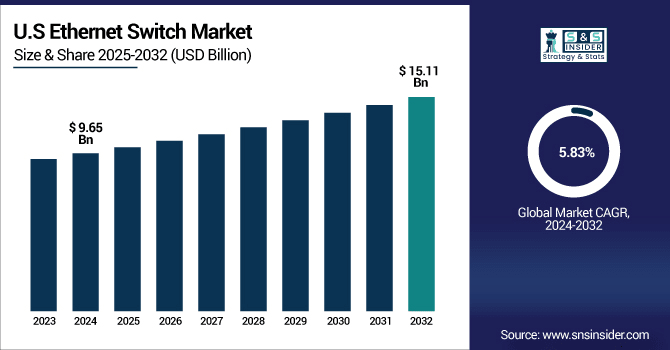
The U.S. ethernet switch market size was USD 9.65 billion in 2024 and is expected to reach USD 15.11 billion by 2032, growing at a CAGR of 5.83% over the forecast period of 2025–2032.
The U.S. market growth is driven by hyperscale data center expansion, edge computing adoption, and enterprise IT infrastructure. Rapid investment in 5G Networks and IoT deployments to drive demand for high-speed, low-latency ethernet switches as modern day ethernet network devices capable of managing large volumes of data traffic. Strong digitalization trends are accelerating ethernet switch market growth across multiple sectors. These innovations are improving network efficiency and scalability, helping industries from cloud service, and telecom, to industrial applications, and smart infrastructure growth.
For instance, over 70% of the U.S. population now has access to 5G coverage, driving higher backhaul and edge network traffic.
Ethernet Switch Market Key Drivers:
-
Rising Demand for High-Speed Networking to Support Data-Intensive Applications Across Enterprises and Data Centers
High-speed networking demand is fueled by increased dependence on cloud services, video conferencing, streaming, AI workloads, and IoT applications. Ethernet switches are critical in minimizing latency while moving data between devices, servers, and storage systems. More enterprises and data centers are upgrading to high-speed switches such as 10G, 25G, and 100G as the workloads are bandwidth heavy. Rapid investment in high-performance Ethernet switching solutions with hyperscale data center operators to support exponential data growth, which is driving continued market demand in multiple sectors.
For instance, over 85% of enterprise workloads are now processed in cloud data centers.
Ethernet Switch Market Restraints:
-
High Initial Investment and Upgrade Costs for Advanced Ethernet Switching Infrastructure
Advanced Ethernet switches at 100G represent higher layers of capital equipment cost, requiring investments in supporting technologies as well. The enterprises also incur additional costs for re-designing their networks for 5G, training the staff, and integrating their legacy infrastructure with 5G. This creates expenses that smaller businesses, in particular, need time to recover from, so there is a delay in adoption. In addition, frequent technology refresh cycles due to evolving networking standards hinder organizations from attaining a long ROI (return on investment), thereby restricting the adoption of high-end Ethernet switch in particular markets.
Ethernet Switch Market Opportunities:
-
Adoption of Ethernet Switches in 5G Infrastructure and Edge Computing Deployments
The global deployment of 5G networks and the greater move to edge computing will drive Ethernet switch adoption. It will definitely need a low-latency and high-capacity processing capacity at the edge to handle it. Ethernet switches are used to interconnect small cells, edge devices, and distributed data centers. With 5G and edge deployments rolling out at scale this decade by telecom operators, cloud providers, and enterprises, the demand for compact, high-bandwidth, dense network switches will grow exponentially over the coming years. Current ethernet switch market trends highlight innovation in edge-optimized switching solutions.
For instance, over 40% of new edge switches integrate AI-driven traffic optimization by 2026.
Ethernet Switch Market Challenges:
-
Increasing Cybersecurity Risks Associated with Networked Devices and Ethernet Switching Systems
As ethernet switches connect more critical systems/devices, they are, naturally, becoming attractive targets for cyberattacks and this is even more important for the electrical and electronic systems since a successful cyberattack can lead to catastrophic consequences. Issues, such as unauthorized access, data breaches, and malware infections can hamper operations and put sensitive information at risk. The difficulty is striking the right balance between solid security while maintaining network performance. While these switch features are security-focused and available commercially, organizations must implement cost-prohibitive enterprise-grade encryption, greater authentication and intrusion detection capabilities across large-scale environments containing multi-vendor switches. For stakeholders in the ethernet switch industry, cybersecurity is an ongoing problem.
Ethernet Switch Market Segmentation Analysis:
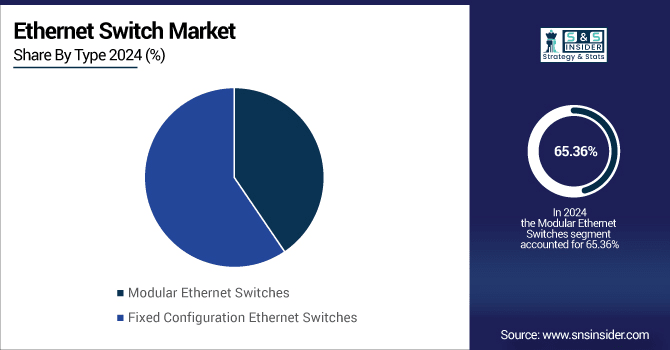
By Type
In 2024, the converging lens accounted for the largest revenue share of 65.36% as it is commonly used in imaging systems, cameras, and corrective eyewear. The efficient focusing of light corrects for aberrations, and are an important element in any application where light accuracy is key. Sustained demand is backed by the use of high-performance converging lenses in popular professional camera systems held by companies, such as Canon Inc. This runs hand in hand in re-establishing their market leader’s presence in both consumer and industrial optics.
The diverging lens segment is estimated to register fastest CAGR growth of about 8.95% during the forecast period of 2024–2032 owing to the rising employment in laser beam expanders, scientific apparatus, and correcting optics for nearsightedness. Specifically, new growth in niche applications, such as AR/VR, is spurring this trend to come on faster. As an example, Nikon Corporation recently announced lightweight diverging lenses for specialized optical systems, which is stimulating innovation and growth in the segment.
By Application
In 2024, the microscopy segment held the largest share of revenue at 30.20% and is estimated to maintain this trend through the forecast period as most of the optical imaging in research, pathology, and diagnostics predominantly rely on microscopy. In some sophisticated microscopes, these lenses improve magnification and resolution. ZEISS Group is a leading global supplier of microscopy solutions and precision optical lenses important to the worlds of science, and by extension, continues to bolster the segment leadership of research institutions and laboratories globally.
Ophthalmic segment is anticipated to grow at the fastest CAGR of 9.34% through 2024–2032, due to increasing cases of visual impairment and rising consumer awareness regarding eye health. Moreover, the rising prevalence of lifestyle associated disorders has further fueled the growth of prescription eyewear market. Innovation efforts directed at lightweight, adaptive, and blue-light-filtering lenses by companies, such as EssilorLuxottica are paving the way for greater acceptance of ophthalmic lenses among people of all ages, ultimately driving growth in the market as a whole.
By Speed
In 2024, 10G switches represented 32.30% of the ethernet switch market share with positive support in enterprise networks, data centers, and high-performance computing settings. That advantage, combined with their enticing ability to offer higher throughput, low latency, and provision of reliable connectivity for bandwidth-heavy applications led to them becoming the de-facto choice. Companies, such as Arista Networks, Inc. have been key to leading the way in the adoption of 10G solutions. Introduction with increased need to higher data transfer rates, 10G switches always considered to be a fundamental element of newly developed IT infrastructure.
The 1G segment is anticipated to grow at the fastest CAGR of 7.08%, due to its low-cost nature and ability to work with existing infrastructure. Even today, these switches are very applicable to small to medium-sized businesses, branch offices, or companies that are more budget-sensitive. 1G continues to provide low-cost solutions to manufacturers (TP-Link Technologies Co., Ltd.). In many, their ease of deployment and low-resource nature make a practical solution, especially in emerging markets improving incrementally from low speeds to higher speed networking.
By End-User
In 2024, Data Centers led the market by accounting for 34.12% of revenue, driven by explosive demand for cloud services, hyperscale facilities, and high-capacity computing environments. Thus, within these facilities, high levels of connectivity, both fast and safe, are ensured through the use of Ethernet switches. Till the date, Dell Technologies, Inc. has been a key technology supplier of enterprise-class high-capacity switches to data centers globally. Ongoing trend toward both real-time processing with low latency, new AI workloads needing low-latency paired with high-bandwidth bringing DRAM speeds to compute for new style workloads continues to make data centers the largest consumer of Ethernet switch technologies globally.
The Industrial segment is projected to record the highest CAGR growth of 7.58% during 2024–2032, owing to the rising trend towards Industry 4.0 automation and IoT-enabled production systems. Ruggedized Ethernet switches are installed in industrial plants, power grids, and transportation networks. For instance, industrial-grade Ethernet switches which can handle extreme conditions, similar to the one proposed by Siemens AG. As industrial applications need real-time data exchange, remote monitoring, and predictive maintenance, it is one of the fastest-growing end-user categories.
Ethernet Switch Market Regional Outlook:
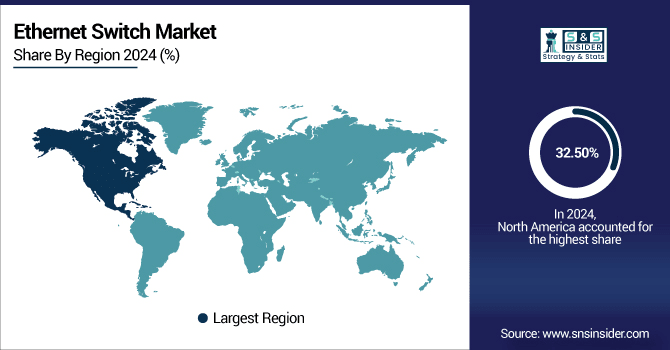
In 2024, North America dominated the ethernet switch market, earning a 32.50% share, owing to the important focus on hyper scale data centers in the region, earliest acceptance of next generation networking technologies, and high investments in IT infrastructure. We are seeing fast-paced enterprise network modernization in the region to facilitate cloud computing, AI, and edge applications. The region is set to maintain its leading position in the global market, propelled by strong demand from telecom, BFSI, and government sectors.
Get Customized Report as per Your Business Requirement - Enquiry Now
-
The U.S. dominates the North American ethernet switch market due to its concentration of hyperscale data centers, advanced IT infrastructure, early adoption of high-speed networking technologies, and significant investments by major technology companies and cloud service providers.
The Asia Pacific region will register the highest CAGR of 6.56% during the forecast period (2024–2032) due to fast urbanization, development of different manufacturing hubs, and rising investment in telecoms and smart city projects. Increasing internet users due to digitalization initiatives undertaken by various governments of the region and rising 5G adoption is anticipated to propel the demand for high-bandwidth Ethernet switches. This is now driving large-scale infrastructure upgrades in countries such as China, India, and Japan and is one of the big growth engines for industrial automation trends.
-
China leads the Asia Pacific ethernet switch market driven by its large-scale manufacturing base, rapid 5G rollout, extensive smart city initiatives, and strong government-backed digitalization programs, supported by domestic tech giants producing advanced, cost-competitive networking solutions for both local and global markets.
Europe’s ethernet switch market is driven by the region’s strong digital infrastructure, widespread adoption of cloud services, and rapid expansion of data centers. The rise of Industry 4.0, smart manufacturing, and IoT integration is boosting demand for high-speed networking solutions. Supportive government policies and investments in 5G networks further strengthen market growth across key European economies.
-
Germany leads the European ethernet switch market owing to its advanced manufacturing sector, strong Industry 4.0 adoption, and robust data center infrastructure. High IT investments and expertise in industrial networking solidify its dominance over France, the U.K., Italy, and Spain.
In the Middle East & Africa, the UAE dominates the ethernet switch market with advanced smart city initiatives, robust data centers, and rapid 5G rollout. In Latin America, Brazil leads due to its expanding telecom sector, rising cloud adoption, and substantial investments in modernizing IT and networking infrastructure.
Ethernet Switch Companies are:
-
Cisco Systems, Inc.
-
Huawei Technologies Co., Ltd.
-
Hewlett Packard Enterprise
-
Juniper Networks, Inc.
-
Dell Technologies, Inc.
-
NETGEAR, Inc.
-
TP-Link Technologies Co., Ltd.
-
D-Link Corporation
-
Allied Telesis, Inc.
-
Fortinet, Inc.
-
Avaya LLC
-
Mellanox Technologies
-
MikroTik
-
Zyxel Networks
-
Ubiquiti Inc.
-
Siemens AG
-
Fujitsu Limited
-
Brocade Communications Systems, Inc
Recent Developments:
-
In June 2025, HPE launched the SN8325H half-width storage Ethernet switch, optimized for compact, cost-effective, and energy-efficient storage networking in hyperconverged and storage-centric deployments.
-
In July 2025, Broadcom introduced the Tomahawk Ultra, a high-performance Ethernet switch tailored for AI and HPC workloads, offering ultra-low latency, lossless networking and sub-microsecond switching for AI data centers.
| Report Attributes | Details |
|---|---|
| Market Size in 2024 | USD 12.66 Billion |
| Market Size by 2032 | USD 19.92 Billion |
| CAGR | CAGR of 5.89% From 2025 to 2032 |
| Base Year | 2024 |
| Forecast Period | 2025-2032 |
| Historical Data | 2021-2023 |
| Report Scope & Coverage | Market Size, Segments Analysis, Competitive Landscape, Regional Analysis, DROC & SWOT Analysis, Forecast Outlook |
| Key Segments | • By Type (Modular Ethernet Switches and Fixed Configuration Ethernet Switches) • By Configuration (Unmanaged, Smart, Managed L2, Managed L3 and Divided) • By Speed (1G, 10 G, 25 G, 40 G, 100 G and Others) • By End-User (Data Centers, Enterprises, Telecom Service Providers, Industrial, Commercial and Others) |
| Regional Analysis/Coverage | North America (US, Canada, Mexico), Europe (Germany, France, UK, Italy, Spain, Poland, Turkey, Rest of Europe), Asia Pacific (China, India, Japan, South Korea, Singapore, Australia,Taiwan, Rest of Asia Pacific), Middle East & Africa (UAE, Saudi Arabia, Qatar, South Africa, Rest of Middle East & Africa), Latin America (Brazil, Argentina, Rest of Latin America) |
| Company Profiles | Cisco Systems, Inc., Huawei Technologies Co., Ltd., Arista Networks, Inc., Hewlett Packard Enterprise, Juniper Networks, Inc., Dell Technologies, Inc., Extreme Networks, Inc., NETGEAR, Inc., TP-Link Technologies Co., Ltd., D-Link Corporation, Allied Telesis, Inc., Fortinet, Inc., Avaya LLC, Mellanox Technologies, MikroTik, Zyxel Networks, Ubiquiti Inc., Siemens AG, Fujitsu Limited and Brocade Communications Systems, Inc. |
Frequently Asked Questions
North America dominated the Ethernet Switch Market in 2024.
The Managed L3 segment dominated the Ethernet Switch Market in 2024.
The major growth factor is rising enterprise digitization, expanding cloud infrastructure, and increasing demand for high-speed, low-latency networking solutions.
The Ethernet Switch Market size was USD 12.66 Billion in 2024 and is expected to reach USD 19.92 Billion by 2032.
The Ethernet Switch Market is expected to grow at a CAGR of 5.89% from 2025-2032.
Get in Touch
