Ferro Liquid Display Market Report Scope & Overview:
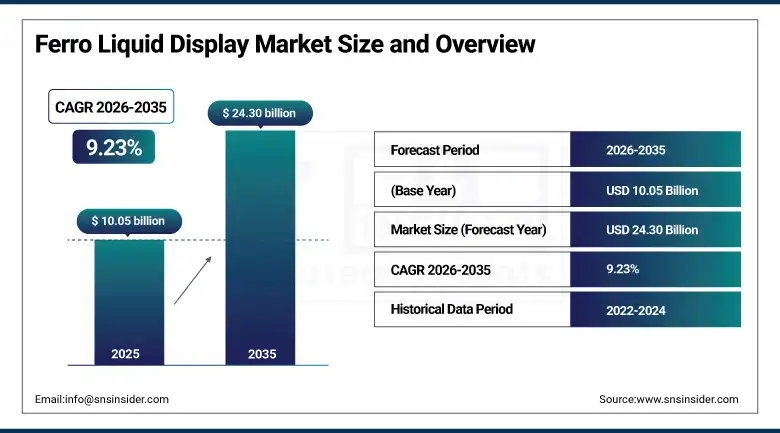
The Ferro Liquid Display Market was valued at USD 10.05 Billion in 2025 and is projected to reach USD 24.30 Billion by 2035, growing at a CAGR of 9.23% from 2026 to 2035.
Ferro liquid display technology represents an advanced segment of the global display industry that leverages the unique electro-optical properties of ferroelectric liquid crystals or magnetically responsive ferrofluid suspensions to achieve display characteristics that conventional liquid crystal display technology cannot match. The ferroelectric liquid crystal variant of FLD exploits the bistable, fast-switching characteristics of ferroelectric molecular alignment to deliver display refresh rates, contrast performance, and power efficiency profiles that position it as a premium alternative to conventional TN and IPS LCD configurations in high-performance applications including scientific instrumentation, military head-up displays, industrial process control interfaces, and advanced computing monitors where refresh rate and image quality are primary specification requirements. The broader market context for FLD technology is the intensifying competition within the global display technology landscape. FLD's strongest competitive positioning is in applications requiring fast switching speeds below 100 microseconds for robust operational performance across extended temperature ranges that standard LCD configurations struggle to maintain in automotive, aerospace, and military deployment contexts.
Samsung Electronics demonstrated a prototype ferroelectric liquid crystal display panel at CES 2025 that achieved a 240 Hz native refresh rate with less than 80 microsecond response time and a 100,000:1 static contrast ratio, targeted at professional gaming monitor and high-performance computing display applications. The demonstration signalled Samsung's strategic commitment to commercializing next-generation FLD technology above its existing OLED and quantum dot LCD panel portfolios.
Market Size and Forecast
-
Market Size in 2026E: USD 10.98 Billion
-
Market Size by 2035: USD 24.30 Billion
-
CAGR: 9.23% from 2026 to 2035
-
Fastest Growing Region: Asia Pacific
-
Largest Region: North America
To Get more information On Ferro Liquid Display Market - Request Free Sample Report
Ferro Liquid Display Market Trends
-
Fast refresh ferroelectric liquid crystal displays enable sub-millisecond response and 240 Hz+ performance for gaming and high-performance computing.
-
Automotive adoption is growing due to wide temperature stability, low power use, and superior visibility in varying lighting conditions.
-
Defense and aerospace demand is increasing for rugged FLD panels in cockpit, tactical, and airborne mission-critical display systems.
-
Medical imaging applications are evaluating FLD displays for high contrast and grey-scale precision in diagnostics and surgical navigation.
-
AI-driven calibration systems are improving FLD performance through adaptive brightness control and energy-efficient display optimisation.
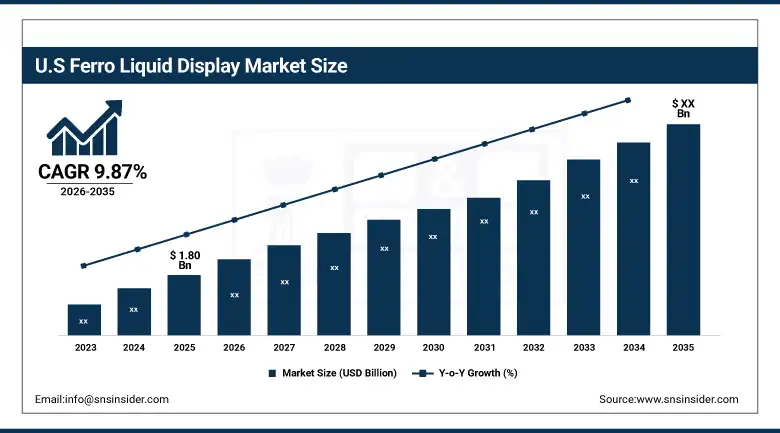
The U.S. Ferro Liquid Display Market Outlook
The U.S. ferro liquid display market was valued at approximately USD 1.80 Billion in 2025 and is expected to grow at a CAGR of approximately 9.87% from 2026 to 2035.
The United States is the dominant national market for ferro liquid display technology globally. The U.S. Department of Defense represents the most commercially significant institutional FLD customer globally, with programmes including advanced fighter aircraft cockpit display modernisation, naval vessel tactical display upgrades, and battlefield soldier system integration creating sustained high-value FLD procurement that is largely independent of commercial market cycle dynamics. U.S. medical device manufacturers and hospital procurement organizations are evaluating FLD technology for diagnostic imaging workstation upgrades where the technology's grey-scale performance and response time advantages over conventional LCD monitors can improve radiologist interpretation workflow efficiency and reduce misdiagnosis risk.
Rockwell Collins (RTX), now known as Collins Aerospace, successfully conducted qualification tests on its new ferroelectric liquid crystal head-up display system designed for use in next-generation military aircraft in 2025, showcasing successful performance from minus 55 to plus 85 degrees Celsius in sunlight with a minimum luminance level of 500 nits. This accomplishment means that the FLC technology will be ready to be used in future military aircraft.
Ferro Liquid Display Market Segment Analysis
-
By Display Type, the electromagnetic displays segment dominated the market with 52.36% share in 2025, while the electropermanent displays segment is the fastest growing type during 2026 to 2035.
-
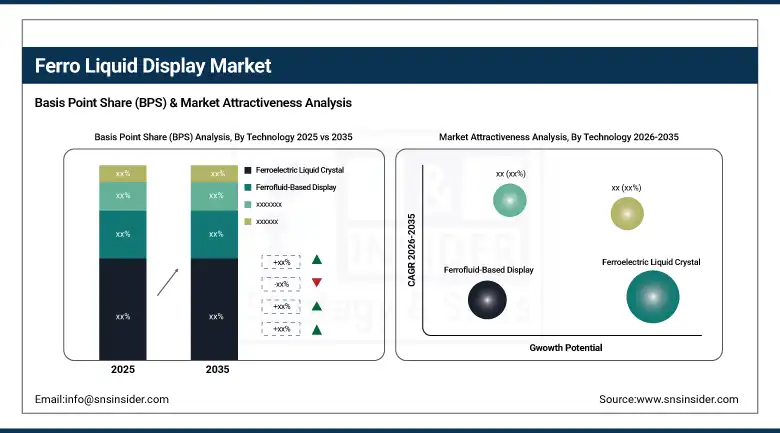
By Technology, the ferroelectric liquid crystal segment dominated the market with 68.74% share in 2025, while the ferrofluid-based display segment is the fastest growing technology during 2026 to 2035.
-
By Application, the consumer electronics segment dominated the market with 38.47% share in 2025, while the automotive displays segment is the fastest growing application during 2026 to 2035.
-
By End User, the commercial segment dominated the market with 46.28% share in 2025, while the industrial segment is the fastest growing end user during 2026 to 2035.
By Technology, ferroelectric liquid crystal dominates, ferrofluid-based displays grow fastest
The ferroelectric liquid crystal technology segment accounted for 68.74% of ferro liquid display market revenue in 2025. Ferroelectric liquid crystals achieve microsecond switching speeds by exploiting the spontaneous electric polarization of ferroelectric molecular phases whose rapid directional response to applied electric fields enables display refresh rates and motion clarity that conventional nematic liquid crystal displays cannot achieve without significant motion artefact. The commercialization of manufacturable ferroelectric liquid crystal panel production processes by manufacturers including Fujitsu, Samsung, and LG Display has progressively brought FLC technology within economically viable range for premium commercial display applications.
The ferrofluid-based display segment is growing fastest from a smaller commercial base, driven by expanding interest in its unique aesthetic and functional properties for premium retail environments, artistic installations, and experimental automotive interior design applications where the magnetically controlled flowing patterns of ferrofluid create visual experiences that no competing display technology can replicate.
By Application, consumer electronics dominate, automotive displays grow fastest
Consumer electronics was a major contributor to the FLD market revenues, accounting for 38.47% in 2025. This is attributable to the wide variety of products in the consumer electronics group ranging from gaming monitors to advanced smartphone and tablet displays. The professional gaming monitor segment has been a commercially significant FLD growth driver as competitive gaming's population and prize ecosystem growth has motivated players and enthusiast consumers to invest in display hardware whose response time and refresh rate specifications deliver measurable gameplay performance advantages.
Automotive displays are growing fastest as the automotive industry's comprehensive digital instrument cluster and infotainment system transformation creates demand for display panels whose performance specifications, including wide operating temperature range, high contrast at varying ambient luminance, and resistance to vibration and electromagnetic interference, position FLD technology as a technically superior alternative to conventional automotive LCD and OLED panels in demanding in-vehicle deployment environments.
Regional Analysis
|
Region |
Major Country |
Share within Region, 2025 (%) |
|---|---|---|
|
North America |
United States |
84.73% |
|
Europe |
Germany |
28.47% |
|
Asia Pacific |
China |
46.28% |
|
Middle East & Africa |
Israel |
24.73% |
|
Latin America |
Brazil |
43.84% |
North America Ferro Liquid Display Market Insights
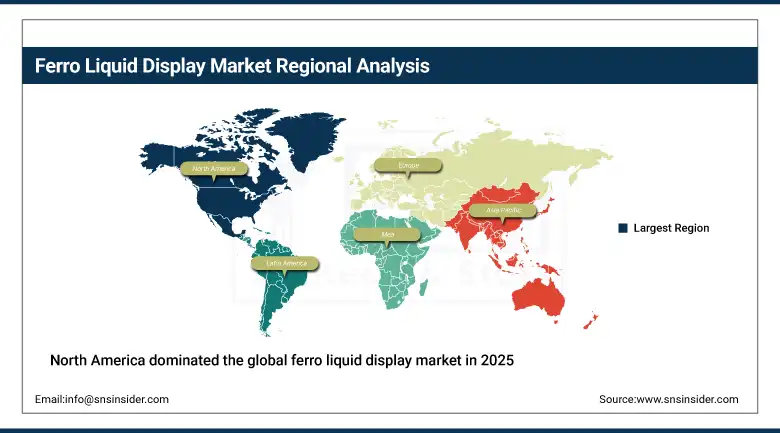
North America dominated the global ferro liquid display market in 2025, holding approximately 38.30% of global revenues. The United States accounts for approximately 84.73% of regional revenue through its defense and aerospace procurement programmes, its leadership in high-performance computing and professional gaming hardware markets, and the concentration of advanced medical imaging technology manufacturers whose product lines include the diagnostic display applications that FLD technology's performance profile serves. The U.S. defense sector's multi-decade display modernisation programmes represent the most financially significant and contractually stable FLD procurement source globally, providing revenue visibility that underpins manufacturer investment in military-specification FLD panel development. Canada contributes supplementary demand through its aerospace component manufacturing sector and its participation in joint NATO defense procurement programmes that specify FLD panel technology across allied force modernisation initiatives.
Get Customized Report as per Your Business Requirement - Enquiry Now
Europe Ferro Liquid Display Market Insights
Europe held approximately 24.73% of global ferro liquid display revenues in 2025. Germany, France, the United Kingdom, and Sweden are the primary national markets, each hosting significant defense electronics, automotive systems, industrial instrumentation, and medical technology manufacturing sectors whose FLD procurement requirements collectively constitute a commercially significant European market. The European Defense Fund's investment in display technology for next-generation European defense platforms and the automotive industry's comprehensive digital cockpit transformation programme create two large and structurally sustained demand drivers for FLD technology adoption across the European market. Germany accounts for approximately 28.47% of European revenues through its automotive manufacturing sector's systematic instrument cluster and infotainment display quality improvement programmes and its industrial automation sector's demand for high-performance human-machine interface displays.
Asia Pacific Ferro Liquid Display Market Insights
Asia Pacific is the fastest-growing regional ferro liquid display market, projected to expand at a CAGR of approximately 11.84% through 2035, driven by the region's dominant role in global display panel manufacturing, the rapid growth of its automotive electronics sector, expanding defense modernisation budgets, and the large and commercially active consumer electronics markets of China, South Korea, Japan, and Taiwan. China accounts for approximately 46.28% of Asia Pacific revenues through its enormous consumer electronics manufacturing ecosystem, its growing domestic automotive display supply chain, and increasing defense electronics procurement that is including advanced display panel specifications in next-generation military equipment programmes. South Korea and Japan contribute premium technology revenues through the global display panel manufacturing leadership of Samsung, LG Display, AUO, and Sharp whose FLD technology development and commercialization programmes are among the most advanced globally.
MEA & Latin America Ferro Liquid Display Market Insights
Middle East and Latin America are smaller but growing ferro liquid display markets where expanding defense procurement programmes, growing automotive assembly sector investment, and increasing consumer electronics market sophistication are creating emerging commercial demand. Israel leads MEA revenues at approximately 24.73% of the regional total through its globally significant defense electronics industry whose advanced avionics, surveillance system, and military vehicle display technology programmes create technically demanding FLD procurement requirements. The UAE and Saudi Arabia are investing in military display technology modernisation as components of their broader defense capability development programmes under Vision 2030 and analogous national transformation initiatives. Brazil leads Latin American revenues through its automotive manufacturing sector and its growing defense electronics industry whose equipment programmes increasingly specify advanced display technologies.
Market Dynamics
Growth Drivers: Defense sector modernisation investment and automotive digital cockpit transformation are creating market growth across the forecast period.
The global defense sector's systematic replacement of legacy cockpit, tactical, and field display systems with next-generation digital alternatives is a commercially significant long-cycle demand driver for FLD technology. Military display specifications mandating wide temperature range operation, high luminance under solar exposure, vibration resistance, and response speeds compatible with targeting system data rates create a requirement profile that FLD technology addresses more comprehensively than competing display alternatives. The automotive industry's transition from analogue instrument clusters to fully digital cockpit architectures across all vehicle segments creates an enormous and sustained display panel procurement programme whose annual volume, multiplied across global automotive production of approximately 90 million vehicles, represents a market opportunity whose scale dwarfs the existing FLD commercial base.
Restraints: High manufacturing complexity and cost relative to established LCD technology and strong competition from OLED panels.
The manufacturing process for ferroelectric liquid crystal panels requires precise molecular alignment, contamination-controlled clean room environments, and proprietary material formulations whose production cost substantially exceeds equivalent conventional LCD panels. This premium restricts FLD adoption to applications where performance requirements genuinely justify the price differential. With OLED technology progressing rapidly in terms of refresh rate, contrast levels, and flexibility, the gap between the two technologies is being eroded, making FLD the only viable choice for high-performance displays, thus pushing manufacturers of FLD technology to continue improving their technology offerings in order to stay ahead.
Opportunities: AI-integrated display management systems and expanding medical imaging display applications represent development frontiers for FLD technology providers.
The integration of AI-driven adaptive display management with FLD panel hardware represents an emerging commercial opportunity that can significantly expand FLD's competitive value proposition beyond raw panel specifications. AI systems that dynamically calibrate FLD panel performance parameters including luminance, refresh rate, and contrast in real time based on ambient conditions, displayed content type, and user behaviour patterns can deliver user experiences that fixed-specification display panels cannot match. Medical imaging represents a particularly high-value application development frontier for FLD technology. Radiological workstation displays whose grey-scale precision, luminance uniformity, and response time directly affect diagnostic interpretation accuracy and physician fatigue management are evaluated under DICOM display performance standards that FLD technology's specifications satisfy at quality levels that justify premium medical display pricing.
Recent Developments:
-
2025: Samsung Electronics demonstrated a prototype ferroelectric liquid crystal display achieving 240 Hz refresh rate with sub-80 microsecond response time and 100,000:1 contrast ratio at CES 2025, targeting professional gaming and high-performance computing display markets.
-
2025: Collins Aerospace (RTX) completed qualification of a ferroelectric liquid crystal head-up display system for advanced military aircraft operating across a minus 55 to plus 85 degrees Celsius temperature range.
-
2024: LG Display advanced the commercial development of its ferroelectric liquid crystal automotive instrument cluster panel series, completing automotive qualification testing under AEC-Q100 standards and securing design-in agreements with European luxury vehicle OEM programmes for digital cockpit integration in model year 2026 and beyond.
Ferro Liquid Display Market key players are:
-
Samsung Electronics Co. Ltd.
-
LG Display Co. Ltd.
-
Fujitsu Limited
-
Toshiba Corporation
-
NEC Display Solutions Ltd.
-
HannStar Display Corporation
-
AU Optronics Corporation
-
Himax Technologies Inc.
-
Sharp Corporation
-
Collins Aerospace (RTX)
-
Sony Corporation
-
BAE Systems PLC
-
Avegant Corporation
-
DisplayMate Technologies Corporation
-
MDCA Inc.
-
Panasonic Corporation
-
Tianma Microelectronics Co. Ltd.
-
BOE Technology Group Co. Ltd.
-
E Ink Holdings Inc.
-
Ferrolic BV
Ferro Liquid Display Market Report Scope:
| Report Attributes | Details |
|---|---|
| Market Size in 2025 | USD 10.05 Billion |
| Market Size by 2035 | USD 24.30 Billion |
| CAGR | CAGR of 9.23% From 2026 to 2035 |
| Base Year | 2025 |
| Forecast Period | 2026-2035 |
| Historical Data | 2022-2024 |
| Report Scope & Coverage | Market Size, Segments Analysis, Competitive Landscape, Regional Analysis, DROC & SWOT Analysis, Forecast Outlook |
| Key Segments | • By Display Type (Electropermanent Displays, Electromagnetic Displays, Passive Magnetic Displays) • By Technology (Ferroelectric Liquid Crystal, Ferrofluid-Based Display, Others) • By Application (Consumer Electronics, Automotive Displays, Advertising & Digital Signage, Medical Displays & Imaging, Industrial Instrumentation, Military & Defense) • By End User (Commercial, Industrial, Residential, Government & Defense) |
| Regional Analysis/Coverage | North America (US, Canada), Europe (Germany, UK, France, Italy, Spain, Russia, Poland, Rest of Europe), Asia Pacific (China, India, Japan, South Korea, Australia, ASEAN Countries, Rest of Asia Pacific), Middle East & Africa (UAE, Saudi Arabia, Qatar, South Africa, Rest of Middle East & Africa), Latin America (Brazil, Argentina, Mexico, Colombia, Rest of Latin America). |
| Company Profiles | Samsung Electronics Co. Ltd., LG Display Co. Ltd., Fujitsu Limited, Toshiba Corporation, NEC Display Solutions Ltd., HannStar Display Corporation, AU Optronics Corporation, Himax Technologies Inc., Sharp Corporation, Collins Aerospace (RTX), Sony Corporation, BAE Systems PLC, Avegant Corporation, DisplayMate Technologies Corporation, MDCA Inc., Panasonic Corporation, Tianma Microelectronics Co. Ltd., BOE Technology Group Co. Ltd., E Ink Holdings Inc., Ferrolic BV |
Frequently Asked Questions
North America dominated the ferro liquid display market in 2025, holding approximately 38.30% of global revenues.
The consumer electronics segment dominated the ferro liquid display market with 38.47% share in 2025.
The primary growth factors are global defense sector display modernisation programmes creating sustained high-value FLD procurement, the automotive industry's comprehensive digital cockpit transformation generating large-scale display panel demand.
The ferro liquid display market was valued at approximately USD 10.05 Billion in 2025, with 2025 market size estimated in alignment with the reported growth trajectory.
The ferro liquid display market is expected to grow at a CAGR of 9.23% from 2026 to 2035.
Get in Touch
