Fintech-as-a-Service (FaaS) Market Report Scope & Overview:
Get more information on Fintech-as-a-Service (FaaS) Market - Request Sample Report
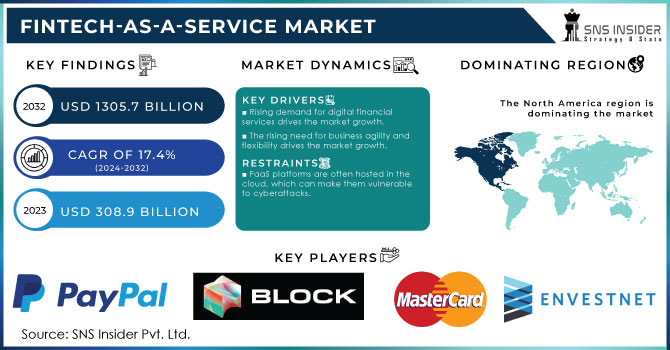
The Fintech-as-a-Service Market size was valued at USD 308.9 Billion in 2023. It is expected to grow to USD 1305.7 Billion by 2032 and grow at a CAGR of 17.4% over the forecast period of 2024-2032.
Solutions for fintech as a service provide a wide range of functions, such as card issuance, payment processing, and fraud detection. The market's expansion can be due to elements including the growing use of Artificial Intelligence technologies, mobile payments, and increased financial technology infrastructure investments. This growth was driven by the increasing adoption of FaaS by businesses of all sizes. The market is expanding as a result of the growing consumer preference for digital financial services. The market is expected to increase as a result of the widespread adoption of cutting-edge technologies including speech bots, open banking, blockchain technology, and big data analytics.
The continuous growth of a market is caused by two significant trends, including the increasing demand for the provision of digital solutions and the growth of regulatory requirements. Nowadays, clients and organizations try to use financial services that are available, operative, and convenient, which predetermines the demand for digital payment systems, lending solutions, and tools for investment management. According to the US. Census Bureau, US e-Commerce Sales Reach USD 1,000 billion in 2022, which underlines the focus on digital transactions and the necessity to develop Fintech solutions.
In addition, financial institutions are driven to look for FaaS solutions due to the dynamic of the regulatory environment. As standards for transparency, security, and consumer protections have become increasingly strict, fintech providers have developed tools that help streamline compliance. Therefore, while the customers seek digitalization, the credit institutions are often necessitated to adopt FaaS model due to the strictness of the regulations. As such, the combination of demands from customers and the need from the side of the regulatory entities creates an excellent environment for the FaaS market to grow. Therefore, Fintech-as-a-Service is poised for significant growth as it allows businesses to quickly adapt to the changes in the customer and the regulatory attitude.
Drivers
-
Rising demand for digital financial services drives the market growth.
-
The rising need for business agility and flexibility drives the market growth.
-
Increasing adoption of cloud computing drives the market growth.
The introduction of cloud computing emerges as a relevant trend that revolutionizes diverse industries and benefits market growth. Notable advancements in technology prompt businesses to adopt innovative solutions to optimize operational performance and extend their capabilities. Indeed, the U.S. Government Accountability Office report identified that implementation of cloud computing in the federal sector would allow taxpayers to save as much as USD 2 billion per annum related to IT spending by 2022. Furthermore, similar trends are identified in other industries, with companies relying on cloud technologies to reduce costs, facilitate work, and ensure collaboration.
Rapid deployment options provided by cloud services support the innovation process and help businesses adopt relevant services to meet market goals. Overall, as technologies continue to develop, demand for cloud computing increases, creating adequate market opportunities and facilitating future improvements in business model operations.
Restraint
-
FaaS platforms are often hosted in the cloud, which can make them vulnerable to cyberattacks.
-
FaaS platforms can be expensive, especially for small businesses.
Though highly scalable and flexible, function as a service may become the source of considerable financial problems for small businesses. Their cost structure typically includes charges for every function invocation, data transfer, and storage. As many small companies have unstable loads and grow fast, these costs can grow rapidly to become a significant burden for businesses that have tight budgets and can hardly choose to divert the company’s funds from organizational needs. On the other hand, the increased complexity of FaaS environments and the expertise they require may also cause the need to pay more for skilled personnel. This makes it impossible for many small businesses to consider the persistent implementation of this IT option as a sound approach since it will be impossible for them to afford it.
OPPORTUNITY
-
Competition from traditional banks Provides Various Opportunities.
-
The integration of AI and blockchain technologies in FaaS solutions provides financial institutions with the opportunity to improve their services and processes
The incorporation of artificial intelligence and blockchain technologies in Function as a Service solution can provide financial institutions with transformative opportunities to improve their products and streamline their services. With the help of AI, banks will be able to analyze significant amounts of data in real-time, providing personalized financial products to their clients, as well as facilitating the process of detecting fraud and improving customer service through the employment of chatbots and automatic help. As a result of using blockchain, security and transparency in transactions will be improved, which will also enhance the efficiency of a bank’s operations and even reduce the risks stemming from the operational processes.
Key Segmentation Analysis
By Type
The payment segment held a market share of about 42.23% in 2023. The phenomenon could be attributed to the substantial transformation in consumer preferences, as they switched to digital and cashless payments. As a result, a large number of fintech companies developed a wide range of technologies and instruments to facilitate and enhance the payment processes. To some extent, this segment can reflect the overall versatility and inclusivity of most fintech solutions that embrace a vast variety of tools, from mobile wallets to peer-to-peer transactions, from contactless to cross-border payments. It is particularly important that an array of actors, be it individuals, enterprises, or even governments, can benefit from the differing platforms.
The fund transfer segment can witness the most significant growth over the projected period. Overall, the activity is directly associated with the process of money transfer and withdrawal from another, executed via the technologies supported by the payment system. At the same time, an increasing number of people choose to use funds and transfer money around the globe, and the application is expected to find its customers. There are numerous efforts made by different fintech start-ups around the globe to create fund transfer applications that can incorporate the best user interface principles, thus promoting a better experience.
By Technology
The blockchain segment held the largest market share around 38% in 2023. The demand for blockchain technology is growing among large enterprises. More prominent companies are trying to adopt blockchain due to its increased transparency and automation benefits. Financial institutions are one of the other adopters of this technology as it brings more security and efficiency. Due to the technology offered by blockchain, users can have sole ownership of their wealth, and only they can access their assets. This offers financial institutions more security, and their clients will not lose their assets from unauthorized access. Considerable benefits of the technology are expected to drive the growth of the segment.
The artificial intelligence segment is expected to grow with the highest CAGR over the forecast period. AI’s increasing acceptance by multiple companies drives the segment increase, as it helps in better decision-making, query resolution, shorter processing time, and efficiency. Nordic Moreover, AI assists in ensuring the companies’ innovation, which eventually delivers more customized, quick, and secure facilities with a greater degree of customer satisfaction and global reach. Improvements pursued by several companies to prosper and benefit the market position are expected to boost segmental growth.
By Application
The compliance and regulatory Support segment dominated the market in 2023 and accounted for over 34.0% share of the global revenue. Moreover, numerous financial institutions around the world are offering customer support on the app to continually enhance their operations and to cater to their customers better. Also, there has been a growing number of cases of fraud and money laundering worldwide, which further drives companies to offer excellent customer support. Thus, this will increase the efficiency of the market segment to cater to the needs across the globe, thereby propelling growth over the forecast period.
By End-Use
The insurance segment held the largest market share around 36.0% of the total global revenue. The development may be attributed to the growing acknowledgment of technology as a transformative force that could reshape and optimize the insurance industry. Solutions in the field of fintech typically offer a variety of services within the insurance domain, such as digital underwriting, processing of claims, management of policy, and assessment of risk. Their value proposition is the use of modern data analytics, algorithms driven by artificial intelligence, and automation to improve quality, efficiency, and user experience in insurance operations.
Do You Need any Customization Research on Fintech-as-a-Service Market - Inquire Now
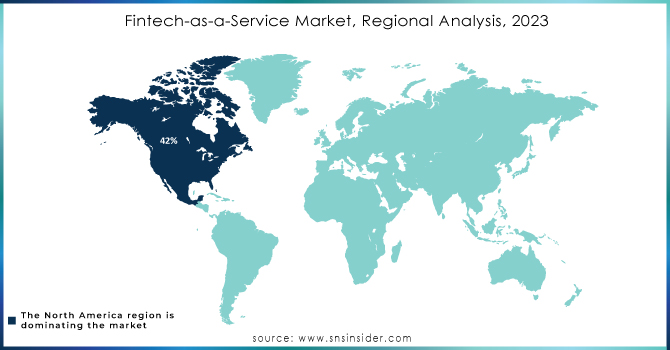
Regional Analysis
North America held the largest market share around 42% in 2023. North America is one of the most competitive markets in the world. It is home to all major tech giants and features a wide range of emerging technologies and start-ups. Additionally, in North America, the degree of digitalization is extremely high, with many advanced technological solutions and platforms being widely used by the industry. For instance, cloud computing services, artificial intelligence, and blockchain are becoming increasingly important and are the key enablers of innovation and efficiency. The North American market concentration is complemented by particularly high expenditure on research and development and the innovation of services and products. According to the U.S. Bureau of Economic Analysis, technology-related sectors of the economy manifested significant growth. Furthermore, the expansion of the digitalization-friendly legal framework there strongly supports new technologies, services, and platform development. All of these factors allow North America to maintain its market dominance, which is a prerequisite for the development of new digital technologies and economic growth in general.
Asia-Pacific is the second largest market for FaaS, with a market share of 25% in 2022. This is due to the rapid growth of the region's economy and the increasing adoption of digital financial services. Asia-Pacific is also home to several emerging economies, such as China and India, where the demand for FaaS is growing rapidly. The expansion of the regional market can be due to a growing understanding of the advantages of FaaS platforms in nations like China, India, and Japan. Fintech companies are receiving aggressive funding from venture capitalists and governments to encourage the use of digital services and fintech as a service platform.
Key Players
Raw Key Manufacturers
-
PayPal Holdings, Inc. (PayPal)
-
Block, Inc. (Square)
-
Mastercard Incorporated (Mastercard Payment Gateway)
-
Envestnet, Inc. (Envestnet | Yodlee)
-
Upstart Holdings, Inc. (Upstart Platform)
-
Rapyd Financial Network Ltd. (Rapyd Wallet)
-
Solid Financial Technologies, Inc. (Solid API)
-
Railsbank (Railsbank Banking Engine)
-
Synctera Inc. (Synctera Platform)
-
Braintree (Braintree Payments)
-
Stripe, Inc. (Stripe Connect)
-
Adyen N.V. (Adyen Payment Solutions)
-
Dwolla, Inc. (Dwolla API)
-
WePay (a JPMorgan Chase Company) (WePay Payments API)
-
Finastra (FusionFabric.cloud)
-
Plaid Inc. (Plaid Link)
-
Tink (Tink Platform)
-
N26 GmbH (N26 Banking App)
-
Kabbage, Inc. (a subsidiary of American Express) (Kabbage Funding)
-
Zelle (operated by Early Warning Services, LLC) (Zelle Payment Service)
Key User
-
Robinhood
-
Chime
-
LendingClub
-
Betterment
-
Wealth front
-
SoFi
-
Acorns
-
Kiva
-
Credit Karma
-
N26
Recent Development:
-
In March 2023, Synctera Inc., a provider of FaaS for banking, announced that it had partnered with Google Cloud to offer its platform on Google Cloud Platform. The partnership will make it easier for banks to adopt Synctera's platform and build innovative financial services applications.
-
In February 2023, Railsba, a provider of FaaS for the financial industry, announced that it had raised USD 10 million in Series A funding. The funding will be used to expand Railsba's product offerings and customer base.
| Report Attributes | Details |
|---|---|
| Market Size in 2023 | US$ 308.9 Billion |
| Market Size by 2032 | US$ 1305.7 Billion |
| CAGR | CAGR of 17.4% From 2024 to 2032 |
| Base Year | 2023 |
| Forecast Period | 2024-2032 |
| Historical Data | 2020-2022 |
| Report Scope & Coverage | Market Size, Segments Analysis, Competitive Landscape, Regional Analysis, DROC & SWOT Analysis, Forecast Outlook |
| Key Segments | • By Type (Payment, Fund Transfer, Loan, Others), • By Technology (Artificial Intelligence, API, RPA, Blockchain, Others), • By Application (KYC Verification, Fraud Monitoring, Compliance & Regulatory Support, Others), • By End-use (Banks, Financial Lending Companies, Insurance, Others), |
| Regional Analysis/Coverage | North America (US, Canada, Mexico), Europe (Eastern Europe [Poland, Romania, Hungary, Turkey, Rest of Eastern Europe] Western Europe] Germany, France, UK, Italy, Spain, Netherlands, Switzerland, Austria, Rest of Western Europe]), Asia Pacific (China, India, Japan, South Korea, Vietnam, Singapore, Australia, Rest of Asia Pacific), Middle East & Africa (Middle East [UAE, Egypt, Saudi Arabia, Qatar, Rest of Middle East], Africa [Nigeria, South Africa, Rest of Africa], Latin America (Brazil, Argentina, Colombia, Rest of Latin America) |
| Company Profiles | PayPal Holdings, Inc.; Block, Inc.; Mastercard Incorporated; Envestnet, Inc.; Upstart Holdings, Inc.; Rapyd Financial Network Ltd.; Solid Financial Technologies, Inc.; Railsba, Synctera Inc., Braintree, and others |
| Key Drivers | • Rising demand for digital financial services drives the market growth. • The rising need for business agility and flexibility drives the market growth. • Increasing adoption of cloud computing drives the market growth. |
| RESTRAINTS | •FaaS platforms are often hosted in the cloud, which can make them vulnerable to cyberattacks. • FaaS platforms can be expensive, especially for small businesses |
Get in Touch
