Geotechnical Instrumentation and Monitoring Market Size:
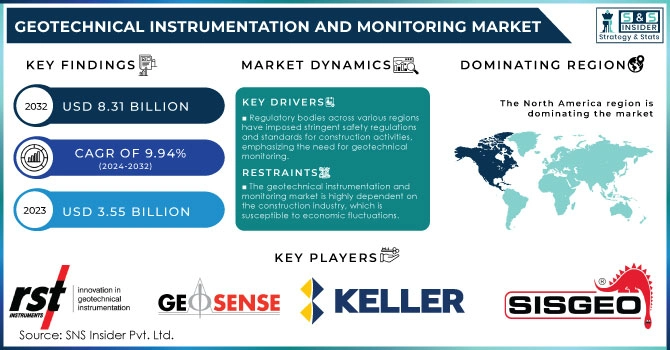
The Geotechnical Instrumentation and Monitoring Market Size was valued at USD 3.55 Billion in 2023 and is expected to reach USD 8.31 Billion by 2032, growing at a CAGR of 9.94% over the forecast period 2024-2032.
The geotechnical instrumentation and monitoring (GIM) market is experiencing significant growth due to the increasing demand for safety, structural integrity, and the longevity of large-scale infrastructure projects, including tunnels, dams, bridges, and building foundations. This growth is closely linked to the expansion of infrastructure projects worldwide, particularly in rapidly urbanizing regions where the need for new infrastructure such as roads, bridges, high-rise buildings, and underground facilities is on the rise. In 2023, the U.S. federal government allocated substantial funds for transportation and infrastructure, totaling USD 44.8 billion for direct infrastructure investments and an additional USD 81.5 billion transferred to states. Geotechnical monitoring is crucial for these projects, ensuring structures can withstand natural forces like earthquakes, landslides, and heavy rainfall. The Federal Emergency Management Agency (FEMA) allocated over USD 210 million for infrastructure repairs following natural disasters, focusing on power lines and public utilities, which historically account for 34% of FEMA's infrastructure spending. Additionally, as governments and private sector players invest more in infrastructure development, the demand for advanced GIM solutions has surged, further driving market expansion.
Technological advancements have also been pivotal in the development of the Geotechnical Instrumentation and Monitoring market. The integration of IoT (Internet of Things) and remote sensing technologies has enhanced the precision of data collection and analysis, leading to improved predictive models and preventive measures. Automated and real-time monitoring systems empower project managers to swiftly assess risk levels and implement mitigation strategies, thereby reducing the likelihood of catastrophic failures and project delays. These technological improvements have made geotechnical monitoring more efficient and cost-effective, encouraging widespread adoption across various sectors.
Geotechnical Instrumentation and Monitoring Market Size and Forecast:
-
Market Size in 2023: USD 3.55 Billion
-
Market Size by 2032: USD 8.31 Billion
-
CAGR: 9.94% from 2024 to 2032
-
Base Year: 2023
-
Forecast Period: 2024–2032
-
Historical Data: 2020–2022
Get more information on Geotechnical Instrumentation and Monitoring Market - Request Sample Report
Geotechnical Instrumentation and Monitoring Market Trends:
-
Increasing infrastructure investments in tunnels, bridges, dams, and underground construction projects
-
Growing adoption of IoT-enabled sensors and remote monitoring technologies for real-time data collection
-
Rising demand for structural safety and risk mitigation in earthquake- and landslide-prone regions
-
Integration of wireless monitoring systems for flexible and large-scale geotechnical monitoring networks
-
Expansion of predictive analytics and automated monitoring solutions for early risk detection
-
Strong regulatory emphasis on construction safety and geotechnical risk monitoring in major infrastructure projects
Geotechnical Instrumentation and Monitoring Market Dynamics
Drivers
-
Regulatory bodies across various regions have imposed stringent safety regulations and standards for construction activities, emphasizing the need for geotechnical monitoring.
These rules protect workers, the public, and buildings by closely observing geotechnical risks like landslides, soil erosion, ground sinking, and earthquakes. For instance, in the United States, contractors must comply with Occupational Safety and Health Administration (OSHA) guidelines for excavation safety and ground monitoring on construction projects. Furthermore, Eurocode 7 standards in Europe emphasize geotechnical design and require engineers to oversee soil stability and ground conditions during construction. Abiding by these standards is essential to prevent legal consequences and guarantee the success of the project. Adherence to these rules encourages the use of geotechnical monitoring tools, ensuring a steady demand for devices such as strain gauges, pressure cells, and extensometers. Corporations like RST Instruments and Fugro offer tools and monitoring solutions to assist contractors and engineers in meeting safety standards, which in turn boosts market expansion.
-
There is a growing emphasis on the development of sustainable and resilient infrastructure, particularly in regions vulnerable to natural disasters.
Governments and global organizations are concentrating on constructing durable structures that can endure these environmental challenges while reducing the impact on the environment. The demand for infrastructure that can withstand disasters has resulted in the incorporation of geotechnical instrumentation throughout the planning, building, and observation stages of these projects. For instance, Japan, famous for its frequent earthquakes, has implemented comprehensive geotechnical monitoring systems in construction projects to reduce earthquake hazards. Real-time monitoring technology with wireless sensors can identify ground movements and give early alerts, allowing for prompt evacuation or reinforcement actions. The increasing trend towards infrastructure that can withstand climate challenges, backed by global agreements such as the Sendai Framework, also strengthens the need for geotechnical monitoring equipment. Geosense and Keller Group provide innovative geotechnical solutions to aid infrastructure development, which helps drive market expansion.
Restraints
-
The geotechnical instrumentation and monitoring market is highly dependent on the construction industry, which is susceptible to economic fluctuations.
During periods of economic downturn, construction activities often slow down or come to a halt, leading to reduced demand for geotechnical monitoring solutions. For example, the COVID-19 pandemic significantly impacted construction projects worldwide, delaying new developments and stalling ongoing projects. Economic recessions can result in budget cuts for infrastructure projects, affecting government and private sector investments in construction. Such downturns reduce the demand for monitoring systems as project owners focus on cost-saving measures. The cyclical nature of the construction industry and its sensitivity to economic conditions pose a significant restraint to the growth of the geotechnical instrumentation and monitoring market.
Geotechnical Instrumentation and Monitoring Market Segment Analysis
By Offering
The hardware sector held a market share of 47% in 2023 and led the market because of the widespread use of sophisticated tools like inclinometers, piezometers, and extensometers in geotechnical monitoring. These tools are essential for gathering up-to-the-minute information on soil conditions, structural performance, and environmental variables in endeavors such as building, mining, and infrastructure advancement. For instance, RST Instruments offers inclinometers to monitor ground movement in tunnels and dams, while Geokon provides vibrating wire piezometers for monitoring pore-water pressure in different geotechnical applications.
The services sector is projected to grow at a rapid CAGR during 2024-2032 because of the rising need for thorough monitoring solutions, such as installation, data analysis, and real-time monitoring services. These services play a crucial role in maintaining the efficient operation of geotechnical equipment and promptly identifying possible dangers. Firms such as Fugro provide expert geotechnical monitoring services, offering data analysis in real-time and on-site assistance for infrastructure ventures, whereas Keller Group specializes in tailored monitoring solutions for urban construction and deep excavations.
By Networking Technology
The wired segment dominated the GIM market in 2023 with a 55% market share due to its reliability, accuracy, and lower susceptibility to interference. Wired systems are well-suited for extensive infrastructure endeavors such as tunnels, dams, and bridges, where ensuring stable and reliable data transmission is crucial for overseeing ground shifts and structural strength. Furthermore, wired systems frequently exhibit decreased latency, allowing for real-time data collection, a crucial aspect for early warning systems in geotechnical projects. Companies such as RST Instruments and Geokon utilize wired technology in their inclinometers and extensometers for accurate measurements at construction and mining locations.
The wireless segment is expected to have a faster growth rate during 2024-2032 due to its flexibility and ease of deployment. In contrast to wired systems, wireless technology does away with the requirement for extensive cabling, making it appropriate for isolated and difficult-to-access areas like landslides, embankments, and regions with intricate topographies. Wireless systems also enable simpler growth in size, which makes them an economical choice for expanding monitoring networks. Sensemetrics and Geomotion utilize wireless systems for tracking groundwater levels and slope stability in urban development projects, providing a simplified method for data collection without being limited by physical connections.
Geotechnical Instrumentation and Monitoring Market Regional Overview
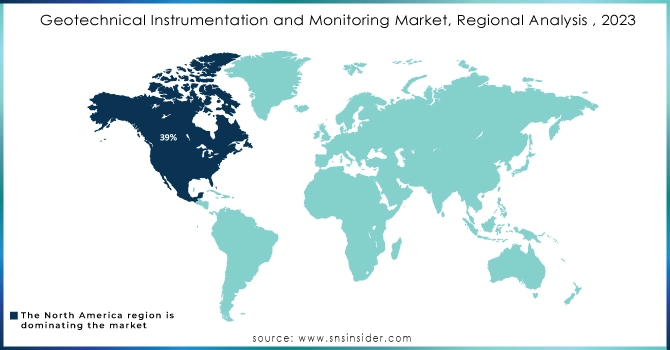
North America led the geotechnical instrumentation and monitoring (GIM) market in 2023 with a 39% market share because of its quick embrace of cutting-edge technologies and significant funding of infrastructure endeavors. The area's development is propelled by many major construction ventures, such as highways, bridges, and tunnels, accompanied by a firm emphasis on safety measures in civil engineering. Leading companies like RST Instruments, Geokon, and Keller Group have helped expand the market by offering advanced monitoring solutions for the construction, mining, and oil and gas industries. These companies participate in different projects such as monitoring oil field subsidence, evaluating urban construction structural stability, and ensuring safety in transportation infrastructure projects.
The APAC region is anticipated to experience a rapid growth rate during 2024-2032 due to fast urbanization, industrialization, and large infrastructure investments. Nations such as China, India, and Japan are making significant investments in infrastructure projects such as dams, metro rail systems, and renewable energy initiatives, all of which necessitate accurate geotechnical monitoring. EKO Instruments, Aimil Ltd., and Fugro are prominent in the area, providing solutions for monitoring landslides, soil stability in metro construction, and seismic activities. For instance, these businesses supply sensors and monitoring systems for high-speed railway endeavors in China and dam safety initiatives in India.
Get Customized Report as per your Business Requirement - Request For Customized Report
Key Players
The major key players in the Geotechnical Instrumentation and Monitoring Market are:
-
RST Instruments Ltd. (Vibrating Wire Piezometer, Inclinometer System)
-
Geosense Ltd. (Extensometers, Piezometers)
-
Keller Group plc (Pressure Transducers, Piezoresistive Pressure Sensors)
-
SISGEO S.r.l. (Inclinometers, Strain Gauges)
-
Fugro N.V. (Inclinometer Casing, Settlement Plates)
-
Nova Metrix LLC (Vibrating Wire Displacement Transducers, Load Cells)
-
Geokon, Inc. (Vibrating Wire Strain Gauges, Settlement Sensors)
-
Soil Instruments Ltd. (Inclinometers, Settlement Cells)
-
Eijkelkamp Soil & Water (Cone Penetrometer, Soil Moisture Sensors)
-
Roctest Ltd. (Vibrating Wire Piezometer, Fiber Optic Sensors)
-
Durham Geo Slope Indicator (DGSI) (Piezometers, Inclinometer Systems)
-
Geomotion Singapore (Inclinometers, Crack Meters)
-
Encardio-Rite Electronics Pvt. Ltd. (Piezometers, Tilt Meters)
-
James Fisher Strainstall (Strain Gauges, Load Monitoring Systems)
-
Campbell Scientific, Inc. (Data Loggers, Weather Stations)
-
Maccaferri S.p.A. (Geogrids, Geotextiles)
-
Infra Measure (Railway Monitoring Sensors, Tiltmeters)
-
Geotechnical Services, Inc. (GSI) (Settlement Systems, Load Cells)
-
RST Instruments (South America) (Data Loggers, Wireless Monitoring Systems)
-
Ace Instruments (Portable Water Level Logger, Data Acquisition Systems)
Suppliers of Raw Materials/Components:
-
3M
-
Honeywell International Inc.
-
Bosch Sensortec
-
STMicroelectronics
-
Texas Instruments
-
Panasonic Corporation
-
Mouser Electronics
-
TE Connectivity
-
Vishay Intertechnology
-
NXP Semiconductors
Recent Developments
-
August 2024: Bestech Australia declared their enhancement of the collaboration with Encardio Rite, a company specializing in geotechnical sensing, instrumentation, and monitoring. With a recommitted focus on their relationship, Bestech and Encardio Rite will concentrate on introducing new products and capabilities to aid in earthworks testing for various industries including geotechnical, construction, mining, rail, and marine sectors.
-
October 2023: Canary Systems Inc., a top provider of web-based geotechnical monitoring solutions, has unveiled its latest software platform, MLWeb3, with new features that aim to revolutionize data collection, integration, and analysis for companies.
-
November 2023: Instrumentation and monitoring solutions provider Soil Instruments launched its Sensly data management platform. Soil Instruments has designed its new Sensly data monitoring software to replace the existing Argus platform.
| Report Attributes | Details |
|---|---|
| Market Size in 2023 | USD 3.55 Billion |
| Market Size by 2032 | USD 8.31 Billion |
| CAGR | CAGR of 9.94% From 2024 to 2032 |
| Base Year | 2023 |
| Forecast Period | 2024-2032 |
| Historical Data | 2020-2022 |
| Report Scope & Coverage | Market Size, Segments Analysis, Competitive Landscape, Regional Analysis, DROC & SWOT Analysis, Forecast Outlook |
| Key Segments | • By Offering (Hardware, Software, Services) • By Networking Technology (Wired, Wireless) • By Structure (Buildings & Utilities, Dams, Tunnels & Bridges, Pipelines, Others) • By End User (Buildings & Infrastructure, Energy & Power, Oil & Gas, Mining, Others) |
| Regional Analysis/Coverage | North America (US, Canada, Mexico), Europe (Eastern Europe [Poland, Romania, Hungary, Turkey, Rest of Eastern Europe] Western Europe] Germany, France, UK, Italy, Spain, Netherlands, Switzerland, Austria, Rest of Western Europe]), Asia Pacific (China, India, Japan, South Korea, Vietnam, Singapore, Australia, Rest of Asia Pacific), Middle East & Africa (Middle East [UAE, Egypt, Saudi Arabia, Qatar, Rest of Middle East], Africa [Nigeria, South Africa, Rest of Africa], Latin America (Brazil, Argentina, Colombia, Rest of Latin America) |
| Company Profiles | RST Instruments Ltd., Geosense Ltd., Keller Group plc, SISGEO S.r.l., Fugro N.V., Nova Metrix LLC, Geokon, Inc., Soil Instruments Ltd., Eijkelkamp Soil & Water, Roctest Ltd., Durham Geo Slope Indicator (DGSI), Geomotion Singapore, Encardio-Rite Electronics Pvt. Ltd., James Fisher Strainstall, Campbell Scientific, Inc., Maccaferri S.p.A., Infra Measure, Geotechnical Services, Inc. (GSI), RST Instruments (South America), Ace Instruments |
| Key Drivers | • Regulatory bodies across various regions have imposed stringent safety regulations and standards for construction activities, emphasizing the need for geotechnical monitoring. • There is a growing emphasis on the development of sustainable and resilient infrastructure, particularly in regions vulnerable to natural disasters. |
| RESTRAINTS | • The geotechnical instrumentation and monitoring market is highly dependent on the construction industry, which is susceptible to economic fluctuations. |
Frequently Asked Questions
Ans: The wired segment dominated the Geotechnical Instrumentation and Monitoring Market.
Ans: The Geotechnical Instrumentation and Monitoring Market is expected to grow at a CAGR of 9.94% during 2024-2032.
Ans: North America dominated the Geotechnical Instrumentation and Monitoring Market in 2023.
Ans: The Geotechnical Instrumentation and Monitoring Market was USD 3.55 Billion in 2023 and is expected to Reach USD 8.31 Billion by 2032.
Ans: Regulatory bodies across various regions have imposed stringent safety regulations and standards for construction activities, emphasizing the need for geotechnical monitoring and instrumentation market.
Get in Touch
