Green and Bio Polyols Market Size Analysis

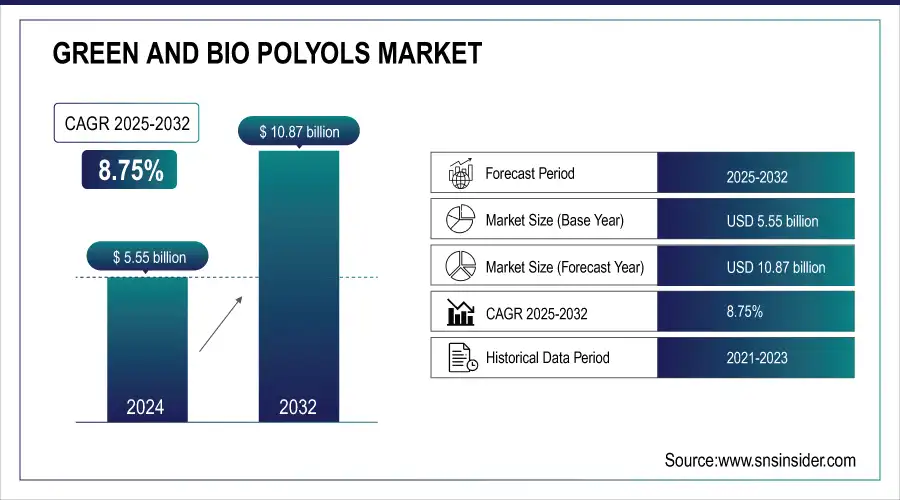
The Green and Bio Polyols Market size was valued at USD 5.55 billion in 2024 and is expected to reach USD 10.87 billion by 2032 and grow at a CAGR of 8.75% over the forecast period 2025-2032.

This report delivers a comprehensive statistical analysis of the green and bio polyols market, covering production capacity and utilization trends by country and type. It examines regional feedstock pricing dynamics for key raw materials, providing insight into cost competitiveness. The report evaluates the impact of regulatory frameworks and government incentives on market growth and innovation. Environmental metrics such as emissions data, waste management practices, and sustainability initiatives are also analyzed to underscore the market’s ecological footprint. Finally, it reviews trends in R&D and adoption rates, offering a clear picture of the market’s evolving landscape.

Get More Information on Green and Bio Polyols Market - Request Sample Report

Key Green and Bio Polyols Market Trends

  • Rising demand for sustainable and eco-friendly materials.

  • Expanding applications in polyurethane foams, coatings, and adhesives.

  • Advancements in feedstock utilization (natural oils, waste resources).

  • Supportive government regulations and incentives for bio-based chemicals.

  • Growing adoption in the automotive and construction industries.

  • Increased R&D in high-performance and durable bio polyols.

  • Strategic collaborations and capacity expansion by key players.

 Green and Bio Polyols Market Growth Drivers

  • Increasing use in automotive, furniture, and construction industries drives the market growth.

Rising consumption of green and bio polyols in the automotive, furniture, and construction sectors considerably drives the growth of the green and bio polyols market. In the automotive industry, bio polyols are used to manufacture lightweight and wear-resistant components which enhance fuel efficiency and reduce emissions. Apart from this, the application of this product in adhesives and coatings helps the furniture industry by improving product quality and providing an environmentally friendly manufacturing process. The use of green polyols in insulation materials and sealants in construction reduces the environmental footprint of buildings by promoting energy efficiency. The cross-industry application of the invention highlights the strong growth of the market and the transitioned demand for greener, sustainable materials.

Green and Bio Polyols Market Restraints

  • High production costs associated with these polyols market may hamper the market growth.

The high production cost associated with green and bio polyols can act as a considerable deterrent in hampering market growth owing to its inability to be cost competitive as compared to petroleum-based alternatives. These high costs are attributable to the intricate production routes and the requirement for specialized renewable feedstocks, which are typically more expensive. Especially in price-sensitive industries, this price difference may dissuade manufacturers from adopting green polyols, perhaps restricting large-scale market penetration. This cost step also may slow the development of larger scale mills and postpone getting on an economy of scale cost decline path. In the end, these cost challenges will need to be tackled by technological innovations and enabling policies to allow sustainable polyols to realize their full potential in the market.

Green and Bio Polyols Market Opportunities

  • Rising global demand for sustainable and renewable materials creating an opportunity for the market.

The Opportunities pointer of the green and bio-polyols market looks at the increasing penetration of sustainable and renewable products for feedstock across the globe. With the gradual transition of industries towards an eco-friendly approach, bio polyols gain the potential demand to replace conventional materials, especially in the automotive, construction, and furniture industries. Continuous improvements in production technologies and processes optimizations enable cost reductions and better performance, arguably a positive feedback loop for increased adoption. Moreover, by way of beneficial governmental policies and strategic industry collaborations, there are opportunities to expand market growth and penetrate new regional markets. This interplay provides a strong foundation for a long-term growth and innovation platform.

Green and Bio Polyols Market Challenges

  • Limited availability of raw materials required for the production major challenges for Green and Bio Polyols market.

One of the major challenges faced by the green and bio-polyols market is the unavailability of raw materials required for production. The bio-based polyols are mainly produced from renewable feedstocks such as vegetable oils and various agricultural by-products which are provided by seasonal variation and regional supply limitation. Fluctuating weather conditions and competition for agricultural land leads to variability in crop yields which in turn results in an inconsistent supply and heightened raw material prices. This shortage is not only a factor in the limitation of scaling production but also a risk to being able to hold the competitive price versus traditional materials. With the growing demand for sustainable products, a key challenge for industry stakeholders is maintaining reliability and price accessibility for these essential feedstocks.

Green and Bio Polyols Market Segment Analysis

  • By Raw Material

The Green and Bio Polyols Market was dominated by Natural Oils and Their Derivatives with a revenue share of over 55% in 2024. The abundance design & sustainability of Natural oils such as soybean, rapeseed, and palm oil-based oils are easily available as well as, renewable and replenished in the relatively short period. Also, Other natural oils have characteristics that are ideal for different uses. Castor oil, for instance, has high thermal stability, and soy oil has good flexural resistance. Furthermore, it should be noted that natural oils are less well-known but comparatively inexpensive relative to alternative raw materials based on sucrose and glycerin.
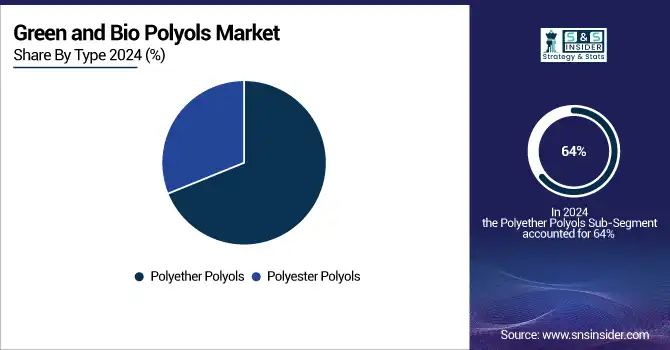
  • By Type

The polyether polyols held the largest market share around 64% in 2024.  As it has extensive software and higher overall performance characteristics. Due to their versatility, they are commonly used in the manufacture of products, such as polyurethane foams, coatings, adhesives, and sealants, which are further used in various industries, including automotive, construction, and furniture. These properties contribute to the increases in production efficiency and constant performance of the end product while still maintaining low viscosity, high chemical stability, and high processing ease. Due to these factors, and because of competitive pricing and compatibility with a wide range of isocyanates, polyether polyols are an essential ingredient in producing high-performing materials, and solidifying a leading market share.

  • By Application

PU flexible foam is the dominating segment in the market, due to considerable application of PU flexible foam in the end-use industries wherein the industry requires comfort, durability, and durability of the product. It is extensively employed in applications like automotive seating, furniture, and bedding, primarily for its excellent cushioning properties, light weight and energy absorption characteristics. Additionally, the use of green and bio-based polyols in its manufacture not only fits within sustainability aspirations but also increases the performance of the product. Increased cost efficiency and improved consistency driven by advances in manufacturing techniques have also helped to solidify the position of topside in the market.

  • By End-use Industry

Furniture and Bedding held the largest market share around 32% in 2024. It is because of consumer preference is shifting towards sustainable and eco-friendly products for the home, the Furniture and Bedding segment dominates the market. With the backing of environmentally-friendly consumers, manufacturers are utilizing green and bio-based polyols in the production of polyurethane foams to create comfy and resilient furniture and bedding. Product innovations in this sector are constant, and, if the production efficiencies are improved in this order, the pricing generally remains competitive, although the performance is enhanced. Along with that, the increasing inclination towards green living and rising awareness about the sustainable materials has also contributed towards the demand for these products, thus strengthening the leading position of the Furniture & Bedding segment in the market.

Green and Bio Polyols Market Regional Analysis

North America Green and Bio Polyols Market Insights

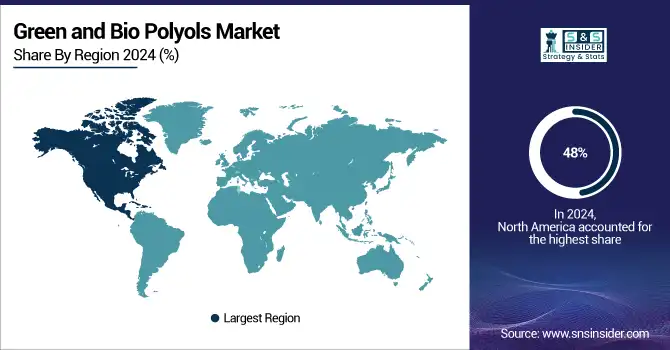
North America led the largest market share around 48% in 2024. It is owing to high demand from end-use industries, technological advancements and government initiatives. Consumer inclination towards the adoption of sustainable materials in automotive, construction and furniture industries along with regulations against the use of synthetic materials, has spurred the demand for bio-based polyols in the region. Also, North America has world-class manufacturing capabilities and R&D, making it more adaptable to development in energy used in production of bio polyols. Market growth is also stimulated by government incentives, such as tax credits offered for the utilization of renewable materials. Therefore, these factors all boost the green and bio polyols market in North America.

Europe Green and Bio Polyols Market Insights

Europe held a significant market share owing to strict environmental regulations, strong government incentives, and strong consumer demand for green products. The proactive policy frameworks existent in the region incentivized various industries to adopt sustainable practices and boost investment in research and development of cleaner solutions. In addition, the saturated chemical sector with a well-established supply chain network in Europe simplifies the one-step integration of bio-based materials, providing a competitive advantage in sustainable industrial production.

Asia Pacific Green and Bio Polyols Market Insights

APAC is the largest demand generator for green and bio polyols by 2024, driven by the growth of industries coupled with increasing urbanization and their need for sustainable materials in construction, automotive, furniture industries, and consumer goods. Nations such as China, India, and Japan are leading, as they are majorly spending on bio-based polyols in order to decrease dependency on petrochemical-based products. So is a growing middle class across the region and more stringent regulations on carbon emissions. Despite the influx of R&D and government promotions towards bio-based industries, the Asia Pacific continues to be the dominant regional market, and its market is expanding at the fastest pace.

Latin America, Middle East & Africa (MEA) Green and Bio Polyols Market Insights

On the other hand, the Latin America and Middle East & Africa (MEA) construction aggregates markets will witness moderate growth, as the construction aggregates market is growing due to growing infrastructure development, growing automotive industry, and preference for eco-friendly construction material. In the LATAM, Brazil and Mexico are anticipated to witness significant contributions driven by the government efforts to adopt sustainable materials and the rising adoption of carbon reduction. As of now, green and bio polyols are being used in construction and industrial applications in MEA. Countries including KSA, UAE, South Africa are using this product to achieve the economic diversification and sustainability aim of the region. Both LATAM and MEA are fast-growing regions with increasing consumer demand for green alternatives and backed by various governments to excel market to its fullest potential.

 Get Customized Report as per your Business Requirement - Request For Customized Report

Competitive Landscape for Green and Bio Polyols Market

Lanxess AG
Lanxess AG is a leading specialty chemicals company with a strong focus on sustainable material solutions across diverse industrial sectors.

  • In 2023, Lanxess rolled out improvements to its bio polyol formulations, emphasizing both environmental sustainability and enhanced material performance. These upgrades were designed to address the rising demand for eco-friendly and high-performance polyols in multiple industrial applications.

Cargill, Inc.
Cargill is a global agribusiness and food processing leader, increasingly investing in sustainable chemicals and materials.

  • In 2023, Cargill partnered with leading research institutions to advance bio polyol formulations. The collaboration aimed to leverage innovative R&D to improve sustainability and performance in polyurethane applications, reinforcing its commitment to greener industrial solutions.

Green and Bio Polyols Market Key Players

  • BASF SE (EcoPolyol 365, BioPolyol 720)

  • Biobased Technologies LLC (GreenRenew Polyol, BioSustain Polyol)

  • E.I. Du Pont De Nemours & Co. (DuPont BioBlend, DuPont EcoFoam Polyol)

  • Bayer AG (Bayer BioActive Polyol, Bayer GreenTech Polyol)

  • Emery Oleochemicals (Emery BioPolyol, Emery EcoFoam)

  • Jayant Agro Organics Pvt., Ltd. (Jayant BioPolyol, Jayant GreenRenew)

  • Cargill, Inc. (Cargill BioFoam, Cargill EcoBlend)

  • Koch Industries (Koch GreenPolyol, Koch BioSustain)

  • DOW Chemical Company (Dow EcoPolyol, Dow BioFlex Polyol)

  • Mitsui Chemicals (Mitsui BioPolyol, Mitsui EcoBlend)

  • Global Bio-Chem Technology Group (Global BioRenew, Global GreenPolyol)

  • Huntsman Corporation (Huntsman BioPolyol, Huntsman EcoFlex)

  • Covestro (Covestro EcoPolyol, Covestro BioFoam)

  • Hexion Inc. (Hexion GreenPolyol, Hexion BioBlend)

  • Solvay S.A. (Solvay BioPolyol, Solvay EcoFoam)

  • Wanhua Chemical Group (Wanhua GreenPolyol, Wanhua BioFlex)

  • Clariant AG (Clariant EcoPolyol, Clariant BioRenew)

  • Lanxess AG (Lanxess BioPolyol, Lanxess EcoBlend)

  • Celanese Corporation (Celanese GreenPolyol, Celanese BioFoam)

  • Indorama Ventures (Indorama BioPolyol, Indorama EcoFlex)

Green and Bio Polyols Market Report Scope:

Report Attributes Details
Market Size in 2024 US$ 5.55 Billion
Market Size by 2032 US$ 10.87 Billion
CAGR CAGR of 8.75% From 2025 to 2032
Base Year 2024
Forecast Period 2025-2032
Historical Data 2021-2023
Report Scope & Coverage Market Size, Segments Analysis, Competitive  Landscape, Regional Analysis, DROC & SWOT Analysis, Forecast Outlook
Key Segments • By Raw Material (Natural Oils and their Derivatives, Sucrose, Glycerin, Carbon Dioxide)
• By Type (Polyether Polyols, Polyester Polyols)
• By Application (PU Flexible Foam, CASE, PU Rigid Foam)
• By End-use Industry (Furniture and Bedding, Construction, Automotive, Packaging, Carpet Backing, Others)
Regional Analysis/Coverage North America (US, Canada), Europe (Germany, France, UK, Italy, Spain, Poland, Russsia, Rest of Europe), Asia Pacific (China, India, Japan, South Korea, Australia,ASEAN Countries, Rest of Asia Pacific), Middle East & Africa (UAE, Saudi Arabia, Qatar, Egypt, South Africa, Rest of Middle East & Africa), Latin America (Brazil, Argentina,    Mexico,     Colombia Rest of Latin America)
Company Profiles BASF SE, Biobased Technologies LLC, E.I. Du Pont De Nemours & Co., Bayer AG, Emery Oleochemicals, Jayant Agro Organics Pvt., Ltd., Cargill, Inc., Koch Industries, DOW Chemical Company, Mitsui Chemicals, Global Bio-Chem Technology Group, Huntsman Corporation, Covestro, Hexion Inc., Solvay S.A., Wanhua Chemical Group, Clariant AG, Lanxess AG, Celanese Corporation, Indorama Ventures

Table Of Contents

1. Introduction

1.1 Market Definition & Scope

 1.2 Research Assumptions & Abbreviations

 1.3 Research Methodology

2. Executive Summary

2.1 Market Snapshot

 2.2 Market Absolute $ Opportunity Assessment & Y-o-Y Analysis, 2021–2032

 2.3 Market Size & Forecast, By Segmentation, 2021–2032

  2.3.1 Market Size By Raw Material

  2.3.2 Market Size By Type

         2.3.3 Market Size By Application

         2.3.4 Market Size By End-Use Industry

 2.4 Market Share & BPS Analysis By Region, 2024

 2.5 Industry Growth Scenarios – Conservative, Likely & Optimistic

 2.6 Industry CxO’s Perspective

3. Market Overview

3.1 Market Dynamics

  3.1.1 Drivers

  3.1.2 Restraints

  3.1.3 Opportunities

  3.1.4 Key Market Trends

 3.2 Industry PESTLE Analysis

 3.3 Key Industry Forces (Porter’s) Impacting Market Growth

 3.4 Industry Life Cycle Assessment

 3.5 Parent Market Overview

 3.6 Market Risk Assessment

4. Statistical Insights & Trends Reporting

4.1 Technology Readiness & Adoption Curve

     4.2 Raw Material Sourcing & Feedstock Security Analysis

4.3 Circular Economy & Carbon Footprint Benchmarking

    4.4 End-User Industry Readiness Index

    4.5 Policy & Incentive Tracker

     4.6 Innovation & Patent Landscape

    5. Green and Bio Polyols Market Segmental Analysis & Forecast, By Raw Material, 2021 – 2032, Value (USD Billion)

5.1 Introduction

 5.2 Natural Oils and their Derivatives

  5.2.1 Key Trends

  5.2.2 Market Size & Forecast, 2021 – 2032

 5.3 Sucrose

  5.3.1 Key Trends

  5.3.2 Market Size & Forecast, 2021 – 2032

    5.4 Glycerin

  5.4.1 Key Trends

  5.4.2 Market Size & Forecast, 2021 – 2032

    5.5 Carbon Dioxide

  5.5.1 Key Trends

  5.5.2 Market Size & Forecast, 2021 – 2032

 6. Green and Bio Polyols Market Segmental Analysis & Forecast, By Type, 2021 – 2032, Value (USD Billion)

    6.1 Introduction

 6.2 Polyether Polyols

  6.2.1 Key Trends

  6.2.2 Market Size & Forecast, 2021 – 2032

 6.3 Granules

  6.3.1 Key Trends

  6.3.2 Market Size & Forecast, 2021 – 2032

    6.4 Polyester Polyols

  6.4.1 Key Trends

  6.4.2 Market Size & Forecast, 2021 – 2032

7. Green and Bio Polyols Market Segmental Analysis & Forecast, By Application, 2021 – 2032, Value (USD Billion)

    7.1 Introduction

 7.2 PU Flexible Foam

  7.2.1 Key Trends

  7.2.2 Market Size & Forecast, 2021 – 2032

 7.3 CASE

  7.3.1 Key Trends

  7.3.2 Market Size & Forecast, 2021 – 2032

7.4 PU Rigid Foam

  7.4.1 Key Trends

  7.4.2 Market Size & Forecast, 2021 – 2032

8. Green and Bio Polyols Market Segmental Analysis & Forecast, By End-Use Industry, 2021 – 2032, Value (USD Billion)

    8.1 Introduction

 8.2 Furniture and Bedding

  8.2.1 Key Trends

  8.2.2 Market Size & Forecast, 2021 – 2032

 8.3 Construction

  8.3.1 Key Trends

  8.3.2 Market Size & Forecast, 2021 – 2032

 8.4 Automotive

  8.4.1 Key Trends

  8.4.2 Market Size & Forecast, 2021 – 2032

 8.5 Packaging

  8.5.1 Key Trends

  8.5.2 Market Size & Forecast, 2021 – 2032

8.6 Carpet Backing

  8.6.1 Key Trends

  8.6.2 Market Size & Forecast, 2021 – 2032

8.7 Others

  8.7.1 Key Trends

  8.7.2 Market Size & Forecast, 2021 – 2032

 9. Green and Bio Polyols Market Segmental Analysis & Forecast by Region, 2021 – 2025, Value (USD Billion)

9.1 Introduction

9.2 North America

 9.2.1 Key Trends

 9.2.2 Green and Bio Polyols Market Size & Forecast, By Raw Material, 2021 – 2032

 9.2.3 Green and Bio Polyols Market Size & Forecast, By Type, 2021 – 2032

 9.2.4 Green and Bio Polyols Market Size & Forecast, By Application, 2021 – 2032

 9.2.5 Green and Bio Polyols Market Size & Forecast, By End-Use Industry, 2021 – 2032

 9.2.6 Green and Bio Polyols Market Size & Forecast, By Country, 2021 – 2032

  9.2.6.1 USA

   9.2.6.1.1 Green and Bio Polyols Market Size & Forecast, By Raw Material, 2021 – 2032

   9.2.6.1.2 Green and Bio Polyols Market Size & Forecast, By Type, 2021 – 2032

   9.2.6.1.3 Green and Bio Polyols Market Size & Forecast, By Application, 2021 – 2032

   9.2.6.1.4 Green and Bio Polyols Market Size & Forecast, By End-Use Industry, 2021 – 2032

  9.2.6.2 Canada

   9.2.6.2.1 Green and Bio Polyols Market Size & Forecast, By Raw Material, 2021 – 2032

   9.2.6.2.2 Green and Bio Polyols Market Size & Forecast, By Type, 2021 – 2032

   9.2.6.2.3 Green and Bio Polyols Market Size & Forecast, By Application, 2021 – 2032

   9.2.6.2.4 Green and Bio Polyols Market Size & Forecast, By End-Use Industry, 2021 – 2032

9.3 Europe

 9.3.1 Key Trends

 9.3.2 Green and Bio Polyols Market Size & Forecast, By Raw Material, 2021 – 2032

 9.3.3 Green and Bio Polyols Market Size & Forecast, By Type, 2021 – 2032

 9.3.4 Green and Bio Polyols Market Size & Forecast, By Application, 2021 – 2032

 9.3.5 Green and Bio Polyols Market Size & Forecast, By End-Use Industry, 2021 – 2032

 9.3.6 Green and Bio Polyols Market Size & Forecast, By Country, 2021 – 2032

  9.3.6.1 Germany

   9.3.6.1.1 Green and Bio Polyols Market Size & Forecast, By Raw Material, 2021 – 2032

   9.3.6.1.2 Green and Bio Polyols Market Size & Forecast, By Type, 2021 – 2032

   9.3.6.1.3 Green and Bio Polyols Market Size & Forecast, By Application, 2021 – 2032

   9.3.6.1.4 Green and Bio Polyols Market Size & Forecast, By End-Use Industry, 2021 – 2032

  9.3.6.2 UK

   9.3.6.2.1 Green and Bio Polyols Market Size & Forecast, By Raw Material, 2021 – 2032

   9.3.6.2.2 Green and Bio Polyols Market Size & Forecast, By Type, 2021 – 2032

   9.3.6.2.3 Green and Bio Polyols Market Size & Forecast, By Application, 2021 – 2032

   9.3.6.2.4 Green and Bio Polyols Market Size & Forecast, By End-Use Industry, 2021 – 2032

  9.3.6.3 France

   9.3.6.3.1 Green and Bio Polyols Market Size & Forecast, By Raw Material, 2021 – 2032

   9.3.6.3.2 Green and Bio Polyols Market Size & Forecast, By Type, 2021 – 2032

   9.3.6.3.3 Green and Bio Polyols Market Size & Forecast, By Application, 2021 – 2032

   9.3.6.3.4 Green and Bio Polyols Market Size & Forecast, By End-Use Industry, 2021 – 2032

  9.3.6.4 Italy

   9.3.6.4.1 Green and Bio Polyols Market Size & Forecast, By Raw Material, 2021 – 2032

   9.3.6.4.2 Green and Bio Polyols Market Size & Forecast, By Type, 2021 – 2032

   9.3.6.4.3 Green and Bio Polyols Market Size & Forecast, By Application, 2021 – 2032

   9.3.6.4.4 Green and Bio Polyols Market Size & Forecast, By End-Use Industry, 2021 – 2032

  9.3.6.5 Spain

   9.3.6.5.1 Green and Bio Polyols Market Size & Forecast, By Raw Material, 2021 – 2032

   9.3.6.5.2 Green and Bio Polyols Market Size & Forecast, By Type, 2021 – 2032

   9.3.6.5.3 Green and Bio Polyols Market Size & Forecast, By Application, 2021 – 2032

   9.3.6.5.4 Green and Bio Polyols Market Size & Forecast, By End-Use Industry, 2021 – 2032

  9.3.6.6 Russia

   9.3.6.6.1 Green and Bio Polyols Market Size & Forecast, By Raw Material, 2021 – 2032

   9.3.6.6.2 Green and Bio Polyols Market Size & Forecast, By Type, 2021 – 2032

   9.3.6.6.3 Green and Bio Polyols Market Size & Forecast, By Application, 2021 – 2032

   9.3.6.6.4 Green and Bio Polyols Market Size & Forecast, By End-Use Industry, 2021 – 2032

  9.3.6.7 Poland

   9.3.6.7.1 Green and Bio Polyols Market Size & Forecast, By Raw Material, 2021 – 2032

   9.3.6.7.2 Green and Bio Polyols Market Size & Forecast, By Type, 2021 – 2032

   9.3.6.7.3 Green and Bio Polyols Market Size & Forecast, By Application, 2021 – 2032

   9.3.6.7.4 Green and Bio Polyols Market Size & Forecast, By End-Use Industry, 2021 – 2032

  9.3.6.8 Rest of Europe

   9.3.6.8.1 Green and Bio Polyols Market Size & Forecast, By Raw Material, 2021 – 2032

   9.3.6.8.2 Green and Bio Polyols Market Size & Forecast, By Type, 2021 – 2032

   9.3.6.8.3 Green and Bio Polyols Market Size & Forecast, By Application, 2021 – 2032

   9.3.6.8.4 Green and Bio Polyols Market Size & Forecast, By End-Use Industry, 2021 – 2032   

9.4 Asia-Pacific

 9.4.1 Key Trends

 9.4.2 Green and Bio Polyols Market Size & Forecast, By Raw Material, 2021 – 2032

 9.4.3 Green and Bio Polyols Market Size & Forecast, By Type, 2021 – 2032

 9.4.4 Green and Bio Polyols Market Size & Forecast, By Application, 2021 – 2032

 9.4.5 Green and Bio Polyols Market Size & Forecast, By End-Use Industry, 2021 – 2032

 9.4.6 Green and Bio Polyols Market Size & Forecast, By Country, 2021 – 2032

  9.4.6.1 China

   9.4.6.1.1 Green and Bio Polyols Market Size & Forecast, By Raw Material, 2021 – 2032

   9.4.6.1.2 Green and Bio Polyols Market Size & Forecast, By Type, 2021 – 2032

   9.4.6.1.3 Green and Bio Polyols Market Size & Forecast, By Application, 2021 – 2032

   9.4.6.1.4 Green and Bio Polyols Market Size & Forecast, By End-Use Industry, 2021 – 2032

  9.4.6.2 India

   9.4.6.2.1 Green and Bio Polyols Market Size & Forecast, By Raw Material, 2021 – 2032

   9.4.6.2.2 Green and Bio Polyols Market Size & Forecast, By Type, 2021 – 2032

   9.4.6.2.3 Green and Bio Polyols Market Size & Forecast, By Application, 2021 – 2032

   9.4.6.2.4 Green and Bio Polyols Market Size & Forecast, By End-Use Industry, 2021 – 2032

  9.4.6.3 Japan

   9.4.6.3.1 Green and Bio Polyols Market Size & Forecast, By Raw Material, 2021 – 2032

   9.4.6.3.2 Green and Bio Polyols Market Size & Forecast, By Type, 2021 – 2032

   9.4.6.3.3 Green and Bio Polyols Market Size & Forecast, By Application, 2021 – 2032

   9.4.6.3.4 Green and Bio Polyols Market Size & Forecast, By End-Use Industry, 2021 – 2032

  9.4.6.4 South Korea

   9.4.6.4.1 Green and Bio Polyols Market Size & Forecast, By Raw Material, 2021 – 2032

   9.4.6.4.2 Green and Bio Polyols Market Size & Forecast, By Type, 2021 – 2032

   9.4.6.4.3 Green and Bio Polyols Market Size & Forecast, By Application, 2021 – 2032

   9.4.6.4.4 Green and Bio Polyols Market Size & Forecast, By End-Use Industry, 2021 – 2032

  9.4.6.5 Australia

   9.4.6.5.1 Green and Bio Polyols Market Size & Forecast, By Raw Material, 2021 – 2032

   9.4.6.5.2 Green and Bio Polyols Market Size & Forecast, By Type, 2021 – 2032

   9.4.6.5.3 Green and Bio Polyols Market Size & Forecast, By Application, 2021 – 2032

   9.4.6.5.4 Green and Bio Polyols Market Size & Forecast, By End-Use Industry, 2021 – 2032

  9.4.6.6 ASEAN Countries

   9.4.6.6.1 Green and Bio Polyols Market Size & Forecast, By Raw Material, 2021 – 2032

   9.4.6.6.2 Green and Bio Polyols Market Size & Forecast, By Type, 2021 – 2032

   9.4.6.6.3 Green and Bio Polyols Market Size & Forecast, By Application, 2021 – 2032

   9.4.6.6.4 Green and Bio Polyols Market Size & Forecast, By End-Use Industry, 2021 – 2032

  9.4.6.7 Rest of Asia-Pacific

   9.4.6.7.1 Green and Bio Polyols Market Size & Forecast, By Raw Material, 2021 – 2032

   9.4.6.7.2 Green and Bio Polyols Market Size & Forecast, By Type, 2021 – 2032

   9.4.6.7.3 Green and Bio Polyols Market Size & Forecast, By Application, 2021 – 2032

   9.4.6.7.4 Green and Bio Polyols Market Size & Forecast, By End-Use Industry, 2021 – 2032

9.5 Latin America

 9.5.1 Key Trends

 9.5.2 Green and Bio Polyols Market Size & Forecast, By Raw Material, 2021 – 2032

 9.5.3 Green and Bio Polyols Market Size & Forecast, By Type, 2021 – 2032

 9.5.4 Green and Bio Polyols Market Size & Forecast, By Application, 2021 – 2032

 9.5.5 Green and Bio Polyols Market Size & Forecast, By End-Use Industry, 2021 – 2032

 9.5.6 Green and Bio Polyols Market Size & Forecast, By Country, 2021 – 2032

  9.5.6.1 Brazil

   9.5.6.1.1 Green and Bio Polyols Market Size & Forecast, By Raw Material, 2021 – 2032

   9.5.6.1.2 Green and Bio Polyols Market Size & Forecast, By Type, 2021 – 2032

   9.5.6.1.3 Green and Bio Polyols Market Size & Forecast, By Application, 2021 – 2032

   9.5.6.1.4 Green and Bio Polyols Market Size & Forecast, By End-Use Industry, 2021 – 2032

  9.5.6.2 Argentina

   9.5.6.2.1 Green and Bio Polyols Market Size & Forecast, By Raw Material, 2021 – 2032

   9.5.6.2.2 Green and Bio Polyols Market Size & Forecast, By Type, 2021 – 2032

   9.5.6.2.3 Green and Bio Polyols Market Size & Forecast, By Application, 2021 – 2032

   9.5.6.2.4 Green and Bio Polyols Market Size & Forecast, By End-Use Industry, 2021 – 2032

  9.5.6.3 Mexico

   9.5.6.3.1 Green and Bio Polyols Market Size & Forecast, By Raw Material, 2021 – 2032

   9.5.6.3.2 Green and Bio Polyols Market Size & Forecast, By Type, 2021 – 2032

   9.5.6.3.3 Green and Bio Polyols Market Size & Forecast, By Application, 2021 – 2032

   9.5.6.3.4 Green and Bio Polyols Market Size & Forecast, By End-Use Industry, 2021 – 2032

  9.5.6.4 Colombia

   9.5.6.4.1 Green and Bio Polyols Market Size & Forecast, By Raw Material, 2021 – 2032

   9.5.6.4.2 Green and Bio Polyols Market Size & Forecast, By Type, 2021 – 2032

   9.5.6.4.3 Green and Bio Polyols Market Size & Forecast, By Application, 2021 – 2032

   9.5.6.4.4 Green and Bio Polyols Market Size & Forecast, By End-Use Industry, 2021 – 2032

  9.5.6.5 Rest of Latin America

   9.5.6.5.1 Green and Bio Polyols Market Size & Forecast, By Raw Material, 2021 – 2032

   9.5.6.5.2 Green and Bio Polyols Market Size & Forecast, By Type, 2021 – 2032

   9.5.6.5.3 Green and Bio Polyols Market Size & Forecast, By Application, 2021 – 2032

   9.5.6.5.4 Green and Bio Polyols Market Size & Forecast, By End-Use Industry, 2021 – 2032

9.6 Middle East & Africa

 9.6.1 Key Trends

 9.6.2 Green and Bio Polyols Market Size & Forecast, By Raw Material, 2021 – 2032

 9.6.3 Green and Bio Polyols Market Size & Forecast, By Type, 2021 – 2032

 9.6.4 Green and Bio Polyols Market Size & Forecast, By Application, 2021 – 2032

 9.6.5 Green and Bio Polyols Market Size & Forecast, By End-Use Industry, 2021 – 2032

 9.6.6 Green and Bio Polyols Market Size & Forecast, By Country, 2021 – 2032

  9.6.6.1 UAE

   9.6.6.1.1 Green and Bio Polyols Market Size & Forecast, By Raw Material, 2021 – 2032

   9.6.6.1.2 Green and Bio Polyols Market Size & Forecast, By Type, 2021 – 2032

   9.6.6.1.3 Green and Bio Polyols Market Size & Forecast, By Application, 2021 – 2032

   9.6.6.1.4 Green and Bio Polyols Market Size & Forecast, By End-Use Industry, 2021 – 2032

  9.6.6.2 Saudi Arabia

   9.6.6.2.1 Green and Bio Polyols Market Size & Forecast, By Raw Material, 2021 – 2032

   9.6.6.2.2 Green and Bio Polyols Market Size & Forecast, By Type, 2021 – 2032

   9.6.6.2.3 Green and Bio Polyols Market Size & Forecast, By Application, 2021 – 2032

   9.6.6.2.4 Green and Bio Polyols Market Size & Forecast, By End-Use Industry, 2021 – 2032

  9.6.6.3 Qatar

   9.6.6.3.1 Green and Bio Polyols Market Size & Forecast, By Raw Material, 2021 – 2032

   9.6.6.3.2 Green and Bio Polyols Market Size & Forecast, By Type, 2021 – 2032

   9.6.6.3.3 Green and Bio Polyols Market Size & Forecast, By Application, 2021 – 2032

   9.6.6.3.4 Green and Bio Polyols Market Size & Forecast, By End-Use Industry, 2021 – 2032

  9.6.6.4 Egypt

   9.6.6.4.1 Green and Bio Polyols Market Size & Forecast, By Raw Material, 2021 – 2032

   9.6.6.4.2 Green and Bio Polyols Market Size & Forecast, By Type, 2021 – 2032

   9.6.6.4.3 Green and Bio Polyols Market Size & Forecast, By Application, 2021 – 2032

   9.6.6.4.4 Green and Bio Polyols Market Size & Forecast, By End-Use Industry, 2021 – 2032

  9.6.6.5 South Africa

   9.6.6.5.1 Green and Bio Polyols Market Size & Forecast, By Raw Material, 2021 – 2032

   9.6.6.5.2 Green and Bio Polyols Market Size & Forecast, By Type, 2021 – 2032

   9.6.6.5.3 Green and Bio Polyols Market Size & Forecast, By Application, 2021 – 2032

   9.6.6.5.4 Green and Bio Polyols Market Size & Forecast, By End-Use Industry, 2021 – 2032

  9.6.6.6 Rest of Middle East & Africa

   9.6.6.6.1 Green and Bio Polyols Market Size & Forecast, By Raw Material, 2021 – 2032

   9.6.6.6.2 Green and Bio Polyols Market Size & Forecast, By Type, 2021 – 2032

   9.6.6.6.3 Green and Bio Polyols Market Size & Forecast, By Application, 2021 – 2032

   9.6.6.6.4 Green and Bio Polyols Market Size & Forecast, By End-Use Industry, 2021 – 2032

10. Competitive Landscape

 10.1 Key Players' Positioning

 10.2 Competitive Developments

  10.2.1 Key Strategies Adopted (%), By Key Players, 2024

  10.2.2 Year-Wise Strategies & Development, 2021 – 2025

  10.2.3 Number of Strategies Adopted by Key Players, 2024

 10.3 Market Share Analysis, 2024

 10.4 Product/Service & End-Use Industry Benchmarking

  10.4.1 Product/Service Specifications & Features By Key Players

  10.4.2 Product/Service Heatmap By Key Players

  10.4.3 End-Use Industry Heatmap By Key Players

 10.5 Industry Start-Up & Innovation Landscape

10.6 Key Company Profiles

10.6.1 BASF SE

  10.6.1.1 Company Overview & Snapshot

  10.6.1.2 Product/Service Portfolio

  10.6.1.3 Key Company Financials

  10.6.1.4 SWOT Analysis

10.6.2 Biobased Technologies LLC

  10.6.2.1 Company Overview & Snapshot

  10.6.2.2 Product/Service Portfolio

  10.6.2.3 Key Company Financials

  10.6.2.4 SWOT Analysis

10.6.3 E.I. Du Pont De Nemours & Co.

  10.6.3.1 Company Overview & Snapshot

  10.6.3.2 Product/Service Portfolio

  10.6.3.3 Key Company Financials

  10.6.3.4 SWOT Analysis

10.6.4 Bayer AG

  10.6.4.1 Company Overview & Snapshot

  10.6.4.2 Product/Service Portfolio

  10.6.4.3 Key Company Financials

  10.6.4.4 SWOT Analysis

10.6.5 Emery Oleochemicals

  10.6.5.1 Company Overview & Snapshot

  10.6.5.2 Product/Service Portfolio

  10.6.5.3 Key Company Financials

  10.6.5.4 SWOT Analysis

10.6.6 Jayant Agro Organics Pvt., Ltd.

  10.6.6.1 Company Overview & Snapshot

  10.6.6.2 Product/Service Portfolio

  10.6.6.3 Key Company Financials

  10.6.6.4 SWOT Analysis

10.6.7 Cargill, Inc.

  10.6.7.1 Company Overview & Snapshot

  10.6.7.2 Product/Service Portfolio

  10.6.7.3 Key Company Financials

  10.6.7.4 SWOT Analysis

10.6.8 Koch Industries

  10.6.8.1 Company Overview & Snapshot

  10.6.8.2 Product/Service Portfolio

  10.6.8.3 Key Company Financials

  10.6.8.4 SWOT Analysis

10.6.9 DOW Chemical Company

  10.6.9.1 Company Overview & Snapshot

  10.6.9.2 Product/Service Portfolio

  10.6.9.3 Key Company Financials

  10.6.9.4 SWOT Analysis

10.6.10 Mitsui Chemicals

  10.6.10.1 Company Overview & Snapshot

  10.6.10.2 Product/Service Portfolio

  10.6.10.3 Key Company Financials

  10.6.10.4 SWOT Analysis

10.6.11 Global Bio-Chem Technology Group

  10.6.11.1 Company Overview & Snapshot

  10.6.11.2 Product/Service Portfolio

  10.6.11.3 Key Company Financials

  10.6.11.4 SWOT Analysis

10.6.12 Huntsman Corporation

  10.6.12.1 Company Overview & Snapshot

  10.6.12.2 Product/Service Portfolio

  10.6.12.3 Key Company Financials

  10.6.12.4 SWOT Analysis

10.6.13 Covestro

  10.6.13.1 Company Overview & Snapshot

  10.6.13.2 Product/Service Portfolio

  10.6.13.3 Key Company Financials

  10.6.13.4 SWOT Analysis

10.6.14 Hexion Inc.

  10.6.14.1 Company Overview & Snapshot

  10.6.14.2 Product/Service Portfolio

  10.6.14.3 Key Company Financials

  10.6.14.4 SWOT Analysis

10.6.15 Solvay S.A.

  10.6.15.1 Company Overview & Snapshot

  10.6.15.2 Product/Service Portfolio

  10.6.15.3 Key Company Financials

  10.6.15.4 SWOT Analysis

10.6.16 Wanhua Chemical Group

  10.6.16.1 Company Overview & Snapshot

  10.6.16.2 Product/Service Portfolio

  10.6.16.3 Key Company Financials

  10.6.16.4 SWOT Analysis

10.6.17 Clariant AG

  10.6.17.1 Company Overview & Snapshot

  10.6.17.2 Product/Service Portfolio

  10.6.17.3 Key Company Financials

  10.6.17.4 SWOT Analysis

10.6.18 Lanxess AG

  10.6.18.1 Company Overview & Snapshot

  10.6.18.2 Product/Service Portfolio

  10.6.18.3 Key Company Financials

  10.6.18.4 SWOT Analysis

10.6.19 Celanese Corporation

  10.6.19.1 Company Overview & Snapshot

  10.6.19.2 Product/Service Portfolio

  10.6.19.3 Key Company Financials

  10.6.19.4 SWOT Analysis

10.6.20 Indorama Ventures

  10.6.20.1 Company Overview & Snapshot

  10.6.20.2 Product/Service Portfolio

  10.6.20.3 Key Company Financials

  10.6.20.4 SWOT Analysis

11. Analyst Recommendations

 11.1 SNS Insider Opportunity Map

 11.2 Industry Low-Hanging Fruit Assessment

 11.3 Market Entry & Growth Strategy

 11.4 Analyst Viewpoint & Suggestions On Market Growth

12. Assumptions

13. Disclaimer

14. Appendix

 14.1 List Of Tables

 14.2 List Of Figures

Key Market Segments:

By Raw Material

  • Natural Oils and their Derivatives

  • Sucrose

  • Glycerin

  • Carbon Dioxide

By Type

  • Polyether Polyols

  • Polyester Polyols

By Application

  • PU Flexible Foam

  • CASE

  • PU Rigid Foam

By End-Use Industry

  • Furniture and Bedding

  • Construction

  • Automotive

  • Packaging

  • Carpet Backing

  • Others

Request for Segment Customization as per your Business Requirement: Segment Customization Request


Regional Coverage: 

North America

  • US

  • Canada

Europe

Asia Pacific

  • China

  • India

  • Japan

  • South Korea

  • ASEAN Countries

  • Australia

  • Rest of Asia Pacific

Latin America

  • Brazil

  • Argentina

  • Mexico

  • Colombia

  • Rest of Latin America

Middle East & Africa

  • UAE

  • Saudi Arabia

  • Qatar

  • Egypt

  • South Africa

  • Rest of Middle East & Africa

Request for Country Level Research Report: Country Level Customization Request

Available Customization 

With the given market data, SNS Insider offers customization as per the company’s specific needs. The following customization options are available for the report: 

  • Detailed Volume Analysis 

  • Criss-Cross segment analysis (e.g. Product X Application) 

  • Competitive Product Benchmarking 

  • Geographic Analysis 

  • Additional countries in any of the regions 

  • Customized Data Representation 

  • Detailed analysis and profiling of additional market players

An accurate research report requires proper strategizing as well as implementation. There are multiple factors involved in the completion of good and accurate research report and selecting the best methodology to compete the research is the toughest part. Since the research reports we provide play a crucial role in any company’s decision-making process, therefore we at SNS Insider always believe that we should choose the best method which gives us results closer to reality. This allows us to reach at a stage wherein we can provide our clients best and accurate investment to output ratio.

Each report that we prepare takes a timeframe of 350-400 business hours for production. Starting from the selection of titles through a couple of in-depth brain storming session to the final QC process before uploading our titles on our website we dedicate around 350 working hours. The titles are selected based on their current market cap and the foreseen CAGR and growth.


The 5 steps process:

Step 1: Secondary Research:

Secondary Research or Desk Research is as the name suggests is a research process wherein, we collect data through the readily available information. In this process we use various paid and unpaid databases which our team has access to and gather data through the same. This includes examining of listed companies’ annual reports, Journals, SEC filling etc. Apart from this our team has access to various associations across the globe across different industries. Lastly, we have exchange relationships with various university as well as individual libraries.

Secondary Research

Step 2: Primary Research

When we talk about primary research, it is a type of study in which the researchers collect relevant data samples directly, rather than relying on previously collected data.  This type of research is focused on gaining content specific facts that can be sued to solve specific problems. Since the collected data is fresh and first hand therefore it makes the study more accurate and genuine.

We at SNS Insider have divided Primary Research into 2 parts.

Part 1 wherein we interview the KOLs of major players as well as the upcoming ones across various geographic regions. This allows us to have their view over the market scenario and acts as an important tool to come closer to the accurate market numbers. As many as 45 paid and unpaid primary interviews are taken from both the demand and supply side of the industry to make sure we land at an accurate judgement and analysis of the market.

This step involves the triangulation of data wherein our team analyses the interview transcripts, online survey responses and observation of on filed participants. The below mentioned chart should give a better understanding of the part 1 of the primary interview.

Primary Research

Part 2: In this part of primary research the data collected via secondary research and the part 1 of the primary research is validated with the interviews from individual consultants and subject matter experts.

Consultants are those set of people who have at least 12 years of experience and expertise within the industry whereas Subject Matter Experts are those with at least 15 years of experience behind their back within the same space. The data with the help of two main processes i.e., FGDs (Focused Group Discussions) and IDs (Individual Discussions). This gives us a 3rd party nonbiased primary view of the market scenario making it a more dependable one while collation of the data pointers.

Step 3: Data Bank Validation

Once all the information is collected via primary and secondary sources, we run that information for data validation. At our intelligence centre our research heads track a lot of information related to the market which includes the quarterly reports, the daily stock prices, and other relevant information. Our data bank server gets updated every fortnight and that is how the information which we collected using our primary and secondary information is revalidated in real time.

Data Bank Validation

Step 4: QA/QC Process

After all the data collection and validation our team does a final level of quality check and quality assurance to get rid of any unwanted or undesired mistakes. This might include but not limited to getting rid of the any typos, duplication of numbers or missing of any important information. The people involved in this process include technical content writers, research heads and graphics people. Once this process is completed the title gets uploader on our platform for our clients to read it.

Step 5: Final QC/QA Process:

This is the last process and comes when the client has ordered the study. In this process a final QA/QC is done before the study is emailed to the client. Since we believe in giving our clients a good experience of our research studies, therefore, to make sure that we do not lack at our end in any way humanly possible we do a final round of quality check and then dispatch the study to the client.