Integrated Silicon Photonic Switch Fabric Market Size Analysis:
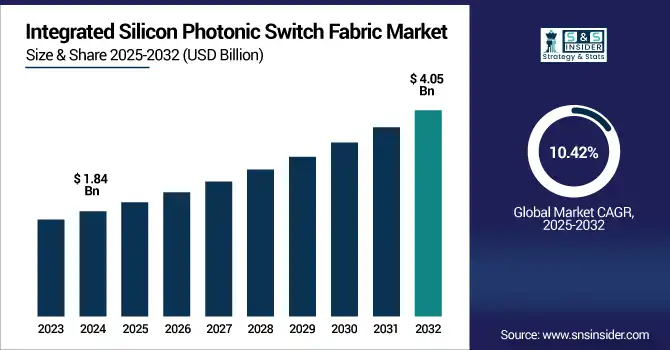
The Integrated Silicon Photonic Switch Fabric Market Size was valued at USD 1.84 billion in 2024 and is expected to reach USD 4.05 billion by 2032 and grow at a CAGR of 10.42% over the forecast period 2025-2032.
To Get more information on Integrated Silicon Photonic Switch Fabric Market - Request Free Sample Report
The Global Market is further segmented based on product, component, and application and region-wise into various countries. The increasing demand for high speed, energy efficient data communication in data centres and high-performance computing (HPC) environments, along with continuous improvements in technologies of photonic integration, are driving the overall growth of the market. Integrated Silicon Photonic Switch Fabric Market analysis reveals rapid adoption across industries. Hence these aspects are revolutionizing the scenario and leading to higher adoption of integrated silicon photonic switch fabrics in a number of applications worldwide, which include high-performance as well as data-intensive areas.
For instance, over 70% of newly developed optical transceivers for AI clusters now feature some level of silicon photonic integration.
The U.S. Integrated Silicon Photonic Switch Fabric Market size was USD 0.50 billion in 2024 and is expected to reach USD 1.04 billion by 2032, growing at a CAGR of 9.77% over the forecast period of 2025–2032.
The U.S. Market is expected to grow significantly owing to the large presence of the hyperscale data centers, increasing demands of AI workloads and early adoption of advanced optical interconnect technologies. Complementing market growth further is robust government and private level spending in on-shore semiconductor fabrication and photonics operating infrastructure. All of these factors together justify the need of integrated silicon photonic switch fabrics for their commercialization in high performance computing and next generation communication systems available for local use in the country.
For instance, the U.S. hosts over 45% of the world’s hyperscale data centers, with more than 300 facilities operating nationwide as of 2024.
Integrated Silicon Photonic Switch Fabric Market Dynamics:
Key Drivers:
-
Technological Advancements in Silicon Photonics Enabling Scalable, Low-Cost Integration of Optical Switch Fabrics
Due to the continued drive towards ever-smaller and more integrated photonic components leveraging CMOS-compatible processes, it has led to corresponding reductions in cost and complexity to deploy. As wafer-level integration is maturing, the silicon photonic switch fabrics are shrinking and becoming more power-efficient and thus may be ready for commercialization in telecom, data center and possibly medical diagnosis too. The technology is becoming viable for wider commercial applications as major players achieve higher port densities and performance metrics at a lower cost per port. These disruptive Dynamics innovations are leading to new use cases and paving the way for mass adoption.
For instance, Silicon photonic switch fabrics can reduce energy consumption by up to 80% per bit compared to traditional electrical interconnects.
Restraints:
-
Thermal Management and Optical Signal Losses Pose Challenges in High-Density Switch Fabric Integration
The challenge of efficiently managing thermal loads has increased with the scale-down of photonic devices and their integration into tighter spaces. High temperatures lead to signal distortion, lower component life, and affect switching accuracy. In addition, due to a controlled dimensions for fabrication and packaging which lead to a considerable technical challenge, reducing insertion loss and crosstalk without giving up for a large bandwidth range is a necessity. This performance limitation has restricted the deployment of photonic switch technologies in scenarios where the operational stability and low signal distortion are crucial leading to a delayed market adoption in broader applications.
Opportunities:
-
Expanding Adoption of Photonics in Medical Diagnostics and Biosensing Creates New Market Frontiers
Integrated silicon photonics, however, is getting increasingly traction not just for data centers and telecom but also for medical applications owing to its accuracy, small form factor, and low-energy consumption. On the other hand, switch fabrics are pushing development of smaller and multiplexed diagnostic systems with point-of-care and wearables for health monitoring. Integrated Silicon Photonic Switch Fabric Market growth is accelerating through emerging healthcare applications. Photonic switch integration enables scalable and economical solutions as healthcare systems increasingly require real-time data and non-invasive diagnostics. Breakthroughs in lab-on-chip technologies and optical sensing provide a unique and largely unfocused growth path in healthcare.
For instance, more than 60% of new clinical diagnostic devices under development in 2024 utilize some form of optical or photonic integration.
Challenges:
-
Lack of Standardization and Interoperability Across Photonic Switch Ecosystems Limits Integration Flexibility
The rapid advancement of silicon photonic switches is tempered with the fact that there are no widely accepted standards associated with design, packaging and testing. Proprietary architecture and tight integration of components from multiple vendors make interoperability and cross-platform integration difficult, as well as expensive in terms of the business processes that need to devices the components. Such fragmentation carries a risk for the end user, particularly in mission-critical environments where reliability and upgradeability are important. In the absence of common standards, the market may struggle to scale as customers fear investing in potentially incompatible solutions and vendor lock-in situations.
Integrated Silicon Photonic Switch Fabric Market Segmentation Analysis:
By Product
Transceivers segment covered with highest Integrated Silicon Photonic Switch Fabric Market share of 31.20% in 2024. The dominance of serial transceivers is attributed to their necessity in high rate data transmission through switches, servers, and routers. The benefit of integrated photonic transceivers is that they have higher energy efficiency and data density. Integrated Silicon Photonic Switch Fabric Market trends highlight transceiver innovation and efficiency. Intel Corporation, for example, is at the leading edge of developing scalable silicon photonic transceivers for massive cloud infrastructure that are a central part of state-of-the-art data center operations and optical networking expansion in the coming decades.
The Switch segment is expected to witness the fastest CAGR of nearly 12.05% from 2024 to 2032, due to the growing requirement for high-capacity, versatile optical switching to be utilized in AI and high-performance computing. Today, highly integrated photonic switches offer enhanced capabilities, breaking through the bandwidth and latency bottlenecks of traditional switches. Companies such as Rockley Photonics are pushing dynamic switch fabric technologies for data center and telecom applications, speeding availability in low-latency markets where bandwidth scaling is quickly outstripping electronic switch throughput.
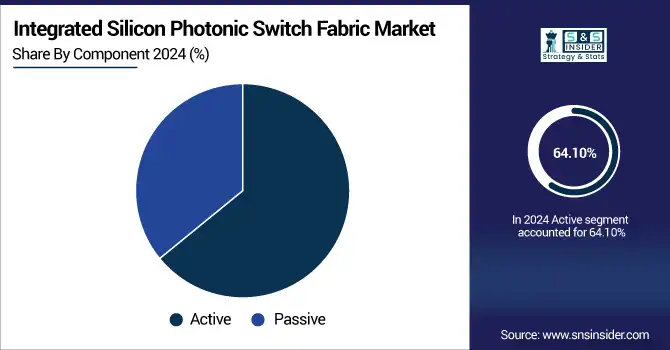
By Component
The Integrated Silicon Photonic Switch Fabric Market in 2024 was led by Active segment, with significant revenue share of around 64.10%, as these elements play a crucial role in the modulation, switching, and amplification of signals. While active photonic components have better control and programmability capabilities, they are better suited for the constantly changing requirements of optical networking. Active components continue to see market acceptance facilitated by the decrease in cost per port through photonic integration that Cisco Systems, Inc. has been funding with expenditures well beyond Ethernet switch and optical router sales. In addition, due to the rapid demand for dynamic photonic solutions in diverse AI, cloud, and telecommunications applications that necessitate flexibility and reconfigurability, active segment is also anticipated to witness highest CAGR of approximately 10.99% during the calculation period 2024-2032, compared to passive alternatives.
By Application
The Integrated Silicon Photonic Switch Fabric Market was dominated by the Data center & HPC segment by 49.3% revenue share in 2024. Having ultra-fast, low-latency interconnects capable of scaling from multicore server architectures all the way to the cloud and data center, photonic switch fabrics ideally fit the bill with their efficiency across a range of workloads, from cloud computing to AI and HPC. High-throughput optical platforms from companies including Nokia Corporation, which support massive scale-out architectures deployed in hyperscale data centers, dominate this segment with the majority of revenue coming from this sector in 2024.
The Medical segment is anticipated to witness the highest CAGR growth of around 13.06% over the forecast period 2024-2032. In biosensors & diagnostics & point of care devices where precision & miniaturization is very essential, demand is growing for photonic switch fabrics which is the key growth driver the photonic switch fabrics market. It allows testing in real time without being invasive due to photonic technologies. Santec Corporation, a photonic components provider for medical applications is driving this growth via its novel tunable lasers and switches for healthcare diagnostics and monitoring systems.
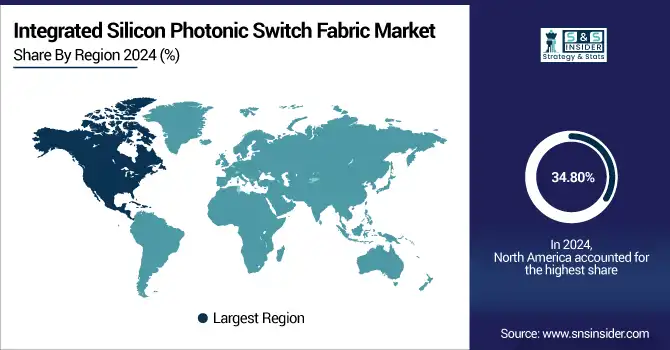
Integrated Silicon Photonic Switch Fabric Market Regional Analysis:
North America held the largest revenue share of approximately 34.80% through 2024 in the Integrated Silicon Photonic Switch Fabric industry owing to early adoption of photonic technologies, impenetrable semiconductor infrastructure and increasing proliferation of hyperscale data centers by technology stalwarts such as Google, Amazon, and Microsoft. With presence of innovation-driven companies including Ayar Labs and bionic federal funding initiatives, the region is positioned to be a front-runner of integrated silicon photonics and optical interconnect solutions.
-
The U.S. leads the North American market due to its strong presence of hyperscale data centers, advanced semiconductor ecosystem, early adoption of photonic technologies, and significant investments by key players including Intel and Ayar Labs in integrated silicon photonics.
Asia Pacific is projected to grow at the fastest CAGR of approximately 11.28% in the forecast period, from 2024 to 2032, owing to initiatives supporting photonics R&D programs at government level, growing investment in semiconductor fabrication, and intense growth of high-speed internet infrastructure. There is an increasing demand for optical data transmission in the countries such as China, Japan and South Korea. Entities such as Fujitsu are pushing boundaries in silicon photonics to enable next-gen telecom, datacenter & healthcare applications in the Asia Pacific region.
-
China dominates the Asia Pacific market with large-scale government-backed photonics R&D, rapid expansion of 5G and internet infrastructure, and major investments by domestic firms such as Huawei in optical interconnects and next-generation data communication technologies.
Europe accounts for a major share in Integrated Silicon Photonic Switch Fabric Market owing to strong research facilities followed by a push for innovation from the government and increasing demand for energy-efficient data communication. TAM is growing in the region with acceleration in telecom, data centers and automotive. As evidenced by the recent announcement of this partnership, the Germans, French, and Dutch continue to push the envelope through academia, smart funding, and early implementation of silicon photonics into next-generation communication networks.
-
Germany dominates the European Integrated Silicon Photonic Switch Fabric Market due to its strong semiconductor ecosystem, advanced photonics research, and government support for high-speed communication technologies. Its leadership in industrial automation and growing data center infrastructure further boost market adoption.
The Middle East & Africa market is being dominated by the UAE, due to several smart city projects, and thriving digital transformation in addition to the increasing data centers investments. Brazil is going to be the most important market in Latin America, driven by increased telecommunications infrastructure, growing Internet broadband penetration, and favorable government policies enhancing high-speed broadband capacity, and the use of photonic technologies in major sectors.
Get Customized Report as per Your Business Requirement - Enquiry Now
Key Players:
The Integrated Silicon Photonic Switch Fabric Companies are Intel Corporation, Cisco Systems, Inc., Broadcom Inc., Ayar Labs, IBM Corporation, Juniper Networks, Inc., NeoPhotonics Corporation, GlobalFoundries, Hewlett Packard Enterprise (HPE) and II-VI Incorporated and others.
Recent Developments:
-
In December 2024, Intel Corporation partnered with NTT and SK Hynix to advance next-gen silicon photonics, highlighting chipset integration for AI and telecom applications.
-
In March 2024, Broadcom Inc. launched 200 G‑per‑lane VCSEL and EML components, advancing terabit interconnect density for AI/ML infrastructure.
| Report Attributes | Details |
|---|---|
| Market Size in 2024 | USD 1.84 Billion |
| Market Size by 2032 | USD 4.05 Billion |
| CAGR | CAGR of 10.42% From 2025 to 2032 |
| Base Year | 2024 |
| Forecast Period | 2025-2032 |
| Historical Data | 2021-2023 |
| Report Scope & Coverage | Market Size, Segments Analysis, Competitive Landscape, Regional Analysis, DROC & SWOT Analysis, Forecast Outlook |
| Key Segments | • By Product (Transceivers, Variable optical attenuator, Switch, Cable, Sensor, Others) • By Component (Active, Passive) • By Application (Data center & HPC, Telecommunications, Medical, Others) |
| Regional Analysis/Coverage | North America (US, Canada, Mexico), Europe (Germany, France, UK, Italy, Spain, Poland, Turkey, Rest of Europe), Asia Pacific (China, India, Japan, South Korea, Singapore, Australia, Taiwan, Rest of Asia Pacific), Middle East & Africa (UAE, Saudi Arabia, Qatar, South Africa, Rest of Middle East & Africa), Latin America (Brazil, Argentina, Rest of Latin America) |
| Company Profiles | Intel Corporation, Cisco Systems, Inc., Broadcom Inc., Ayar Labs, IBM Corporation, Juniper Networks, Inc., NeoPhotonics Corporation, GlobalFoundries, Hewlett Packard Enterprise (HPE) and II-VI Incorporated. |
Frequently Asked Questions
North America dominated the Integrated Silicon Photonic Switch Fabric Market in 2024.
Transceivers segment dominated the Integrated Silicon Photonic Switch Fabric Market.
Rising demand for high-speed, energy-efficient data communication in data centers and HPC systems is driving Integrated Silicon Photonic Switch Fabric Market.
The Integrated Silicon Photonic Switch Fabric Market size was USD 1.84 billion in 2024 and is expected to reach USD 4.05 billion by 2032.
The Integrated Silicon Photonic Switch Fabric Market is expected to grow at a CAGR of 10.42% from 2025-2032.
Get in Touch
