Membranes Market Report Scope & Overview:

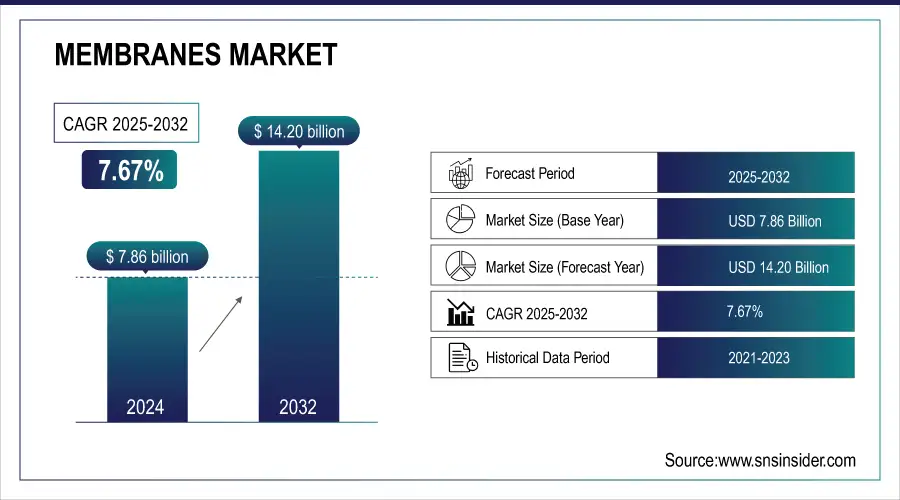
The Membranes Market size was valued at USD 7.86 Billion in 2024 and is expected to reach USD 14.20 Billion by 2032 expanding at a CAGR of 7.67% over the forecast period of 2025-2032. Energy-efficient filtration methods are gaining traction in different sectors to minimize the environmental impact and operational cost of industries. The use of membrane technologies, among others for water treatment and industrial separation, provides higher energy savings over thermal processes. Membranes use much less energy for separation because they rely on physical filtration instead of heat, making them financially and environmentally beneficial. Such a transition is particularly evident in energy-intensive industries such as chemical processing, food and beverage, and pharmaceuticals with increasing sustainability incentives. Consequently, it also means that membranes are now emerging as the technology of choice for companies looking to achieve efficiency and sustainability targets.

Membranes Market Revenue Analysis

Get more information on Membranes Market - Request Sample Report

The U.S. Environmental Protection Agency (EPA) for example reports that the use of advanced membrane filtration systems can result in an energy reduction of up to 40% in wastewater treatment applications compared with conventionally thermal separation technologies, emphasizing efficiency improvements that have been enabled via membrane technologies.


Key Membranes Market Trends

  • Technological advancements in membrane materials, including ceramic and polymer innovations.

  • Rising demand for water treatment, desalination, and wastewater recycling.

  • Growing applications in biopharmaceuticals for drug production and purification.

  • Increasing use in the food and beverage industry for clarification, concentration, and purification.

  • Adoption driven by stricter environmental and health regulatory compliance.

  • Expansion of smart water management and IoT-integrated membrane systems.

  • Emphasis on sustainable and energy-efficient membrane solutions.

Membranes-Market-US

Membranes Market Growth Drivers

  • Scarcity of freshwater increasing popularity in the market.

  • Growing pharmaceutical & biomedical advancements in the membranes market.

Around the world, demand from a vibrant pharmaceutical and biomedical industry will continue driving growth in the membranes market. Membrane technologies are important for pharmaceutical and biomedical-related applications where a much higher level of precision, sterility, or purity is needed in the operations involved. Membranes play a stage key role in separating and purifying active ingredients, concentrating enzymes, antibodies and other substances of interest, as well as removing contaminants in pharmaceutical manufacturing. The increasing use of biologic drugs and gene therapies which are delicate and complicated in production have examined the pipeline demand for advanced filtration approaches provided by membrane. Membrane filtration, found in a range of industries, from pharmaceuticals to municipal water supply, is also critical for biomedical research where it grounds cell separation and protein isolation as well as tissue engineering with the aim to cultivate regenerative therapies and diagnostics.

According to the U.S. Food and Drug Administration (FDA), membrane-based filtration is required for sterilizing injectable drugs, which account for over 50% of biopharmaceuticals produced in the United States, demonstrating the critical role of membrane technology in maintaining stringent quality standards in drug production.

Membranes Market Growth Restraint

  • Rising capital costing in the membrane Industry.

The membrane industry faces challenges due to high capital costs. This discourages new players, making it dominated by establishing. Small companies struggling to compete with the high upfront investment needed to set up membrane modules for various applications.  These hefty costs create a significant barrier to entry, limiting competition and innovation in the market.  Established players leverage their economies of scale and existing infrastructure to further solidify their dominance.  To overcome this hurdle, potential solutions include government incentives for new entrants, particularly those focused on innovation, or a strategic shift for smaller players to target niche markets with lower initial investment requirements.

Membranes Market Growth Opportunities

  • Focus on Wastewater Treatment and Regulating strict boundaries.

The US Environmental Protection Agency (EPA) has this trend with its stringent regulations. The Clean Water Act, a cornerstone of US water pollution control, targeted sources that discharge contaminants into water bodies. This act maintains stricter wastewater treatment standards and the use of advanced technologies like membrane filtration. These toxic pollutants can pose serious health risks and disrupt aquatic ecosystems. Membranes filter them out, ensuring cleaner wastewater discharge. Membrane filtration plays a major role in safeguarding public health by removing this harmful microbial wastewater.

Membranes Market Segment Highlights:
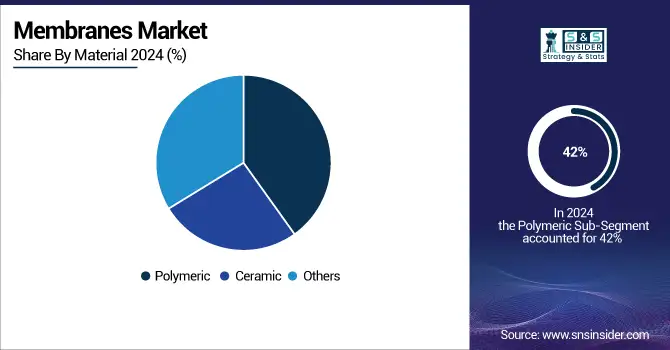
By Material

The polymeric held the largest market share around 42% in 2023. It has rising popularity due to polymeric materials (like PVDF, PES, and PA) which are the building blocks for most membranes. These polymers offer a powerful one-two punch: affordability and impressive performance. The PVDF, for instance, is a champion in both strength and chemical resistance, making it a popular choice.  This cost advantage over ceramic membranes makes polymeric options the clear favorite for applications like water and wastewater treatment.  This widespread adoption translates to polymeric materials holding the largest market share in the membrane industry.

Membranes-Market-By-Material

By Technology

The nanofiltration (NF) seg-segment is the fastest growing within the membrane market in 2023 by technology.  These wonder-workers excel at removing dissolved solids from water sources, making them invaluable for applications in various industries.  From food & beverage purification to pharmaceutical processing, NF membranes are in high demand due to their exceptional selectivity properties.  This, coupled with rising industrialization and a growing global population, is fueling the rapid expansion of the NF segment within the membrane market.

By Application

Water & wastewater treatment applications held the largest market share around 44% in 2023. Due to the increasing demand for clean water and strict environmental regulations worldwide. Water scarcity, especially in the developing part of the world, is a growing problem due to the rapid pace of industrialization, urbanization and population rise. Membrane filtration technologies including reverse osmosis, ultrafiltration, and nanofiltration play a pivotal role in treating and purifying municipal as well as industrial wastewater to facilitate recycling and reuse of water. By eliminating contaminants, chemicals, and pathogens, these technologies guarantee that wastewater released into the environment or reused in industrial processes complies with applicable regulations.

Membranes Market Regional Analysis

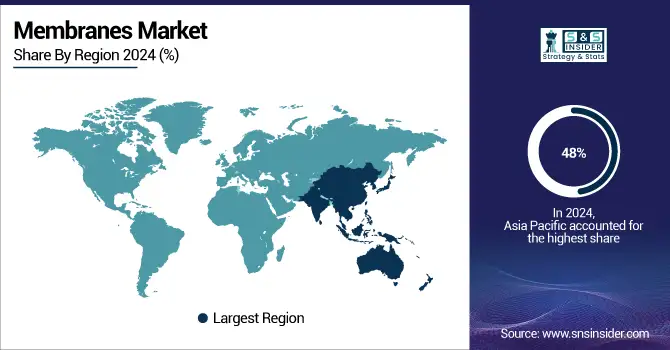
Asia Pacific Membranes Market Insights

The Asia Pacific membranes market has the largest share around 48% in 2023. It is due to rapid industrial growth, increasing urbanization, and increasing water scarcity in the Asia pacific regions China, India, and Japan are among those countries with high levels of industrial pollution, population density, and limited fresh water providing huge environmental challenges. This, in turn, has increased the demand for high-performance water and wastewater treatment solutions along with the increasing investments in water infrastructure by governments and environmental policies. These increasing demands have widely utilized membrane technologies that are one of the successful techniques in water purification and reuse for both municipal and industrial applications.

Moreover, significant developments of pharmaceutical, food and beverage, and chemical industries in Asia-Pacific include membrane filtration to control product purity and regulatory compliance. High-quality membrane systems are also in higher demand due to the growing biopharmaceutical industry in the region. 

Membranes-Market-By-Region

Get Customized Report as per your Business Requirement - Request For Customized Report

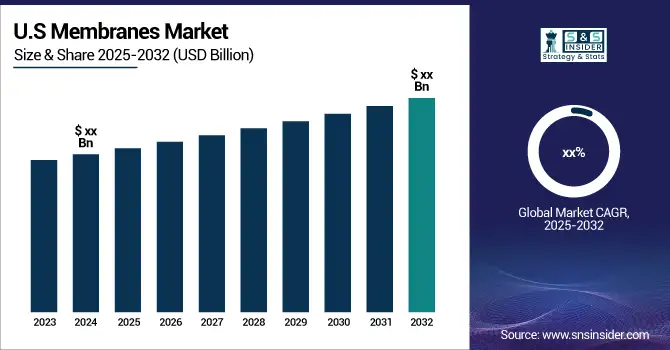
North America Membranes Market Insights

North America is well-established and growing significantly with high growth opportunities for membranes due to technological advancements and strong government regulations for water treatment and environmental protection. The US and Canada are the dominant countries in the region, as they are concentrating on advanced water purification, industrial application, and wastewater reuse. The heavy investment in infrastructure, the growing numbers of stringent regulations against clean water and the environment protection mainly stimulated the increasing reliance of the advanced membrane technologies.

Europe Membranes Market Insights

Europe constituted around 18.07% share of the membrane market – globally. The demand in the regional market is shaped by stringent environmental regulations, sustainability drives, and emphasis on cutting down industrial emissions and use of chemicals. Major countries such as Germany, France, and Italy are spending in green and energy efficient membrane technologies for water treatment, industrial processes, and the food & beverage applications. High-performance membranes, precision filtration and bio-based solutions are driving moderate growth for Europe’s stress ECO System, with an emphasis on innovation and compliance with regulations and environmental standards.

Latin America (LATAM) and Middle East & Africa (MEA) Membranes Market Insights

The Latin America (LATAM) and the Middle East & Africa (MEA) membranes market is anticipated to grow at a substantial rate on account of the increasing applications of clean water, wastewater treatment, and desalination technologies. With an exploding urbanization and market needs for process optimization, water-rich countries such as Brazil, Mexico and Chile in LATAM are increasingly choosing membranes to address water scarcity problems, same with industries like food and beverages and pharmaceuticals.

Membranes Market Competitive Landscape:

Toray Industries Inc.

Toray Industries Inc. is a leading manufacturer of advanced membrane technologies and filtration solutions, serving water treatment, industrial, and healthcare applications.

  • In March 2024, Toray Industries introduced a game-changing reverse osmosis (RO) membrane designed for exceptional longevity. This highly durable membrane not only saves water but also exhibits double the chemical resistance, requiring replacement less frequently and minimizing its environmental impact.

Asahi Kasei Corporation

Asahi Kasei Corporation is a diversified global company providing medical devices, chemicals, and innovative materials solutions.

  • In April 2024, Asahi Kasei Corporation introduced TrachFlush, a new medical device designed to improve the comfort of ventilated patients undergoing tracheal suctioning. This innovative device utilizes the ventilator's air pressure to clear airway secretions, reducing discomfort for patients and workload for healthcare professionals.

Membranes Market Key Companies:

  • Toray Industries Inc. (TORAYFIL)

  • Koch Separation Solutions (PURON)

  • Pall Corporation (SUPRAdisc)

  • Asahi Kasei Corporation (Microza)

  • 3M (3M Liqui-Flux)

  • Hydranautics (ESPA Series)

  • Mann+Hummel (Water & Wastewater Membranes)

  • DuPont (FILMTEC)

  • LG Chem Ltd. (LG SWRO Membranes)

  • Pentair (X-Flow)

  • Suez Water Technologies & Solutions (ZeeWeed)

  • GEA Group (GEA Filtration Membranes)

  • Merck Millipore (Durapore Membrane Filters)

  • Parker Hannifin Corporation (Domnick Hunter Membranes)

  • Veolia Water Technologies (UFlo)

  • Synder Filtration (NFX Membrane)

  • SPX Flow (Celeros FT Series)

  • Membranium (RM Nanotech) (NanoFilt)

  • Aquaporin A/S (Aquaporin Inside)

  • Pentair X-Flow (Helix Flux Membranes)

Membranes Market Report Scope:

Report Attributes Details
Market Size in 2024 US$ 7.86 Billion
Market Size by 2032 US$ 14.20 Billion
CAGR CAGR of 7.67% From 2025 to 2032
Base Year 2024
Forecast Period 2025-2032
Historical Data 2021-2023
Report Scope & Coverage Market Size, Segments Analysis, Competitive  Landscape, Regional Analysis, DROC & SWOT Analysis, Forecast Outlook
Key Segments • By Material (Polymeric, Ceramic, Others (Zeolite, Metal, and hybrid))
• By Technology (RO, UF, MF, NF, Others )
• By Application (Water & wastewater treatment, Industrial Processing)
Regional Analysis/Coverage North America (US, Canada), Europe (Germany, France, UK, Italy, Spain, Poland, Russsia, Rest of Europe), Asia Pacific (China, India, Japan, South Korea, Australia,ASEAN Countries, Rest of Asia Pacific), Middle East & Africa (UAE, Saudi Arabia, Qatar, Egypt, South Africa, Rest of Middle East & Africa), Latin America (Brazil, Argentina,    Mexico,     Colombia Rest of Latin America)
Company Profiles

Toray Industries Inc. (Japan), Koch Separation Solutions (US), Pall Corporation (US), Asahi Kasei Corporation (Japan), 3M (US), Hydranautics (US), Mann+Hummel (Germany), DuPont (US)and LG Chem Ltd. (South Korea), Pentair (UK), Suez Water Technologies & Solutions (France)

Table Of Contents

1. Introduction

1.1 Market Definition & Scope

 1.2 Research Assumptions & Abbreviations

 1.3 Research Methodology

2. Executive Summary

2.1 Market Snapshot

 2.2 Market Absolute $ Opportunity Assessment & Y-o-Y Analysis, 2021–2032

 2.3 Market Size & Forecast, By Segmentation, 2021–2032

  2.3.1 Market Size By Material

  2.3.2 Market Size By Technology

  2.3.3 Market Size By Application

 2.4 Market Share & Bps Analysis By Region, 2024

 2.5 Industry Growth Scenarios – Conservative, Likely & Optimistic

 2.6 Industry CxO’s Perspective

3. Market Overview

3.1 Market Dynamics

  3.1.1 Drivers

  3.1.2 Restraints

  3.1.3 Opportunities

  3.1.4 Key Market Trends

 3.2 Industry PESTLE Analysis

 3.3 Key Industry Forces (Porter’s) Impacting Market Growth

 3.4 Industry Supply Chain Analysis

  3.4.1 Raw Material Suppliers

  3.4.2 Manufacturers

  3.4.3 Distributors/Suppliers

  3.4.4 Customers/End-Users

 3.5 Industry Life Cycle Assessment

 3.6 Parent Market Overview

 3.7 Market Risk Assessment

4. Statistical Insights & Trends Reporting

4.1 Technology Roadmap & Innovation Pipeline

  4.1.1 Overview

  4.1.2 Mapping of emerging technologies

  4.1.3 Assessment of disruptive innovations and their impact on traditional polymeric membranes.

 4.2 End-Use Industry Adoption Maturity Curve

  4.2.1 Overview

  4.2.2 Positioning of key end-user sectors

  4.2.3 Helps the client identify sectors ripe for scaling and sectors where penetration is still low.

 4.3 Regulatory & Policy Impact Analysis

  4.3.1 Overview

  4.3.2 Deep dive into global and regional regulatory standards

  4.3.3 How stricter water reuse mandates, PFAS removal regulations

4.4 Cost Structure & Unit Economics Benchmarking

5. Aromatic Solvents Market Segmental Analysis & Forecast, By Material, 2021 – 2032, Value (USD Trillion)

5.1 Introduction

 5.2 Polymeric

  5.2.1 Key Trends

  5.2.2 Market Size & Forecast, 2021 – 2032

 5.3 Ceramic

  5.3.1 Key Trends

  5.3.2 Market Size & Forecast, 2021 – 2032

 5.4 Metal

  5.4.1 Key Trends

  5.4.2 Market Size & Forecast, 2021 – 2032

 5.5 Others (Glass, Composite Materials)

  5.5.1 Key Trends

  5.5.2 Market Size & Forecast, 2021 – 2032

6. Aromatic Solvents Market Segmental Analysis & Forecast, By Technology, 2021 – 2032, Value (USD Trillion)

    6.1 Introduction

 6.2 Reverse Osmosis (RO)

  6.2.1 Key Trends

  6.2.2 Market Size & Forecast, 2021 – 2032

 6.3 Ultrafiltration (UF)

  6.3.1 Key Trends

  6.3.2 Market Size & Forecast, 2021 – 2032

 6.4 Microfiltration (MF)

  6.4.1 Key Trends

  6.4.2 Market Size & Forecast, 2021 – 2032

 6.5 Nanofiltration (NF)

  6.5.1 Key Trends

  6.5.2 Market Size & Forecast, 2021 – 2032

 6.6 Others (Electrodialysis, Forward Osmosis)

  6.6.1 Key Trends

  6.6.2 Market Size & Forecast, 2021 – 2032

7. Aromatic Solvents Market Segmental Analysis & Forecast, By Application, 2021 – 2032, Value (USD Trillion)

    7.1 Introduction

 7.2 Water & Wastewater Treatment

  7.2.1 Key Trends

  7.2.2 Market Size & Forecast, 2021 – 2032

 7.3 Food & Beverage

  7.3.1 Key Trends

  7.3.2 Market Size & Forecast, 2021 – 2032

 7.4 Healthcare & Pharmaceuticals

  7.4.1 Key Trends

  7.4.2 Market Size & Forecast, 2021 – 2032

 7.5 Industrial Processing

  7.5.1 Key Trends

  7.5.2 Market Size & Forecast, 2021 – 2032

 7.6 Others (Desalination, Chemical Processing, Power Generation)

  7.6.1 Key Trends

  7.6.2 Market Size & Forecast, 2021 – 2032

8. Aromatic Solvents Market Segmental Analysis & Forecast By Region, 2021 – 2025, Value (USD Trillion)

8.1 Introduction

8.2 North America

 8.2.1 Key Trends

 8.2.2 Aromatic Solvents Market Size & Forecast, By Material, 2021 – 2032

 8.2.3 Aromatic Solvents Market Size & Forecast, By Technology, 2021 – 2032

 8.2.4 Aromatic Solvents Market Size & Forecast, By Application, 2021 – 2032

 8.2.5 Aromatic Solvents Market Size & Forecast, By Country, 2021 – 2032

  8.2.5.1 USA

   8.2.5.1.1 Aromatic Solvents Market Size & Forecast, By Material, 2021 – 2032

   8.2.5.1.2 Aromatic Solvents Market Size & Forecast, By Technology, 2021 – 2032

   8.2.5.1.3 Aromatic Solvents Market Size & Forecast, By Application, 2021 – 2032

  8.2.5.2 Canada

   8.2.5.2.1 Aromatic Solvents Market Size & Forecast, By Material, 2021 – 2032

   8.2.5.2.2 Aromatic Solvents Market Size & Forecast, By Technology, 2021 – 2032

   8.2.5.2.3 Aromatic Solvents Market Size & Forecast, By Application, 2021 – 2032

8.3 Europe

 8.3.1 Key Trends

 8.3.2 Aromatic Solvents Market Size & Forecast, By Material, 2021 – 2032

 8.3.3 Aromatic Solvents Market Size & Forecast, By Technology, 2021 – 2032

 8.3.4 Aromatic Solvents Market Size & Forecast, By Application, 2021 – 2032

 8.3.5 Aromatic Solvents Market Size & Forecast, By Country, 2021 – 2032

  8.3.5.1 Germany

   8.3.5.1.1 Aromatic Solvents Market Size & Forecast, By Material, 2021 – 2032

   8.3.5.1.2 Aromatic Solvents Market Size & Forecast, By Technology, 2021 – 2032

   8.3.5.1.3 Aromatic Solvents Market Size & Forecast, By Application, 2021 – 2032

  8.3.5.2 UK

   8.3.5.2.1 Aromatic Solvents Market Size & Forecast, By Material, 2021 – 2032

   8.3.5.2.2 Aromatic Solvents Market Size & Forecast, By Technology, 2021 – 2032

   8.3.5.2.3 Aromatic Solvents Market Size & Forecast, By Application, 2021 – 2032

  8.3.5.3 France

   8.3.5.3.1 Aromatic Solvents Market Size & Forecast, By Material, 2021 – 2032

   8.3.5.3.2 Aromatic Solvents Market Size & Forecast, By Technology, 2021 – 2032

   8.3.5.3.3 Aromatic Solvents Market Size & Forecast, By Application, 2021 – 2032

  8.3.5.4 Italy

   8.3.5.4.1 Aromatic Solvents Market Size & Forecast, By Material, 2021 – 2032

   8.3.5.4.2 Aromatic Solvents Market Size & Forecast, By Technology, 2021 – 2032

   8.3.5.4.3 Aromatic Solvents Market Size & Forecast, By Application, 2021 – 2032

  8.3.5.5 Spain

   8.3.5.5.1 Aromatic Solvents Market Size & Forecast, By Material, 2021 – 2032

   8.3.5.5.2 Aromatic Solvents Market Size & Forecast, By Technology, 2021 – 2032

   8.3.5.5.3 Aromatic Solvents Market Size & Forecast, By Application, 2021 – 2032

  8.3.5.6 Russia

   8.3.5.6.1 Aromatic Solvents Market Size & Forecast, By Material, 2021 – 2032

   8.3.5.6.2 Aromatic Solvents Market Size & Forecast, By Technology, 2021 – 2032

   8.3.5.6.3 Aromatic Solvents Market Size & Forecast, By Application, 2021 – 2032

  8.3.5.7 Poland

   8.3.5.7.1 Aromatic Solvents Market Size & Forecast, By Material, 2021 – 2032

   8.3.5.7.2 Aromatic Solvents Market Size & Forecast, By Technology, 2021 – 2032

   8.3.5.7.3 Aromatic Solvents Market Size & Forecast, By Application, 2021 – 2032

  8.3.5.8 Rest of Europe

   8.3.5.8.1 Aromatic Solvents Market Size & Forecast, By Material, 2021 – 2032

   8.3.5.8.2 Aromatic Solvents Market Size & Forecast, By Technology, 2021 – 2032

   8.3.5.8.3 Aromatic Solvents Market Size & Forecast, By Application, 2021 – 2032

8.4 Asia-Pacific

 8.4.1 Key Trends

 8.4.2 Aromatic Solvents Market Size & Forecast, By Material, 2021 – 2032

 8.4.3 Aromatic Solvents Market Size & Forecast, By Technology, 2021 – 2032

 8.4.4 Aromatic Solvents Market Size & Forecast, By Application, 2021 – 2032

 8.4.5 Aromatic Solvents Market Size & Forecast, By Country, 2021 – 2032

  8.4.5.1 China

   8.4.5.1.1 Aromatic Solvents Market Size & Forecast, By Material, 2021 – 2032

   8.4.5.1.2 Aromatic Solvents Market Size & Forecast, By Technology, 2021 – 2032

   8.4.5.1.3 Aromatic Solvents Market Size & Forecast, By Application, 2021 – 2032

  8.4.5.2 India

   8.4.5.2.1 Aromatic Solvents Market Size & Forecast, By Material, 2021 – 2032

   8.4.5.2.2 Aromatic Solvents Market Size & Forecast, By Technology, 2021 – 2032

   8.4.5.2.3 Aromatic Solvents Market Size & Forecast, By Application, 2021 – 2032

  8.4.5.3 Japan

   8.4.5.3.1 Aromatic Solvents Market Size & Forecast, By Material, 2021 – 2032

   8.4.5.3.2 Aromatic Solvents Market Size & Forecast, By Technology, 2021 – 2032

   8.4.5.3.3 Aromatic Solvents Market Size & Forecast, By Application, 2021 – 2032

  8.4.5.4 South Korea

   8.4.5.4.1 Aromatic Solvents Market Size & Forecast, By Material, 2021 – 2032

   8.4.5.4.2 Aromatic Solvents Market Size & Forecast, By Technology, 2021 – 2032

   8.4.5.4.3 Aromatic Solvents Market Size & Forecast, By Application, 2021 – 2032

  8.4.5.5 Australia

   8.4.5.5.1 Aromatic Solvents Market Size & Forecast, By Material, 2021 – 2032

   8.4.5.5.2 Aromatic Solvents Market Size & Forecast, By Technology, 2021 – 2032

   8.4.5.5.3 Aromatic Solvents Market Size & Forecast, By Application, 2021 – 2032

  8.4.5.6 ASEAN Countries

   8.4.5.6.1 Aromatic Solvents Market Size & Forecast, By Material, 2021 – 2032

   8.4.5.6.2 Aromatic Solvents Market Size & Forecast, By Technology, 2021 – 2032

   8.4.5.6.3 Aromatic Solvents Market Size & Forecast, By Application, 2021 – 2032

  8.4.5.7 Rest of Asia-Pacific

   8.4.5.7.1 Aromatic Solvents Market Size & Forecast, By Material, 2021 – 2032

   8.4.5.7.2 Aromatic Solvents Market Size & Forecast, By Technology, 2021 – 2032

   8.4.5.7.3 Aromatic Solvents Market Size & Forecast, By Application, 2021 – 2032

8.5 Latin America

 8.5.1 Key Trends

 8.5.2 Aromatic Solvents Market Size & Forecast, By Material, 2021 – 2032

 8.5.3 Aromatic Solvents Market Size & Forecast, By Technology, 2021 – 2032

 8.5.4 Aromatic Solvents Market Size & Forecast, By Application, 2021 – 2032

 8.5.5 Aromatic Solvents Market Size & Forecast, By Country, 2021 – 2032

  8.5.5.1 Brazil

   8.5.5.1.1 Aromatic Solvents Market Size & Forecast, By Material, 2021 – 2032

   8.5.5.1.2 Aromatic Solvents Market Size & Forecast, By Technology, 2021 – 2032

   8.5.5.1.3 Aromatic Solvents Market Size & Forecast, By Application, 2021 – 2032

  8.5.5.2 Argentina

   8.5.5.2.1 Aromatic Solvents Market Size & Forecast, By Material, 2021 – 2032

   8.5.5.2.2 Aromatic Solvents Market Size & Forecast, By Technology, 2021 – 2032

   8.5.5.2.3 Aromatic Solvents Market Size & Forecast, By Application, 2021 – 2032

  8.5.5.3 Mexico

   8.5.5.3.1 Aromatic Solvents Market Size & Forecast, By Material, 2021 – 2032

   8.5.5.3.2 Aromatic Solvents Market Size & Forecast, By Technology, 2021 – 2032

   8.5.5.3.3 Aromatic Solvents Market Size & Forecast, By Application, 2021 – 2032

  8.5.5.4 Colombia

   8.5.5.4.1 Aromatic Solvents Market Size & Forecast, By Material, 2021 – 2032

   8.5.5.4.2 Aromatic Solvents Market Size & Forecast, By Technology, 2021 – 2032

   8.5.5.4.3 Aromatic Solvents Market Size & Forecast, By Application, 2021 – 2032

  8.5.5.5 Rest of Latin America

   8.5.5.5.1 Aromatic Solvents Market Size & Forecast, By Material, 2021 – 2032

   8.5.5.5.2 Aromatic Solvents Market Size & Forecast, By Technology, 2021 – 2032

   8.5.5.5.3 Aromatic Solvents Market Size & Forecast, By Application, 2021 – 2032

8.6 Middle East & Africa

 8.6.1 Key Trends

 8.6.2 Aromatic Solvents Market Size & Forecast, By Material, 2021 – 2032

 8.6.3 Aromatic Solvents Market Size & Forecast, By Technology, 2021 – 2032

 8.6.4 Aromatic Solvents Market Size & Forecast, By Application, 2021 – 2032

 8.6.5 Aromatic Solvents Market Size & Forecast, By Country, 2021 – 2032

  8.6.5.1 UAE

   8.6.5.1.1 Aromatic Solvents Market Size & Forecast, By Material, 2021 – 2032

   8.6.5.1.2 Aromatic Solvents Market Size & Forecast, By Technology, 2021 – 2032

   8.6.5.1.3 Aromatic Solvents Market Size & Forecast, By Application, 2021 – 2032

  8.6.5.2 Saudi Arabia

   8.6.5.2.1 Aromatic Solvents Market Size & Forecast, By Material, 2021 – 2032

   8.6.5.2.2 Aromatic Solvents Market Size & Forecast, By Technology, 2021 – 2032

   8.6.5.2.3 Aromatic Solvents Market Size & Forecast, By Application, 2021 – 2032

  8.6.5.3 Qatar

   8.6.5.3.1 Aromatic Solvents Market Size & Forecast, By Material, 2021 – 2032

   8.6.5.3.2 Aromatic Solvents Market Size & Forecast, By Technology, 2021 – 2032

   8.6.5.3.3 Aromatic Solvents Market Size & Forecast, By Application, 2021 – 2032

  8.6.5.4 Egypt

   8.6.5.4.1 Aromatic Solvents Market Size & Forecast, By Material, 2021 – 2032

   8.6.5.4.2 Aromatic Solvents Market Size & Forecast, By Technology, 2021 – 2032

   8.6.5.4.3 Aromatic Solvents Market Size & Forecast, By Application, 2021 – 2032

  8.6.5.5 South Africa

   8.6.5.5.1 Aromatic Solvents Market Size & Forecast, By Material, 2021 – 2032

   8.6.5.5.2 Aromatic Solvents Market Size & Forecast, By Technology, 2021 – 2032

   8.6.5.5.3 Aromatic Solvents Market Size & Forecast, By Application, 2021 – 2032

  8.6.5.6 Rest of Middle East & Africa

   8.6.5.6.1 Aromatic Solvents Market Size & Forecast, By Material, 2021 – 2032

   8.6.5.6.2 Aromatic Solvents Market Size & Forecast, By Technology, 2021 – 2032

   8.6.5.6.3 Aromatic Solvents Market Size & Forecast, By Application, 2021 – 2032

9. Competitive Landscape

 9.1 Key Players' Positioning

 9.2 Competitive Developments

  9.2.1 Key Strategies Adopted (%), By Key Players, 2024

  9.2.2 Year-Wise Strategies & Development, 2021 – 2025

  9.2.3 Number Of Strategies Adopted By Key Players, 2024

 9.3 Market Share Analysis, 2024

 9.4 Product/Service & Application Benchmarking

  9.4.1 Product/Service Specifications & Features By Key Players

  9.4.2 Product/Service Heatmap By Key Players

  9.4.3 Application Heatmap By Key Players

 9.5 Industry Start-Up & Innovation Landscape

9.6 Key Company Profiles

 9.6.1 Toray Industries Inc.

  9.6.1.1 Company Overview & Snapshot

  9.6.1.2 Product/Service Portfolio

  9.6.1.3 Key Company Financials

  9.6.1.4 SWOT Analysis

 9.6.2 Koch Separation Solutions

  9.6.2.1 Company Overview & Snapshot

  9.6.2.2 Product/Service Portfolio

  9.6.2.3 Key Company Financials

  9.6.2.4 SWOT Analysis

 9.6.3 Pall Corporation

  9.6.3.1 Company Overview & Snapshot

  9.6.3.2 Product/Service Portfolio

  9.6.3.3 Key Company Financials

  9.6.3.4 SWOT Analysis

 9.6.4 Asahi Kasei Corporation

  9.6.4.1 Company Overview & Snapshot

  9.6.4.2 Product/Service Portfolio

  9.6.4.3 Key Company Financials

  9.6.4.4 SWOT Analysis

 9.6.5 3M

  9.6.5.1 Company Overview & Snapshot

  9.6.5.2 Product/Service Portfolio

  9.6.5.3 Key Company Financials

  9.6.5.4 SWOT Analysis

 9.6.6 Hydranautics

  9.6.6.1 Company Overview & Snapshot

  9.6.6.2 Product/Service Portfolio

  9.6.6.3 Key Company Financials

  9.6.6.4 SWOT Analysis

 9.6.7 Mann+Hummel

  9.6.7.1 Company Overview & Snapshot

  9.6.7.2 Product/Service Portfolio

  9.6.7.3 Key Company Financials

  9.6.7.4 SWOT Analysis

 9.6.8 DuPont

  9.6.8.1 Company Overview & Snapshot

  9.6.8.2 Product/Service Portfolio

  9.6.8.3 Key Company Financials

  9.6.8.4 SWOT Analysis

 9.6.9 LG Chem Ltd.

  9.6.9.1 Company Overview & Snapshot

  9.6.9.2 Product/Service Portfolio

  9.6.9.3 Key Company Financials

  9.6.9.4 SWOT Analysis

 9.6.10 Pentair

  9.6.10.1 Company Overview & Snapshot

  9.6.10.2 Product/Service Portfolio

  9.6.10.3 Key Company Financials

  9.6.10.4 SWOT Analysis

 9.6.11 Merck KGaA

  9.6.11.1 Company Overview & Snapshot

  9.6.11.2 Product/Service Portfolio

  9.6.11.3 Key Company Financials

  9.6.11.4 SWOT Analysis

 9.6.12 Suez Water Technologies & Solutions

  9.6.12.1 Company Overview & Snapshot

  9.6.12.2 Product/Service Portfolio

  9.6.12.3 Key Company Financials

  9.6.12.4 SWOT Analysis

 9.6.13 Veolia Environnement S.A.

  9.6.13.1 Company Overview & Snapshot

  9.6.13.2 Product/Service Portfolio

  9.6.13.3 Key Company Financials

  9.6.13.4 SWOT Analysis

 9.6.14 Siemens Healthiness AG

  9.6.14.1 Company Overview & Snapshot

  9.6.14.2 Product/Service Portfolio

  9.6.14.3 Key Company Financials

  9.6.14.4 SWOT Analysis

 9.6.15 GE Healthcare Technologies Inc.

  9.6.15.1 Company Overview & Snapshot

  9.6.15.2 Product/Service Portfolio

  9.6.15.3 Key Company Financials

  9.6.15.4 SWOT Analysis

 9.6.16 Hitachi Chemical Co., Ltd.

  9.6.16.1 Company Overview & Snapshot

  9.6.16.2 Product/Service Portfolio

  9.6.16.3 Key Company Financials

  9.6.16.4 SWOT Analysis

 9.6.17 Ecolab Inc.

  9.6.17.1 Company Overview & Snapshot

  9.6.17.2 Product/Service Portfolio

  9.6.17.3 Key Company Financials

  9.6.17.4 SWOT Analysis

 9.6.18 Kuraray Co., Ltd.

  9.6.18.1 Company Overview & Snapshot

  9.6.18.2 Product/Service Portfolio

  9.6.18.3 Key Company Financials

  9.6.18.4 SWOT Analysis

 9.6.19 Toray Membrane USA, Inc.

  9.6.19.1 Company Overview & Snapshot

  9.6.19.2 Product/Service Portfolio

  9.6.19.3 Key Company Financials

  9.6.19.4 SWOT Analysis

 9.6.20 Lanxess AG

  9.6.20.1 Company Overview & Snapshot

  9.6.20.2 Product/Service Portfolio

  9.6.20.3 Key Company Financials

  9.6.20.4 SWOT Analysis

10. Analyst Recommendations

 10.1 SNS Insider Opportunity Map

 10.2 Industry Low-Hanging Fruit Assessment

 10.3 Market Entry & Growth Strategy

 10.4 Analyst Viewpoint & Suggestions On Market Growth

11. Assumptions

12. Disclaimer

13. Appendix

 13.1 List Of Tables

 13.2 List Of Figures

Key Segments:

By Material

  • Ceramic

  • Polymeric

  • Others

By Technology

  • UF

  • RO

  • NF

  • MF

  • Others

By Application

  • Water & Wastewater Treatment

  • Food & Beverage

  • Gas Separation

  • Others

Request for Segment Customization as per your Business Requirement: Segment Customization Request

Regional Coverage: 

North America

  • US

  • Canada

Europe

  • Germany

  • UK

  • France

  • Italy

  • Spain

  • Russia

  • Poland

  • Rest of Europe

Asia Pacific

  • China

  • India

  • Japan

  • South Korea

  • ASEAN Countries

  • Australia

  • Rest of Asia Pacific

Latin America

  • Brazil

  • Argentina

  • Mexico

  • Colombia

  • Rest of Latin America

Middle East & Africa

  • UAE

  • Saudi Arabia

  • Qatar

  • Egypt

  • South Africa

  • Rest of Middle East & Africa

Request for Country Level Research Report: Country Level Customization Request

Available Customization 

With the given market data, SNS Insider offers customization as per the company’s specific needs. The following customization options are available for the report: 

  • Detailed Volume Analysis 

  • Criss-Cross segment analysis (e.g. Product X Application) 

  • Competitive Product Benchmarking 

  • Geographic Analysis 

  • Additional countries in any of the regions 

  • Customized Data Representation 

An accurate research report requires proper strategizing as well as implementation. There are multiple factors involved in the completion of good and accurate research report and selecting the best methodology to compete the research is the toughest part. Since the research reports we provide play a crucial role in any company’s decision-making process, therefore we at SNS Insider always believe that we should choose the best method which gives us results closer to reality. This allows us to reach at a stage wherein we can provide our clients best and accurate investment to output ratio.

Each report that we prepare takes a timeframe of 350-400 business hours for production. Starting from the selection of titles through a couple of in-depth brain storming session to the final QC process before uploading our titles on our website we dedicate around 350 working hours. The titles are selected based on their current market cap and the foreseen CAGR and growth.


The 5 steps process:

Step 1: Secondary Research:

Secondary Research or Desk Research is as the name suggests is a research process wherein, we collect data through the readily available information. In this process we use various paid and unpaid databases which our team has access to and gather data through the same. This includes examining of listed companies’ annual reports, Journals, SEC filling etc. Apart from this our team has access to various associations across the globe across different industries. Lastly, we have exchange relationships with various university as well as individual libraries.

Secondary Research

Step 2: Primary Research

When we talk about primary research, it is a type of study in which the researchers collect relevant data samples directly, rather than relying on previously collected data.  This type of research is focused on gaining content specific facts that can be sued to solve specific problems. Since the collected data is fresh and first hand therefore it makes the study more accurate and genuine.

We at SNS Insider have divided Primary Research into 2 parts.

Part 1 wherein we interview the KOLs of major players as well as the upcoming ones across various geographic regions. This allows us to have their view over the market scenario and acts as an important tool to come closer to the accurate market numbers. As many as 45 paid and unpaid primary interviews are taken from both the demand and supply side of the industry to make sure we land at an accurate judgement and analysis of the market.

This step involves the triangulation of data wherein our team analyses the interview transcripts, online survey responses and observation of on filed participants. The below mentioned chart should give a better understanding of the part 1 of the primary interview.

Primary Research

Part 2: In this part of primary research the data collected via secondary research and the part 1 of the primary research is validated with the interviews from individual consultants and subject matter experts.

Consultants are those set of people who have at least 12 years of experience and expertise within the industry whereas Subject Matter Experts are those with at least 15 years of experience behind their back within the same space. The data with the help of two main processes i.e., FGDs (Focused Group Discussions) and IDs (Individual Discussions). This gives us a 3rd party nonbiased primary view of the market scenario making it a more dependable one while collation of the data pointers.

Step 3: Data Bank Validation

Once all the information is collected via primary and secondary sources, we run that information for data validation. At our intelligence centre our research heads track a lot of information related to the market which includes the quarterly reports, the daily stock prices, and other relevant information. Our data bank server gets updated every fortnight and that is how the information which we collected using our primary and secondary information is revalidated in real time.

Data Bank Validation

Step 4: QA/QC Process

After all the data collection and validation our team does a final level of quality check and quality assurance to get rid of any unwanted or undesired mistakes. This might include but not limited to getting rid of the any typos, duplication of numbers or missing of any important information. The people involved in this process include technical content writers, research heads and graphics people. Once this process is completed the title gets uploader on our platform for our clients to read it.

Step 5: Final QC/QA Process:

This is the last process and comes when the client has ordered the study. In this process a final QA/QC is done before the study is emailed to the client. Since we believe in giving our clients a good experience of our research studies, therefore, to make sure that we do not lack at our end in any way humanly possible we do a final round of quality check and then dispatch the study to the client.