Military Laser Systems Market Report Scope & Overview:
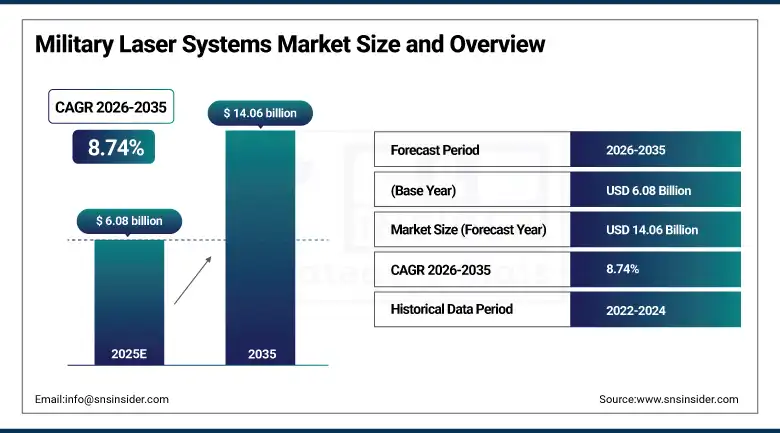
Military Laser Systems Market was valued at USD 6.08 billion in 2025 and is expected to reach USD 14.06 billion by 2035, growing at a CAGR of 8.74% from 2026 to 2035.
The nature of warfare has changed dramatically in an irreparable manner, and one of the most evident signs of such a change can be seen in the rapid adoption of military laser systems by all branches of the armed forces around the world. While conventional ammunition is always limited in its supply and each shot comes with thousands of dollars of costs, lasers work on electrical power, providing the military with practically unlimited ammunition for significantly less money than before. It is this basic economic principle that has brought about the increasing relevance of directed energy technology within defense procurement discussions taking place in Washington, Beijing, London, and New Delhi alike. The combination of global geopolitical tensions, increased use of drones, the development of hypersonic missiles, and the availability of cheap UAVs has resulted in an atmosphere in which conventional missile defense systems are simply unable to keep up.
The compounding effect of rising global defense budgets, demonstrated battlefield effectiveness of directed energy prototypes, and the rapidly declining cost of high-power laser components is creating a structural demand environment where military laser systems are transitioning from experimental programs to standard equipment across multiple platform categories. Nations that establish early production and integration expertise in this technology will hold lasting asymmetric advantages in future high-intensity conflict scenarios, and this recognition is driving procurement decisions with urgency not seen in conventional weapons categories in decades.
Military Laser Systems Market Size and Forecast
-
Market Size in 2025: USD 6.08 Billion
-
Market Size by 2035: USD 14.06 Billion
-
CAGR: 8.74% from 2026 to 2035
-
Base Year: 2025
-
Forecast Period: 2026 to 2035
-
Historical Data: 2022 to 2024
To Get more information On Military Laser Systems Market - Request Free Sample Report
Military Laser Systems Market Trends
-
The fast deployment of counter-unmanned aerial system laser platforms into land, naval, and air defense systems, due to the battle field realization of drone swarm technologies as low-cost high impact weapons which cannot be countered effectively with traditional interceptor systems.
-
The growing commitment to developing high energy fiber lasers, which have superior beam qualities, scalability in terms of power delivery, and better thermal management compared to traditional chemical and gas lasers, making it possible to develop multi-hundred-kilowatt laser weapon systems.
-
The increasing emphasis on the integration of laser weapons within multi-domain combat systems, in which laser weapons must operate in conjunction with traditional radar, missile, and cyber systems in a unified command and control framework.
-
The rising interest from defense ministries in applying laser weapons in space to protect satellites, provide orbit surveillance, and perform long range precision engagements, with increasing threats to satellites from near peer adversaries.
-
The increasing use of portable containerized laser weapons systems that can be easily moved around without requiring fixed platform integration.
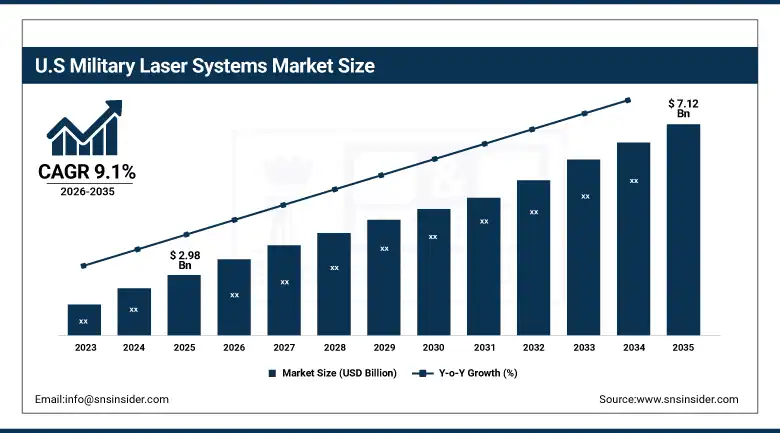
U.S. Military Laser Systems Market was valued at USD 2.98 billion in 2025 and is expected to reach USD 7.12 billion by 2035, registering a CAGR of 9.1% during 2026 to 2035.
The United States possesses the world's most mature and well-funded military laser development ecosystem, combining the largest national defense budget globally with decades of sustained directed energy research investment through programs at the Army, Navy, Air Force, and Marine Corps simultaneously. Programs such as HELIOS aboard Navy destroyers, the Army DE-MSHORAD short-range air defense system, and the Air Force Airborne High Energy Laser initiative represent the visible operational frontier of a much broader technology pipeline that includes classified programs, university research partnerships, and commercial defense contractor development across dozens of facilities nationwide. The competitive landscape between Raytheon Technologies, Lockheed Martin, Northrop Grumman, and Boeing in laser system contracts has driven innovation cycles faster than any single government program office could achieve independently, creating a self-reinforcing acceleration of capability development.
The National Defense Authorization Act allocations for directed energy programs have grown consistently over the past several budget cycles, reflecting bipartisan congressional recognition that the window for establishing laser weapons superiority before near-peer adversaries achieve comparable capability is narrowing. Defense Department modeling suggesting that high-energy lasers could reduce per-engagement costs by more than 99 percent compared to missile interceptors in C-UAS scenarios has made the economic case for accelerated investment compelling at the highest levels of defense planning.
Military Laser Systems Market Segment Insights
-
Based on Type, Laser Weapons accounted for the largest market share of 44% in 2025; LIDAR is expected to be the fastest growing type segment during the forecast period.
-
Based on Technology, Solid-State Laser accounted for the largest market share of 42% in 2025; Fiber Laser is expected to record the fastest growth through the forecast period.
-
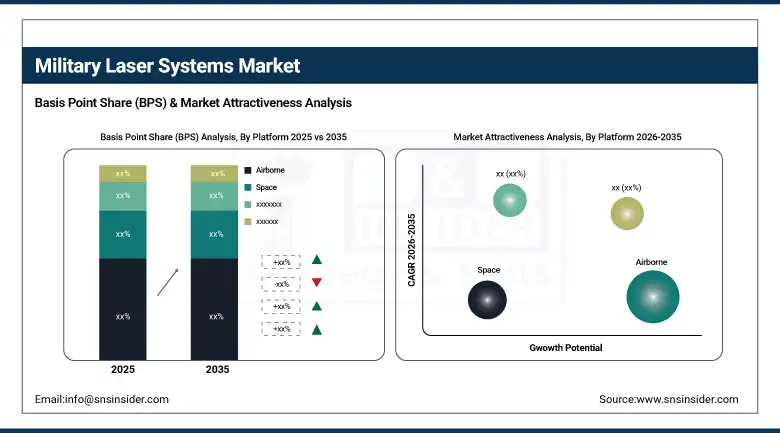
Based on Platform, Airborne platforms accounted for the largest market share of 38% in 2025; Naval platforms are expected to be the fastest growing segment through 2035.
Military Laser Systems Market Segment Analysis
By Type, Laser Weapons dominate, LIDAR expected to grow fastest
Laser weapons held the commanding position in the military laser systems market in 2025, accounting for 44% of total type revenue. The segment's dominance reflects the accelerating deployment of directed energy weapons across the world's major military powers, driven by the compelling combination of unlimited magazine depth, near-zero per-shot cost, and physics-of-light speed engagement timelines that no conventional kinetic interceptor can match. High-energy laser weapons are now operational or in advanced field testing aboard U.S. Navy destroyers, Army combat vehicles, and in developmental airborne platforms, while allied nations from the United Kingdom to Israel and South Korea have active fielding programs at various stages of maturity. The growing sophistication of the counter-drone mission set has proven particularly validating for laser weapon deployment, with systems achieving engagement success rates above 95% against small and medium class unmanned aerial vehicles in controlled and operational settings.
The LIDAR segment is projected to record the highest CAGR through 2035, driven by its expanding role across battlefield mapping, target detection, autonomous vehicle guidance, and precision fire control applications that demand centimeter-level spatial accuracy in complex operational environments. Military LIDAR is increasingly integral to unmanned ground vehicle navigation, rotary and fixed wing aircraft terrain avoidance, and the next generation of precision-guided munition targeting systems that require real-time three-dimensional environmental modeling rather than traditional two-dimensional radar imaging.
By Technology, Solid-State Laser dominates, Fiber Laser expected to grow fastest
Solid-state lasers commanded 42% of the technology segment in 2025, reflecting their long operational heritage, established supply chains, and proven performance across laser designator, range finder, and early generation directed energy weapon applications within military inventories worldwide. The combination of high peak power output, established ruggedization techniques for airborne and vehicle-mounted applications, and a mature industrial base for key components such as neodymium-doped gain media and diode pump arrays has kept solid-state technology as the default choice for programs prioritizing reliability and integration into proven weapon system architectures.
Fiber laser systems are projected to have the highest compound annual growth rate through 2035 due to their ability to provide high-quality beams even at high power levels, small and lightweight design, lower thermal management needs than solid-state lasers, and excellent scalability up to hundreds of kilowatts necessary for the engagement of bigger threats such as cruise missiles, mortars, and hardened drones. Lockheed Martin’s demonstration of combining spectral beams from fiber lasers to create 300 kW level output power systems has confirmed the viability of this technology for hard kill applications in vehicles-mounted directed energy weapon systems.
By Platform, Airborne dominates, Naval expected to grow fastest
Airborne platforms held 38% of the platform segment in 2025, driven by the legacy of precision laser designator and range finder technology built into fighter aircraft, attack helicopters, and surveillance platforms over decades of integration. Modern tactical aircraft universally employ laser targeting pods and range finding systems as standard equipment, and the development of high-energy airborne laser weapon systems for both self-defense and offensive applications represents the next evolutionary step for this platform category.
Naval platforms are projected to experience the highest CAGR between 2026 and 2035, as the unique operational advantages of shipboard laser systems align exceptionally well with the threat environments that surface combatants now face. Naval vessels provide virtually unlimited electrical power generation to sustain high-energy laser operation without the battery or generator constraints that limit land vehicle deployments. Shipboard laser systems like the U.S. Navy HELIOS program have demonstrated operationally relevant capability against UAVs and fast attack craft, while next-generation programs targeting engagement of anti-ship cruise missiles and beyond-horizon drone threats are advancing through development pipelines in the United States, United Kingdom, France, and Australia simultaneously.
Military Laser Systems Market Regional Analysis
|
Region |
Major Country |
Share within Region (%) |
|---|---|---|
|
North America |
United States |
52% |
|
Europe |
United Kingdom |
28% |
|
Asia Pacific |
China |
34% |
|
Middle East & Africa |
Israel |
31% |
|
Latin America |
Brazil |
38% |
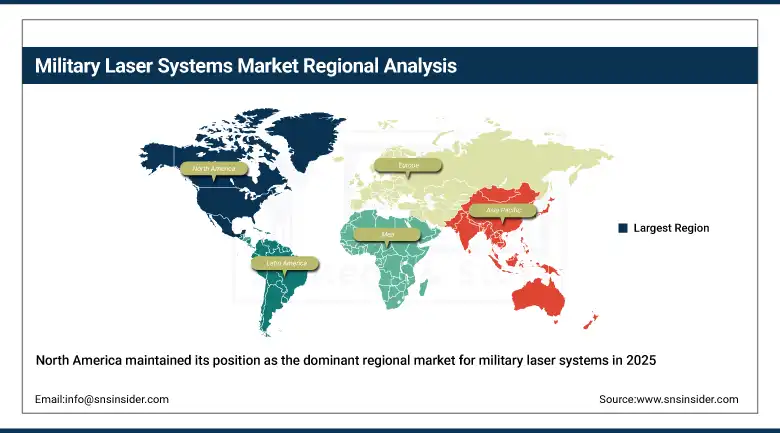
North America Military Laser Systems Market Insights
North America maintained its position as the dominant regional market for military laser systems in 2025, contributing approximately 52% of global revenue, with the United States accounting for the overwhelming majority of both procurement spending and technology development activity. The scale of the U.S. directed energy investment is unlike any other nation, combining military program office budgets, DARPA research funding, service branch laboratory programs, and commercial defense contractor development into a technology pipeline of unparalleled breadth and depth. Canada contributes through participation in joint NATO directed energy programs and domestic procurement of laser target designator systems for ground and airborne platforms. The U.S. market was valued at USD 2.98 billion in 2025 and is projected to reach USD 7.12 billion by 2035.
Get Customized Report as per Your Business Requirement - Enquiry Now
Asia Pacific Military Laser Systems Market Insights
The Asia Pacific region is the fastest growing regional market for military laser systems during the forecast period, driven by accelerating defense modernization programs across China, India, South Korea, Japan, and Australia responding to an increasingly contested regional security environment. China has made military laser technology a national strategic priority, investing substantially in high-energy directed energy research and conducting public demonstrations of laser weapon capabilities that have heightened the pace of technology competition across the region. India's Defense Research and Development Organisation has active directed energy weapon programs targeting both vehicle-mounted and naval laser weapons, while South Korea has fielded operational laser-based anti-drone systems.
Europe Military Laser Systems Market Insights
Europe continued to have a considerable market presence within the global military laser systems industry in 2025, with the United Kingdom, France, Germany, and Israel dominating the investments made and equipment purchases in the region. The UK's DragonFire program has produced pioneering tests at sea, which proved the viability of using high-energy lasers on warships, thereby making the United Kingdom a leader in directed energy weapons among European nations. France currently has several programs underway under Thales and MBDA, whereas Germany is scaling up its investments in laser air defense systems.
Middle East & Africa and Latin America Military Laser Systems Market Insights
Middle East and Africa is a fast developing market for military lasers due to world-leading directed energy industry in Israel and the increased procurement interest shown by countries of Gulf Cooperation Council who wish to have air defenses against drones and missile attacks. Iron Beam is one of the most sophisticated directed energy projects in the world – it is a high-energy laser capable of engaging mortars, rockets and drones and costing much less than conventional interceptor missiles. It demonstrates how Israeli laser technology can be exported to friendly countries in the region. Latin America still is an emerging market but Brazil has shown the most interest in laser range finder and designator technology.
Military Laser Systems Market Growth Drivers:
-
Rising global defense budgets and accelerating demand for directed energy weapons as cost-effective alternatives to conventional missile-based air defense systems
The economic mathematics of modern air defense are creating an unstoppable structural driver for military laser systems adoption. When a nation can defend against a hundred-dollar drone with a dollar of electricity rather than a fifty-thousand-dollar interceptor missile, the investment case for directed energy becomes self-evident to defense planners operating under fiscal constraints. Global military spending reached record levels in 2024 and 2025, and a growing proportion of that expanded budget is being directed toward directed energy programs as the strategic priority of countering UAV and hypersonic threats without exhausting conventional ammunition stockpiles moves to the top of procurement agendas worldwide.
The convergence of three reinforcing trends, namely escalating drone warfare validating operational laser performance, global defense budget expansion creating procurement capacity, and rapid technology maturation reducing system costs and increasing reliability, is establishing military laser systems as one of the most compelling growth markets in the global defense industry. Nations that delay investment in this capability risk falling into permanent technological disadvantage that will be extremely difficult and expensive to close once the technology gap widens.
Military Laser Systems Market Restraints
-
High power requirements, thermal management complexity, and adverse weather performance limitations constraining operational deployment
Despite their compelling advantages, military laser systems face genuine technical challenges that continue to moderate deployment timelines and operational scope. High-energy lasers require substantial electrical power generation capacity that can tax the power budgets of smaller naval vessels and ground vehicles, while heat dissipation requirements add significant weight and volume to system installations that are already competing for limited platform space. Atmospheric effects including turbulence, aerosols, and precipitation can degrade laser beam quality and effective engagement range, particularly in maritime environments and tropical climates that characterize many of the most strategically important operating areas globally.
Military Laser Systems Market Opportunities
-
Counter-UAS applications, allied nation technology transfer programs, and space-based laser system development
The counter-unmanned aerial system mission has emerged as the single most commercially compelling near-term opportunity in the military laser systems market, as the demonstrated effectiveness and extraordinary cost efficiency of laser engagement of small drones creates an almost universal demand signal from armed forces in every geographic region. Nations that have experienced drone warfare directly, whether in Ukraine, the Middle East, or contested maritime zones, have accelerated procurement timelines from years to months, creating urgent demand that laser system manufacturers and integrators are racing to satisfy. Beyond C-UAS, the long-term structural opportunity in space-based laser applications represents the next major growth frontier as the commercial satellite industry and military space architectures face mounting threats from adversary counter-space capabilities.
Recent Developments:
-
2026: Raytheon Technologies revealed successful testing of their next-generation high energy laser weapon system in land operations, which showed engagement of several drone targets simultaneously at long range with a power output of more than 100 kW, enabling the company to move on to full-rate production contracts in the second half of 2026.
-
2025 (November): Lockheed Martin was awarded a follow-up contract by the U.S. Army to provide further prototypes of 300 kW-class laser weapon systems under the Indirect Fire Protection Capability program, broadening the program scope to include vehicle-mounted laser weapon systems for use in mobile operations.
-
2025 (June): DragonFire, a consortium in the United Kingdom, revealed successful testing of its high-energy laser weapon system on board a Royal Navy vessel, which demonstrated the ability of the system to precisely engage aerial targets at operationally relevant ranges and maintain beam quality in maritime conditions.
-
2024 (December): Elbit Systems completed the integration and qualification of an advanced airborne laser designator system for a NATO ally's next-generation strike fighter aircraft, providing significant improvements in targeting precision that extend the standoff range of the aircraft's precision guided munitions.
-
2024 (August): Northrop Grumman was awarded a significant development contract to advance its solid-state laser weapon program for U.S. Navy shipboard installation, with the program targeting engagement of anti-ship cruise missiles and ballistic projectiles at ranges substantially exceeding current near-field defense capabilities.
Military Laser Systems Market Key Players
-
Lockheed Martin Corporation
-
Raytheon Technologies (RTX Corporation)
-
Northrop Grumman Corporation
-
The Boeing Company
-
BAE Systems plc
-
Thales Group
-
Elbit Systems Ltd.
-
L3Harris Technologies Inc.
-
General Dynamics Corporation
-
Safran Electronics & Defense
-
MBDA Missile Systems
-
Leonardo S.p.A.
-
Rheinmetall AG
-
Israel Aerospace Industries
-
Saab AB
-
Coherent Corp.
-
II-VI Incorporated (Coherent)
-
High Energy Laser Systems (HELS)
-
Directed Energy Solutions United States
-
Aculight Corporation (Lockheed Martin)
Military Laser Systems Market Report Scope:
| Report Attributes | Details |
|---|---|
| Market Size in 2025 | USD 6.08 Billion |
| Market Size by 2035 | USD 14.06 Billion |
| CAGR | CAGR of 8.74% From 2026 to 2035 |
| Base Year | 2025 |
| Forecast Period | 2026-2035 |
| Historical Data | 2022-2024 |
| Report Scope & Coverage | Market Size, Segments Analysis, Competitive Landscape, Regional Analysis, DROC & SWOT Analysis, Forecast Outlook |
| Key Segments | • By Type (Laser Weapons, LIDAR, Laser Range Finders, Laser Designators, Others) • By Technology (Solid-State Laser, Fiber Laser, Semiconductor Laser, Gas Laser, Others) • By Platform (Airborne, Naval, Land, Space) • By Application (Defense, Homeland Security, Others) |
| Regional Analysis/Coverage | North America (US, Canada, Mexico), Europe (Eastern Europe [Poland, Romania, Hungary, Turkey, Rest of Eastern Europe] Western Europe] Germany, France, UK, Italy, Spain, Netherlands, Switzerland, Austria, Rest of Western Europe]), Asia Pacific (China, India, Japan, South Korea, Vietnam, Singapore, Australia, Rest of Asia Pacific), Middle East & Africa (Middle East [UAE, Egypt, Saudi Arabia, Qatar, Rest of Middle East], Africa [Nigeria, South Africa, Rest of Africa], Latin America (Brazil, Argentina, Colombia, Rest of Latin America) |
| Company Profiles | Lockheed Martin Corporation, Raytheon Technologies (RTX Corporation), Northrop Grumman Corporation, The Boeing Company, BAE Systems plc, Thales Group, Elbit Systems Ltd., L3Harris Technologies Inc., General Dynamics Corporation, Safran Electronics & Defense, MBDA Missile Systems, Leonardo S.p.A., Rheinmetall AG, Israel Aerospace Industries, Saab AB, Coherent Corp., II-VI Incorporated (Coherent), High Energy Laser Systems (HELS), Directed Energy Solutions, Aculight Corporation (Lockheed Martin) |
Frequently Asked Questions
North America dominated the Military Laser Systems Market in 2025 with approximately 52% of global revenue, led overwhelmingly by the United States whose multi-program directed energy procurement and research investment is unmatched globally.
The Solid-State Laser segment dominated with approximately 42% of the technology segment revenue in 2025, reflecting its established integration history across military laser designator, range finder, and early-generation directed energy weapon programs globally.
Rising global defense budgets combined with the urgent operational need for cost-effective directed energy solutions against drone swarms, hypersonic threats, and asymmetric warfare challenges is the primary structural driver, reinforced by demonstrated battlefield effectiveness of laser weapons, technology maturation reducing per-system costs, and the economic advantage of near-zero cost-per-engagement compared to conventional missile interceptors.
The Military Laser Systems Market was valued at USD 6.08 billion in 2025.
The Military Laser Systems Market is expected to grow at a CAGR of 8.74% from 2026 to 2035.
Get in Touch
