Multiomics Market Size & Trends:
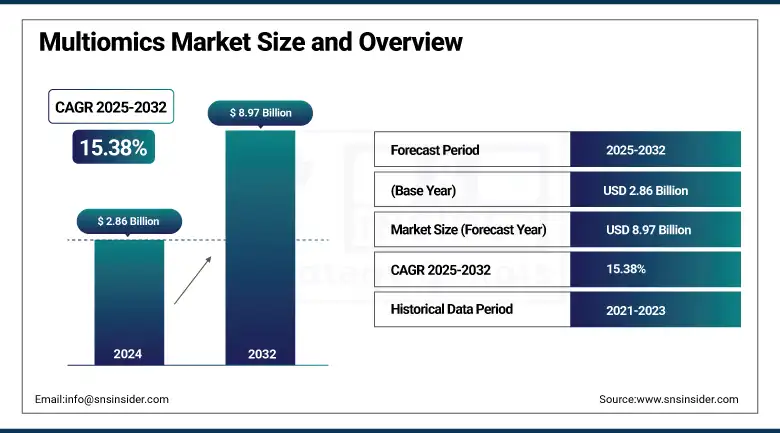
The Multiomics Market size was valued at USD 2.86 billion in 2024 and is expected to reach USD 8.97 billion by 2032, growing at a CAGR of 15.38% over 2025-2032.
The global multiomics market is evolving rapidly with an increase in demand for convergent omics technologies to deliver holistic biological insights in genomics, proteomics, transcriptomics, and metabolomics. Increasing R&D investments by pharmaceutical and biotech companies, coupled with improvements in high-throughput sequencing and bioinformatics, are driving the multiomics market growth. The application of AI and machine learning in data analysis and declining sequencing prices is driving adoption in clinical research, oncology, and precision medicine.
During 2024, more than 5–10 times bigger multiomic data was analyzed compared to 2015, with an immense rise in data demand and usage. The U.S. multiomics market is leading globally owing to the robust funding, strong multiomics companies' base, and innovative regulatory strategies, including the FDA's promotion of biomarker-guided drug development. Apart from that, with more focus on disease detection and concentrated treatments, the global investments in the omics-based diagnostics have reached USD 1.5 billion in 2024.
To Get more information On Multiomics Market - Request Free Sample Report
Standardizing the data and integrating across platforms helps to assist the gains of the multiomics market share by means of cooperative projects, including NIH's All of Us Research Program. Government support in the U.S. multiomics market, as reflected through NIH's USD 200 million yearly investment in multiomics-related initiatives, continues to promote innovation. Further, over 250+ regulatory approvals of omics-based diagnostics over the past three years reflect the growing clinical relevance of this approach.
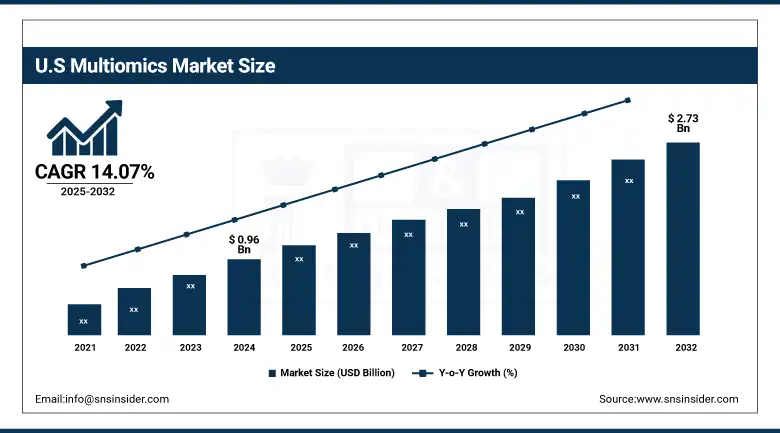
The U.S. multiomics market size was valued at USD 0.96 billion in 2024 and is expected to reach USD 2.73 billion by 2032, growing at a CAGR of 14.07% over 2025-2032. The U.S. leads the region in hosting more than 60% of global clinical trials that involve multiomics data, backed by prestigious funding initiatives, such as NIH's All of Us, which by itself used more than USD 200 million a year for multiomics-based research. Advanced incorporation of genomes, proteomics, and transcriptomics in neurological and oncology research propels the commercial expansion of the market. Canada is also experiencing growth owing to the surging funding for national data incorporation projects, including omics research and Genomics Canada. Mexico is also experiencing slow but steady expansion, particularly for joint academic projects. The confluence of sophisticated healthcare systems and the inclusion of top multiomics firms within the U.S. largely underpins regional leadership.
Multiomics Market Dynamics:
Drivers:
-
Rising Demand for Personalized Medicine, Technological Advancements, and Data Integration Propel the Market Expansion
The growth of the global multiomics market is largely driven by increasing demand for precision medicine and end-to-end disease modeling. Personalized therapies are also gaining traction, with over 70% of 2024 cancer study programs incorporating multiomics-based stratification to identify patient-specific biomarkers. Advances in mass spectrometry, NGS, and single-cell analysis technology have increased data resolution and reduced per-sample costs, bringing multiomics within reach of research centers and clinical laboratories. Agilent Technologies, for instance, launched a new high-throughput proteomics platform in the latter half of 2024 capable of analyzing 500+ samples per day, facilitating faster and large-scale exploration of samples.
Moreover, pharma and biotech R&D spending increased by 8.2% globally in 2024, much of which is invested in omics-driven discovery pipelines. The regulatory environment is also playing a role, as both the FDA and the EMA issued new guidelines to facilitate multiomics data submission for biomarker qualification and companion diagnostics, infusing confidence in clinical use. Furthermore, the multiomics venture capital boom, over USD 2.2 billion in 2024, demonstrates strong investor confidence in this space. AI integration for multiomics market analysis further raises the bar on interpretation, reducing the complexity barrier and accelerating adoption. These drivers are individually and collectively driving multiomics market expansion and applications in therapeutics, diagnostics, and translational science.
Restraints:
-
Data Complexity, Integration Challenges, and High Operational Costs Impede Market Growth
Although the multiomics market has a robust growth path, it is hindered by a number of constraints, largely related to the difficulty in integrating data, the absence of standardized platforms, and high costs of implementation. Integrating data from genomics, proteomics, transcriptomics, and metabolomics needs sophisticated bioinformatics software and infrastructure, making these available to everyone.
A study published in Nature Biotechnology in 2024 disclosed that an efficient integration of multiomics datasets across only 36% of research institutions was hindered by software compatibility and a lack of workforce expertise.
Even the cost of performing exhaustive multiomics profiling for one patient can run over USD 10,000, excluding routine clinical application. Intellectual property rights issues over algorithmic platforms also slow down cross-institutional cooperation. Particularly in developing countries, supply chain restrictions for high-end reagents and equipment still present a difficulty that influences the availability and scalability of investigations. Additionally, regulatory ambiguity still exists, most famously in multiomics-based diagnostics, since differences in the global standards create hurdles in the product commercialization. For instance, while the FDA has made strides toward embracing integrated omics submissions, there is no accepted framework for multiomic validation yet, slowing down accelerated approvals. Together, these barriers constrain the wider clinical and commercial uptake of multiomics firms' solutions to affect the velocity of multiomics market share growth.
Multiomics Market Segmentation Analysis:
By Product & Service
In 2024, the products segment took the lead in the global multiomics market, capturing the largest share of revenue owing to a strong demand for cutting-edge instruments and consumables used in sequencing, mass spectrometry, and microarrays. This stronghold can be linked to ongoing technological advancements and an increase in purchases by academic and clinical research institutions.
Meanwhile, the services segment is projected to experience the fastest growth as more institutions turn to outsourcing for their complex data analysis and integration needs. The rising use of cloud-based bioinformatics platforms and specialized service providers is boosting scalability and affordability, which in turn is fueling demand in this area.
By Type
The Bulk multiomics market segment accounted for the largest market share in 2024, as it is the most commonly used for large-scale population studies, drug discovery, and disease profiling. It continues to be the norm in multiomics workflows because it is cost-effective and comprises well-established analysis tools.
The single-cell multiomics market is, however, on the rise as the fastest-growing segment, owing to its potential to demystify cellular heterogeneity and identify new biomarkers at the single-cell level. This technology is most important in areas such as oncology and immunology, where cellular-level mechanisms need to be understood.
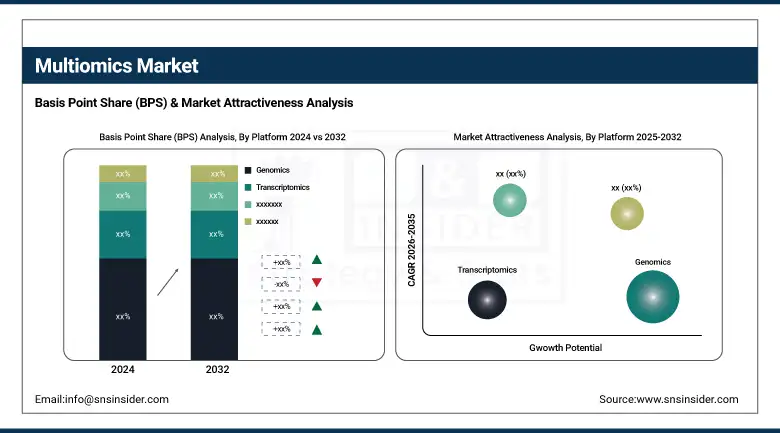
By Platform
The genomics segment dominated the market with a 41.2% revenue share in 2024, due to its leadership position in multiomics workflows and extensive use in precision medicine and genetics of disease research. The improvement in NGS and the reduction in cost per genome have also further solidified its leadership.
Metabolomics is anticipated to expand at the fastest pace with growing awareness of the use of metabolic profiling in interpreting disease phenotypes and drug response. The ability of metabolomics to provide immediate snapshots of biochemical processes is identifying applications in clinical and pharmaceutical studies.
By Application
Oncology had been the leading application segment in 2024, owing to a large level of usage in cancer diagnosis, therapy targeting, and biomarker identification. The requirement for understanding tumor biology at the molecular level has resulted in incorporating multiomics into the majority of oncology pipelines.
The segment of neurology is anticipated to experience the fastest growth, fueled by increasing disease burden of neurodegenerative disorders and demands for systems biology modalities to unravel intricate brain functions and pathologies. Multiomics is assisting in the discovery of new targets and mechanisms in diseases such as Alzheimer's and Parkinson's.
By End-Use
Academic and research institutions took the lead in revenue share in 2024, due to robust public funding, a talented workforce, and their pivotal role in foundational omics research. Global initiatives from organizations, including the NIH and Horizon Europe, have sparked a surge in project-based adoption of multiomics.
On the other hand, pharmaceutical and biotechnology companies are expected to be the fastest-growing end-users, fueled by rising investments in personalized medicine, drug development, and companion diagnostics. Their need for high-throughput, integrated omics solutions to speed up R&D pipelines is a key driver of growth.
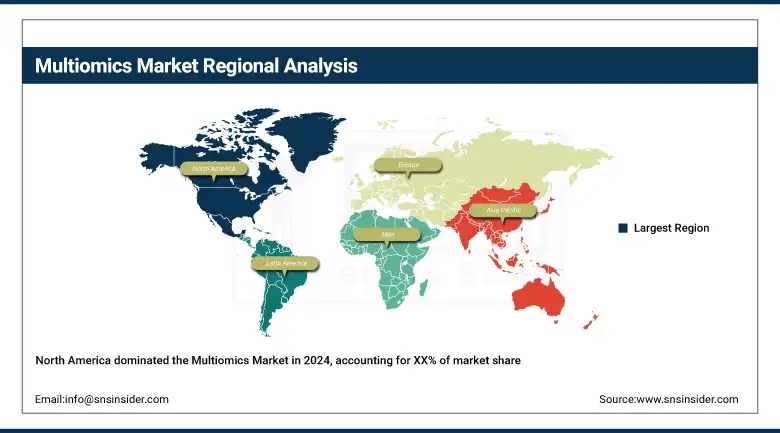
Multiomics Market Regional Insights:
The global multiomics market was led by North America in 2024, primarily because of robust research infrastructure, extensive R&D expenditures, and supportive regulatory efforts favoring multiomics in precision medicine.
Get Customized Report as per Your Business Requirement - Enquiry Now
Europe has the second-largest multiomics market share owing to the robust government support and inter-country academic collaborations in nations such as Germany, France, and the U.K. The continent enjoys funds from the EU's Horizon Europe program, which has committed more than €1.8 billion in omics-based projects up to 2024. Germany leads the continent by virtue of its sophisticated biotechnology industry, university-industry collaborations, and extensive clinical trials that employ multiomics techniques. France and the U.K. also play a big role with country-level initiatives backing personalized medicine. Europe's transformation toward model-integrated healthcare and its leadership in regulatory harmonization, including EMA's directive on omics-based biomarkers, also powers market growth. Even with mature infrastructure, extreme data regulation complexity can be problematic.
Asia Pacific is emerging as the fastest-growing player in the multiomics market, fueled by a wave of investments in genomic infrastructure, clinical research, and the use of omics in managing diseases. China is leading the charge, due to state-supported initiatives like the Precision Medicine Initiative, which is expected to receive over USD 9 billion by 2030. Companies, such as BGI Genomics, are also making a big impact. On the other hand, India is experiencing rapid growth, driven by the Genomics for Public Health Initiative and increasing participation from the private sector in omics-based diagnostics. Japan is holding its own with strong academic research in proteomics and metabolomics, supported by government efforts to integrate these fields into clinical workflows. The region's swift urbanization, high patient volumes, and a growing appetite for personalized healthcare are all propelling this market forward.
Multiomics Market Key Players:
Leading global multiomics companies operating in the market are Thermo Fisher Scientific Inc., Illumina Inc., BD, Danaher (Beckman Coulter), PerkinElmer Inc., Shimadzu Corporation, Bruker, QIAGEN, Agilent Technologies Inc., and BGI Genomics.
Recent Developments in the Multiomics Market:
In March 2025, Thermo Fisher Scientific launched an AI-enabled multiomics analysis platform designed to integrate proteomic and metabolomic data with genomic insights, marking a major leap in translational research capability.
In May 2025, Illumina and NVIDIA announced a partnership to accelerate multiomics market adoption by enhancing data processing speed up to 5–10 times, thereby significantly improving time-to-insight for researchers and clinicians.
| Report Attributes | Details |
|---|---|
| Market Size in 2024 | USD 2.86 billion |
| Market Size by 2032 | USD 8.97 billion |
| CAGR | CAGR of 15.38% From 2025 to 2032 |
| Base Year | 2024 |
| Forecast Period | 2025-2032 |
| Historical Data | 2021-2023 |
| Report Scope & Coverage | Market Size, Segments Analysis, Competitive Landscape, Regional Analysis, DROC & SWOT Analysis, Forecast Outlook |
| Key Segments | • By Product & Service (Products (Instruments, Consumables, and Software), Services) • By Type (Single-cell Multiomics, Bulk Multiomics) • By Platform (Genomics, Transcriptomics, Proteomics, Metabolomics, and Integrated Omics Platforms) • By Application (Cell Biology, Oncology, Neurology, and Immunology) • By End Use (Academic and Research Institutes, Pharmaceutical & Biotechnology Companies, and Others) |
| Regional Analysis/Coverage | North America (US, Canada, Mexico), Europe (Germany, France, UK, Italy, Spain, Poland, Turkey, Rest of Europe), Asia Pacific (China, India, Japan, South Korea, Singapore, Australia, Rest of Asia Pacific), Middle East & Africa (UAE, Saudi Arabia, Qatar, South Africa, Rest of Middle East & Africa), Latin America (Brazil, Argentina, Rest of Latin America) |
| Company Profiles | Thermo Fisher Scientific Inc., Illumina Inc., BD, Danaher (Beckman Coulter), PerkinElmer Inc., Shimadzu Corporation, Bruker, QIAGEN, Agilent Technologies Inc., and BGI Genomics. |
Frequently Asked Questions
Ans: Future multiomics market trends point toward increasing adoption of single-cell multiomics, AI-driven data interpretation, and cloud-based omics integration platforms. Expansion of applications in microbiome research, early cancer detection, and chronic disease monitoring will further increase demand.
Ans: North America, particularly the U.S., leads in mRNA raw material supply due to strong manufacturing infrastructure and R&D capabilities. Europe, with major contributions from Germany and Switzerland, follows closely. Asia Pacific, led by China and India, is rapidly expanding due to growing domestic manufacturing and government support for mRNA-based vaccine development.
Ans: Key players in the mRNA raw materials supply chain include Thermo Fisher Scientific, Merck KGaA, Danaher Corporation (Cytiva), Agilent Technologies, BioNTech SE, TriLink BioTechnologies, Echelon Biosciences, New England Biolabs, Promega Corporation, and GenScript Biotech.
Ans: The multiomics market growth is being driven by increasing demand for personalized medicine, rapid advancements in next-generation sequencing and mass spectrometry technologies, and growing integration of AI in omics data analysis.
Ans: The multiomics market size was valued at USD 2.86 billion in 2024 and is projected to reach USD 8.97 billion by 2032, growing at a CAGR of 15.38% during the forecast period from 2025 to 2032.
Get in Touch
