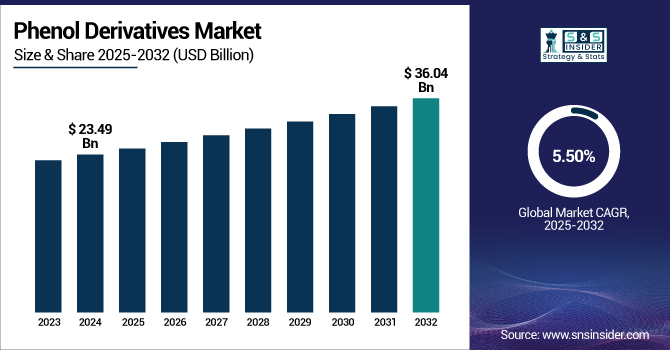
The Phenol Derivatives Market size was valued at USD 23.49 billion in 2024 and is expected to reach USD 36.04 billion by 2032, growing at a CAGR of 5.50% over the forecast period of 2025-2032.
To Get more information on Phenol Derivatives Market - Request Free Sample Report
The growing use in water treatment and industrial cleaning drives the market growth. This growth can be attributed to the increasing use of phenol derivatives in water purification and industrial cleansing applications, given the rising need for effective cleaning agents in industrial processes and environmental protection. Alkylphenols and nonylphenol ethoxylates are widely used as surfactants in cleaning formulations owing to their strong chemical properties that break down oils, grease, and other rough industrial phenol derivatives, clearing waste. These derivatives are crucial in disinfectants, biocides, and coagulants for providing clean water for consumption, used primarily in manufacturing plants, wastewater plants, and municipalities.
For instance, the U.S. Environmental Protection Agency (EPA) makes the methodologies for the analysis of phenols in environmental samples available, such as Method 604, methods for the determination of organic compounds in drinking water, phenol and certain substituted phenols in municipal and industrial wastewater. To make the point, the EPA is concerned with the monitoring of phenol compounds in the environment, which are a direct reflection of a compound manufacturing process used.
Drivers:
Rising Demand from the Construction and Automotive Industries Drive Market Growth
Increased consumption of phenol derivatives in the construction and automotive sectors is a major reason associated with the growth of the phenol derivatives market. Phenols, including bisphenol-A (BPA) and phenolic resins, are important precursor materials for high-performance polymers, such as epoxy resins and polycarbonates. Laminates, insulation foams, adhesives, and coatings that provide durability, chemical resistance, and structural strength are also widely used in construction from these materials. Phenol derivatives find critical application in the automotive sector, where they are used as building blocks to produce lightweight and impact-resistant automotive components, such as headlamp lenses and dashboards, under-the-hood parts, which help automobile manufacturers achieve aggressive fuel efficiency and emission targets by reducing vehicle weight.
For instance, in November 2023, INEOS Phenol acquired Mitsui Phenol Singapore for USD 330 million, marking its entry into the Asian market and expanding its global footprint in bisphenol A production.
Restraints:
Fluctuating aw material prices may hamper the market growth.
Phenol and its derivatives are mainly sourced from petrochemical feedstocks, like benzene, and the benzene market is very vulnerable to the price fluctuation of global crude oil. Crude oil prices are often affected by geopolitical developments, market speculation, and global supply-demand imbalance. When they increase or decrease, it influences the prices of crude palm oil and other materials, which are the raw materials in the production of phenol. Such volatility leads to unexpected production costs, which manufacturers either adjust their price strategy or have their profitability reduced due to a higher cost to procure.
Opportunities:
Increasing Investment in R&D Create Opportunities for Market Growth
Rising investments in research & development (R&D) are increasing the phenol derivatives market growth. It is due to the upgrading of these industries, the demand for various high-performance and cost-effective phenolic compounds environmental-friendly is increasing, and customers are looking for phenolic compounds for various applications, such as automotive, electronics, construction, water treatment, and others. Manufacturers invest in R&D to develop new, improved phenol and its derivatives with superior properties like stronger heat resistance, greater strength, and lower toxicity. This will help meet growing demand for sustainable and innovative offerings while ensuring companies proactively address regulatory demands and evolving market trends.
Moreover, the companies are focused on launching and investing in the phenol derivatives market. For instance, in November 2024, Haldia Petrochemicals signed a pact with Lummus Technology to increase the phenol production capacity. This expansion is to the tune of USD 59.15 million to strengthen domestic production capabilities and reduce import dependency while facilitating the growth of the Indian chemical industry.
By Derivatives
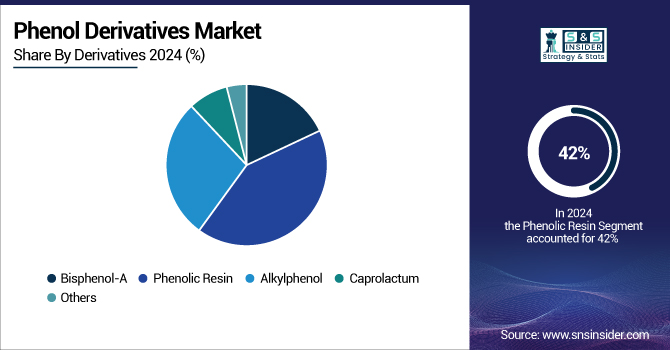
The phenolic resin segment held the largest market share, around 42% in 2023. Phenolic resin is famous for its extraordinary heat resistance, mechanical strength, and electrical insulating properties, and accounts for a variety of applications from automotive to construction and electrical, and industrial manufacturing. They are used in the automotive industry to manufacture friction materials, such as brake pads, owing to their excellent properties under extreme conditions. Furthermore, the high temperature and chemical stability of these materials are exploited for various applications that lend themselves to their use in coatings, adhesives, and laminates, with widespread use in building & construction and electronics.
Alkylphenol held a significant market share and was the fastest-growing segment during the forecast period. The segment’s expansion is driven by its widespread use in various industrial sectors, mainly as a feedstock for surfactants, antioxidants, and synthetic resins. Nonylphenol and octylphenol are among the most widely used industrial substances commonly employed in the production of detergents, emulsifiers, and other chemical intermediates. They are furthermore indispensable feedstocks for the commercial manufacturing of phenolic resins to be found in coatings, adhesives, and automotive parts.
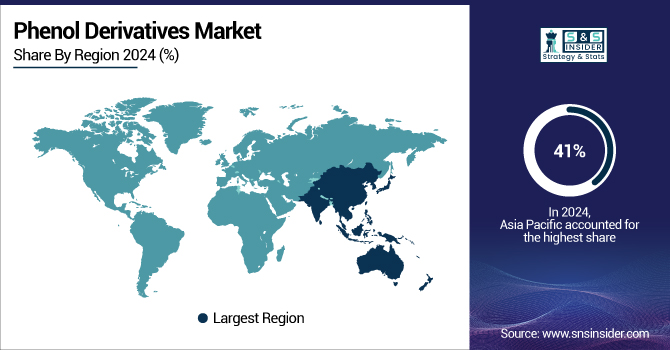
Asia Pacific held the largest market share, around 41%, in 2024. The demand for automotive components, coatings, adhesives, and packaging materials in the growing manufacturing sector, especially in emerging economies, such as China and India, is expected to drive the demand for phenolic products. In addition to this, the Asia Pacific region is also experiencing an increase in the use of sustainable and high-performance materials, which is expected to boost the demand for phenol derivatives.
Moreover, the region is also showing a high market share due to major investments in infrastructure development, especially in the automotive and construction industries, along with the rising adoption of newer technologies. Government initiatives promoting industrialization are also bolstering demand, such as China's "Made in China 2025" strategy and India's "Make in India" drive, which is further augmenting phenol derivatives demand. This large-scale industrial activity, rapid urbanization, and increasing consumer markets render Asia Pacific region the largest globally in terms of the phenol derivatives market.
For instance, according to UN COMTRADE, China exported USD 482 million of phenols in 2024, ranking it among the top global exporters of phenols.
North America held a significant market share and growing region in the forecast period. The advanced chemical manufacturing technologies, well-established R&D infrastructure, and stable regulatory environment in the region promote the adoption of high-performance derivatives.
The U.S. market size was valued at USD 4.23 billion in 2024 and is expected to reach USD 6.94 billion by 2032, growing at a CAGR of 6.40% in the forecast period 2025-2032.
In the U.S., there has been persistent consumption of phenol derivatives, including bisphenol-A (investment in polycarbonate plastics and epoxy resins) and phenolic resins (used in wood adhesives, laminates, and molded products). Additionally, increasing utilization in the electronics and electric vehicle industry is generating the need for phenolic high-performance materials.
Europe held a significant market share in 2024 The region’s growth is driven by the sound chemical manufacturing base, solid regulatory structure favoring high-quality and sustainable products, and sustained demand from the automotive, construction, and electronics industries. Major phenol processing plants and leading chemical manufacturers in the region, including Germany, France, and Belgium. Finally, the group also noted that Europe focuses more on environment-friendly and recyclable materials, which has increased the demand for derivatives, such as phenolic resins and bisphenol-A in various high-performance applications, including insulation, coatings, and plastics.
For instance, in December 2023, INEOS Phenol started operations in Marl, Germany, at the largest Cumene plant in Europe. Designed to deliver a 50% reduction in CO₂ emissions per tonne, the world-scale 750,000 kt/a plant reflects the company's commitment to environmentally sustainable practices.
Get Customized Report as per Your Business Requirement - Enquiry Now
The phenol derivatives companies include SABIC, Solvay, INEOS, LG Chem, Mitsui Chemicals, Honeywell International Inc., Kumho Petrochemical, PTT Global Chemical, Aditya Birla Chemicals, Formosa Chemicals & Fibre Corporation.
These key players help to understand the Phenol Derivatives market share, phenol derivatives market, analysis Phenol Derivatives Market Trends, and Phenol Derivatives industry trends.
In January 2025, Mitsui Chemicals launched a joint study to ensure a stable supply of phenol-related products, aiming to improve logistics efficiency and reduce GHG emissions.
In April 2024, SABIC Fujian Petrochemicals selected KBR's phenol technology for a new 250 KTA phenol plant in China. The project aims to enhance sustainability through reduced energy consumption.
Report Attributes | Details |
Market Size in 2024 | USD 23.49 Billion |
Market Size by 2032 | USD 36.04 Billion |
CAGR | CAGR of5.50% From 2025 to 2032 |
Base Year | 2024 |
Forecast Period | 2025-2032 |
Historical Data | 2021-2023 |
Report Scope & Coverage | Market Size, Segments Analysis, Competitive Landscape, Regional Analysis, DROC & SWOT Analysis, Forecast Outlook |
Key Segments | • By Derivatives (Bisphenol-A, Phenolic Resin, Alkylphenol, Caprolactam, Other) |
Regional Analysis/Coverage | North America (US, Canada, Mexico), Europe (Germany, France, UK, Italy, Spain, Poland, Turkey, Rest of Europe), Asia Pacific (China, India, Japan, South Korea, Singapore, Australia, Rest of Asia Pacific), Middle East & Africa (UAE, Saudi Arabia, Qatar, South Africa, Rest of Middle East & Africa), Latin America (Brazil, Argentina, Rest of Latin America) |
Company Profiles | SABIC, Solvay, INEOS, LG Chem, Mitsui Chemicals, Honeywell International Inc., Kumho Petrochemical, PTT Global Chemical, Aditya Birla Chemicals, Formosa Chemicals & Fibre Corporation. |
Ans: The Phenol Derivatives Market was valued at USD 23.49 billion in 2024.
Ans: The expected CAGR of the global Phenol Derivatives Market during the forecast period is 5.50%.
Ans: Phenolic Resin will grow rapidly in the Phenol Derivatives Market from 2024 to 2032.
Ans: Rising demand from the construction and automotive industries drive market growth.
Ans: Asia Pacific led the Phenol Derivatives Market in the region with the highest revenue share in 2024.
Table of contents
1. Introduction
1.1 Market Definition
1.2 Scope (Inclusion and Exclusions)
1.3 Research Assumptions
2. Executive Summary
2.1 Market Overview
2.2 Regional Synopsis
2.3 Competitive Summary
3. Research Methodology
3.1 Top-Down Approach
3.2 Bottom-up Approach
3.3. Data Validation
3.4 Primary Interviews
4. Market Dynamics Impact Analysis
4.1 Market Driving Factors Analysis
4.1.1 Drivers
4.1.2 Restraints
4.1.3 Opportunities
4.1.4 Challenges
4.2 PESTLE Analysis
4.3 Porter’s Five Forces Model
5. Statistical Insights and Trends Reporting
5.1 Production Capacity and Utilization by Country, By Type, 2024
5.2 Feedstock Prices by Country, and Type, 2024
5.3 Regulatory Impact by Country and By Derivatives 2024.
5.4 Environmental Metrics: Emissions Data, Waste Management Practices, and Sustainability Initiatives by Region
5.5 Innovation and R&D, Type, 2024
6. Competitive Landscape
6.1 List of Major Companies, By Region
6.2 Market Share Analysis, By Region
6.3 Product Benchmarking
6.3.1 Product specifications and features
6.3.2 Pricing
6.4 Strategic Initiatives
6.4.1 Marketing and promotional activities
6.4.2 Distribution and Supply Chain Strategies
6.4.3 Expansion plans and new product launches
6.4.4 Strategic partnerships and collaborations
6.5 Technological Advancements
6.6 Market Positioning and Branding
7. Phenol Derivatives Market Segmentation, By Derivatives
Chapter Overview
7.2 Bisphenol-A
7.2.1 Bisphenol-A Analysis Market Trends Analysis (2021-2032)
7.2.2 Bisphenol-A Analysis Market Size Estimates and Forecasts to 2032 (USD Billion)
7.3 Phenolic Resin
7.3.1 Phenolic Resin Market Trends Analysis (2021-2032)
7.3.2 Phenolic Resin Market Size Estimates and Forecasts to 2032 (USD Billion)
7.4 Alkylphenol
7.4.1 Alkylphenol Market Trends Analysis (2021-2032)
7.4.2 Alkylphenol Market Size Estimates and Forecasts to 2032 (USD Billion)
7.5 Caprolactam
7.5.1 Caprolactam Market Trends Analysis (2021-2032)
7.5.2 Caprolactum Market Size Estimates and Forecasts to 2032 (USD Billion)
7.5 Others
7.5.1 Others Market Trends Analysis (2021-2032)
7.5.2 Others Market Size Estimates and Forecasts to 2032 (USD Billion)
8. Regional Analysis
8.1 Chapter Overview
8.2 North America
8.2.1 Trends Analysis
8.2.2 North America Phenol Derivatives Market Estimates and Forecasts, by Country (2021-2032) (USD Billion)
8.2.3 North America Phenol Derivatives Market Estimates and Forecasts, By Derivatives (2021-2032) (USD Billion)
8.2.4 USA
8.2.4.1 USA Phenol Derivatives Market Estimates and Forecasts, By Derivatives (2021-2032) (USD Billion)
8.2.5 Canada
8.2.5.1 Canada Phenol Derivatives Market Estimates and Forecasts, By Derivatives (2021-2032) (USD Billion)
8.2.6 Mexico
8.2.6.1 Mexico Phenol Derivatives Market Estimates and Forecasts, By Derivatives (2021-2032) (USD Billion)
8.3 Europe
8.3.1 Trends Analysis
8.3.2 Europe Phenol Derivatives Market Estimates and Forecasts, by Country (2021-2032) (USD Billion)
8.3.3 Europe Phenol Derivatives Market Estimates and Forecasts, By Derivatives (2021-2032) (USD Billion)
8.3.4 Germany
8.3.4.1 Germany Phenol Derivatives Market Estimates and Forecasts, By Derivatives (2021-2032) (USD Billion)
8.3.5 France
8.3.5.1 France Phenol Derivatives Market Estimates and Forecasts, By Derivatives (2021-2032) (USD Billion)
8.3.6 UK
8.3.6.1 UK Phenol Derivatives Market Estimates and Forecasts, By Derivatives (2021-2032) (USD Billion)
8.3.7 Italy
8.3.7.1 Italy Phenol Derivatives Market Estimates and Forecasts, By Derivatives (2021-2032) (USD Billion)
8.3.8 Spain
8.3.8.1 Spain Phenol Derivatives Market Estimates and Forecasts, By Derivatives (2021-2032) (USD Billion)
8.3.9 Poland
8.3.9.1 Poland Phenol Derivatives Market Estimates and Forecasts, By Derivatives (2021-2032) (USD Billion)
8.3.10 Turkey
8.3.10.1 Turkey Phenol Derivatives Market Estimates and Forecasts, By Derivatives (2021-2032) (USD Billion)
8.3.11 Rest of Europe
8.3.11.1 Rest of Europe Phenol Derivatives Market Estimates and Forecasts, By Derivatives (2021-2032) (USD Billion)
8.4 Asia Pacific
8.4.1 Trends Analysis
8.4.2 Asia Pacific Phenol Derivatives Market Estimates and Forecasts, by Country (2021-2032) (USD Billion)
8.4.3 Asia Pacific Phenol Derivatives Market Estimates and Forecasts, By Derivatives (2021-2032) (USD Billion)
8.4.4 China
8.4.4.1 China Phenol Derivatives Market Estimates and Forecasts, By Derivatives (2021-2032) (USD Billion)
8.4.5 India
8.4.5.1 India Phenol Derivatives Market Estimates and Forecasts, By Derivatives (2021-2032) (USD Billion)
8.4.6 Japan
8.4.6.1 Japan Phenol Derivatives Market Estimates and Forecasts, By Derivatives (2021-2032) (USD Billion)
8.4.7 South Korea
8.4.7.1 South Korea Phenol Derivatives Market Estimates and Forecasts, By Derivatives (2021-2032) (USD Billion)
8.4.8 Singapore
8.4.8.1 Singapore Phenol Derivatives Market Estimates and Forecasts, By Derivatives (2021-2032) (USD Billion)
8.4.9 Australia
8.4.9.1 Australia Phenol Derivatives Market Estimates and Forecasts, By Derivatives (2021-2032) (USD Billion)
8.4.10 Rest of Asia Pacific
9.4.10.1 Rest of Asia Pacific Phenol Derivatives Market Estimates and Forecasts, By Derivatives (2021-2032) (USD Billion)
8.5 Middle East & Africa
8.5.1 Trends Analysis
8.5.2 Middle East & Africa Phenol Derivatives Market Estimates and Forecasts, by Country (2021-2032) (USD Billion)
8.5.3 Middle East & Africa Phenol Derivatives Market Estimates and Forecasts, By Derivatives (2021-2032) (USD Billion)
8.5.4 UAE
8.5.4.1 UAE Phenol Derivatives Market Estimates and Forecasts, By Derivatives (2021-2032) (USD Billion)
8.5.5 Saudi Arabia
8.5.5.1 Saudi Arabia Phenol Derivatives Market Estimates and Forecasts, By Derivatives (2021-2032) (USD Billion)
8.5.6 Qatar
8.5.6.1 Qatar Phenol Derivatives Market Estimates and Forecasts, By Derivatives (2021-2032) (USD Billion)
8.5.7 South Africa
8.5.7.1 South Africa Phenol Derivatives Market Estimates and Forecasts, By Derivatives (2021-2032) (USD Billion)
8.5.8 Middle East & Africa
8.5.8.1 Middle East & Africa Phenol Derivatives Market Estimates and Forecasts, By Derivatives (2021-2032) (USD Billion)
8.6 Latin America
8.6.1 Trends Analysis
8.6.2 Latin America Phenol Derivatives Market Estimates and Forecasts, by Country (2021-2032) (USD Billion)
8.6.3 Latin America Phenol Derivatives Market Estimates and Forecasts, By Derivatives (2021-2032) (USD Billion)
8.6.4 Brazil
8.6.4.1 Brazil Phenol Derivatives Market Estimates and Forecasts, By Derivatives (2021-2032) (USD Billion)
8.6.5 Argentina
8.6.5.1 Argentina Phenol Derivatives Market Estimates and Forecasts, By Derivatives (2021-2032) (USD Billion)
8.6.6 Rest of Latin America
8.6.6.1 Rest of Latin America Phenol Derivatives Market Estimates and Forecasts, By Derivatives (2021-2032) (USD Billion)
9. Company Profiles
9.1 SABIC
9.1.1 Company Overview
9.1.2 Financial
9.1.3 Products/ Services Offered
9.1.4 SWOT Analysis
9.2 Solvay
9.2.1 Company Overview
9.2.2 Financial
9.2.3 Products/ Services Offered
9.2.4 SWOT Analysis
9.3 INEOS
9.3.1 Company Overview
9.3.2 Financial
9.3.3 Products/ Services Offered
9.3.4 SWOT Analysis
9.4 LG Chem
9.4.1 Company Overview
9.4.2 Financial
9.4.3 Products/ Services Offered
9.4.4 SWOT Analysis
9.5 Mitsui Chemicals
9.5.1 Company Overview
9.5.2 Financial
9.5.3 Products/ Services Offered
9.5.4 SWOT Analysis
9.6 Honeywell International Inc.
9.6.1 Company Overview
9.6.2 Financial
9.6.3 Products/ Services Offered
9.6.4 SWOT Analysis
9.7 Kumho Petrochemical
9.7.1 Company Overview
9.7.2 Financial
9.7.3 Products/ Services Offered
9.7.4 SWOT Analysis
9.8 PTT Global Chemical
9.8.1 Company Overview
9.8.2 Financial
9.8.3 Products/ Services Offered
9.8.4 SWOT Analysis
9.9 Aditya Birla Chemicals
9.9.1 Company Overview
9.9.2 Financial
9.9.3 Products/ Services Offered
9.9.4 SWOT Analysis
9.10 Formosa Chemicals & Fibre Corporation
9.10.1 Company Overview
9.10.2 Financial
9.10.3 Products/ Services Offered
9.10.4 SWOT Analysis
10. Use Cases and Best Practices
11. Conclusion
An accurate research report requires proper strategizing as well as implementation. There are multiple factors involved in the completion of good and accurate research report and selecting the best methodology to compete the research is the toughest part. Since the research reports we provide play a crucial role in any company’s decision-making process, therefore we at SNS Insider always believe that we should choose the best method which gives us results closer to reality. This allows us to reach at a stage wherein we can provide our clients best and accurate investment to output ratio.
Each report that we prepare takes a timeframe of 350-400 business hours for production. Starting from the selection of titles through a couple of in-depth brain storming session to the final QC process before uploading our titles on our website we dedicate around 350 working hours. The titles are selected based on their current market cap and the foreseen CAGR and growth.
The 5 steps process:
Step 1: Secondary Research:
Secondary Research or Desk Research is as the name suggests is a research process wherein, we collect data through the readily available information. In this process we use various paid and unpaid databases which our team has access to and gather data through the same. This includes examining of listed companies’ annual reports, Journals, SEC filling etc. Apart from this our team has access to various associations across the globe across different industries. Lastly, we have exchange relationships with various university as well as individual libraries.
Step 2: Primary Research
When we talk about primary research, it is a type of study in which the researchers collect relevant data samples directly, rather than relying on previously collected data. This type of research is focused on gaining content specific facts that can be sued to solve specific problems. Since the collected data is fresh and first hand therefore it makes the study more accurate and genuine.
We at SNS Insider have divided Primary Research into 2 parts.
Part 1 wherein we interview the KOLs of major players as well as the upcoming ones across various geographic regions. This allows us to have their view over the market scenario and acts as an important tool to come closer to the accurate market numbers. As many as 45 paid and unpaid primary interviews are taken from both the demand and supply side of the industry to make sure we land at an accurate judgement and analysis of the market.
This step involves the triangulation of data wherein our team analyses the interview transcripts, online survey responses and observation of on filed participants. The below mentioned chart should give a better understanding of the part 1 of the primary interview.
Part 2: In this part of primary research the data collected via secondary research and the part 1 of the primary research is validated with the interviews from individual consultants and subject matter experts.
Consultants are those set of people who have at least 12 years of experience and expertise within the industry whereas Subject Matter Experts are those with at least 15 years of experience behind their back within the same space. The data with the help of two main processes i.e., FGDs (Focused Group Discussions) and IDs (Individual Discussions). This gives us a 3rd party nonbiased primary view of the market scenario making it a more dependable one while collation of the data pointers.
Step 3: Data Bank Validation
Once all the information is collected via primary and secondary sources, we run that information for data validation. At our intelligence centre our research heads track a lot of information related to the market which includes the quarterly reports, the daily stock prices, and other relevant information. Our data bank server gets updated every fortnight and that is how the information which we collected using our primary and secondary information is revalidated in real time.
Step 4: QA/QC Process
After all the data collection and validation our team does a final level of quality check and quality assurance to get rid of any unwanted or undesired mistakes. This might include but not limited to getting rid of the any typos, duplication of numbers or missing of any important information. The people involved in this process include technical content writers, research heads and graphics people. Once this process is completed the title gets uploader on our platform for our clients to read it.
Step 5: Final QC/QA Process:
This is the last process and comes when the client has ordered the study. In this process a final QA/QC is done before the study is emailed to the client. Since we believe in giving our clients a good experience of our research studies, therefore, to make sure that we do not lack at our end in any way humanly possible we do a final round of quality check and then dispatch the study to the client.
Key Segments:
By Derivatives
Bisphenol-A
Phenolic Resin
Alkylphenol
Caprolactum
Others
Request for Segment Customization as per your Business Requirement: Segment Customization Request
Regional Coverage:
North America
US
Canada
Mexico
Europe
Germany
France
UK
Italy
Spain
Poland
Turkey
Rest of Europe
Asia Pacific
China
India
Japan
South Korea
Singapore
Australia
Rest of Asia Pacific
Middle East & Africa
UAE
Saudi Arabia
Qatar
South Africa
Rest of Middle East & Africa
Latin America
Brazil
Argentina
Rest of Latin America
Request for Country Level Research Report: Country Level Customization Request
Available Customization
With the given market data, SNS Insider offers customization as per the company’s specific needs. The following customization options are available for the report:
Detailed Volume Analysis
Criss-Cross segment analysis (e.g. Product X Application)
Competitive Product Benchmarking
Geographic Analysis
Additional countries in any of the regions
Customized Data Representation
Detailed analysis and profiling of additional market players
The Bio-Based Coatings Market Size was valued at USD 12.74 billion in 2023. It is projected to reach USD 26.82 billion by 2031 and grow at a CAGR of 9.7% over the forecast period 2024-2031.
The Geofoam Market Size was valued at USD 764.9 million in 2023 and is expected to reach USD 1466.6 million by 2032 and grow at a CAGR of 7.5% over the forecast period 2024-2032.
Cold Gas Spray Coating Market size was valued at USD 1.04 Billion in 2023 and is expected to reach USD 1.55 Billion by 2032, at a CAGR of 4.6% from 2024-2032.
The Advanced Insulation Materials Market was valued at USD 8.20 Bn in 2023 and is expected to reach USD 14.68 Bn by 2032, at a CAGR of 6.70% from 2024-2032.
The Crude Sulfate Turpentine (CST) market is a critical segment within the global chemicals industry, with wide-ranging applications across sectors such as fragrances, pharmaceuticals, and paints.
The Extruders Market Size was valued at USD 10.0 billion in 2023 and is expected to reach USD 14.9 billion by 2032 and grow at a CAGR of 4.5% 2024-2032.
Hi! Click one of our member below to chat on Phone