Remote Sensing Technology Market Report Scope & Overview:
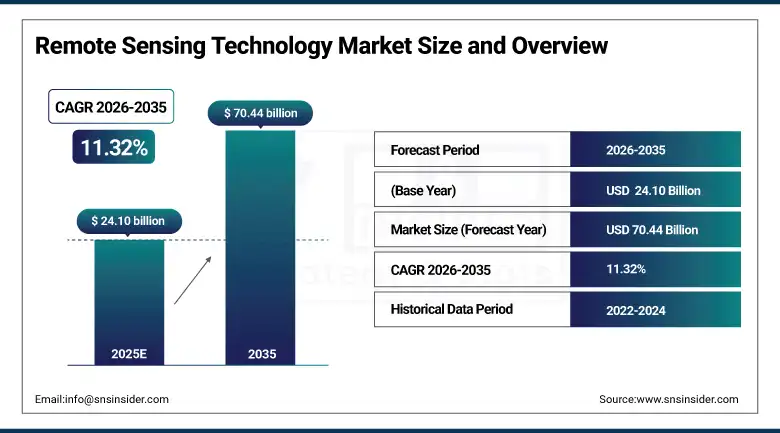
The Remote Sensing Technology Market size was valued at USD 24.10 Billion in 2025 and is projected to reach USD 70.44 Billion by 2035, growing at a CAGR of 11.32% during 2026–2035.
The Remote Sensing Technology Market is in a growth phase, driven by the increased demand for real-time geo-data in various sectors such as agriculture, defense, environmental monitoring, and urban planning. The development of satellite image technology, drone technology, and data analytics is also contributing to the growth of this market. The governments and private sector are investing heavily in earth observation technology for monitoring the climate and managing various disasters. The integration of AI and cloud computing is also contributing to the growth of this market.
Remote Sensing Technology Market Size and Growth Forecast:
-
Market Size in 2025: USD 24.10 Billion
-
Market Size by 2035: USD 70.44 Billion
-
CAGR: 11.32% during 2026–2035
-
Base Year: 2025
-
Forecast Period: 2026–2035
-
Historical Data: 2022–2024
To Get more information On Remote Sensing Technology Market - Request Free Sample Report
Remote Sensing Technology Market Key Trends:
-
Satellite-based earth observation systems are advancing environmental monitoring, disaster management, precision agriculture, and urban planning applications.
-
High-resolution imaging, hyperspectral sensors, and LiDAR technologies are enabling more accurate data collection and detailed surface analysis.
-
AI-powered data analytics, machine learning algorithms, and cloud-based platforms are improving real-time data processing and large-scale geospatial insights.
-
Integration of drones (UAVs) with remote sensing technologies is supporting cost-effective, flexible, and high-frequency data acquisition.
-
Rising demand for climate monitoring, resource management, and defense surveillance is driving adoption of advanced remote sensing solutions.
-
Standardized data processing frameworks, interoperable platforms, and government-backed space programs are enhancing data accessibility, reliability, and global collaboration.
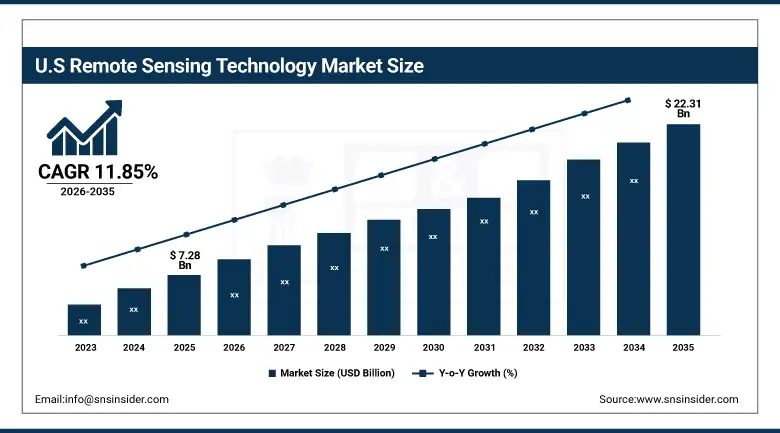
U.S. Remote Sensing Technology Market Size Outlook:
The U.S. Remote Sensing Technology Market was valued at USD 7.28 Billion in 2025 and is projected to reach USD 22.31 Billion by 2035, growing at a CAGR of 11.85% during 2026–2035, Growth of the U.S. Remote Sensing Technology Market is driven by rising government investments in space programs, increasing defense and surveillance needs, expanding use in precision agriculture, and growing adoption of AI-based geospatial analytics for environmental monitoring, disaster management, and infrastructure planning.
Remote Sensing Technology Market Key Drivers:
-
Rising Demand for Geospatial Intelligence and Advancements in Satellite and AI Technologies are Driving the Remote Sensing Technology Market Growth
Remote sensing technology is revolutionizing industries like agriculture, defense, environment, and town planning by allowing the collection of data in real-time with high accuracy. The increasing trend of using satellite imaging and drone-based surveillance is boosting the decision-making process in various sectors. Approximately 50% of precision agriculture techniques rely on remote sensing technology for crop management and improvement of crop productivity. Moreover, the introduction of AI-based analytics is boosting the remote sensing market growth by allowing data analysis with the help of cloud services.
For instance, in 2025, the adoption of high-resolution satellite imaging and AI-integrated geospatial platforms increased significantly across government and commercial sectors.
Remote Sensing Technology Market Key Restraints:
-
High Initial Investment and Data Processing Complexity Limit Market Expansion
However, the high cost of deploying satellites, sensors, and data processing is a major restraint that is likely to hamper the remote sensing technology market. The requirement of skilled resources, along with software tools, is another factor that is likely to increase the overall cost of operation. In addition, the processing of large volumes of data is likely to become a challenge, especially for small and medium-sized enterprises, as it requires advanced computing capabilities. The regulatory environment, along with data privacy, is likely to act as a restraint in some regions, especially in developing countries.
Remote Sensing Technology Market Key Opportunities:
-
Growing Adoption of UAVs and Expanding Applications in Climate Monitoring Create New Growth Opportunities
The growing use of unmanned aerial vehicles (UAVs), also known as drones, presents opportunities in the market for remote sensing technology. The use of drones provides cost-effective solutions to industries such as agriculture, mining, and disaster response. In addition, the growing global concern about monitoring climate change, natural resources, and smart cities will drive the demand for advanced remote sensing technology.
For instance, organizations such as NASA, the European Space Agency (ESA), and private companies like Planet Labs are expanding satellite constellations and data services to support environmental monitoring and commercial applications.
Remote Sensing Technology Market Segments:
-
By Technology, Passive Sensing held the largest market share of 58.64% in 2025, while Active Sensing is expected to grow at the fastest CAGR of 12.03% during 2026–2035.
-
By Platform, Satellite systems dominated with 67.82% market share in 2025, whereas Aerial Systems are projected to record the fastest CAGR of 12.41% through 2026–2035.
-
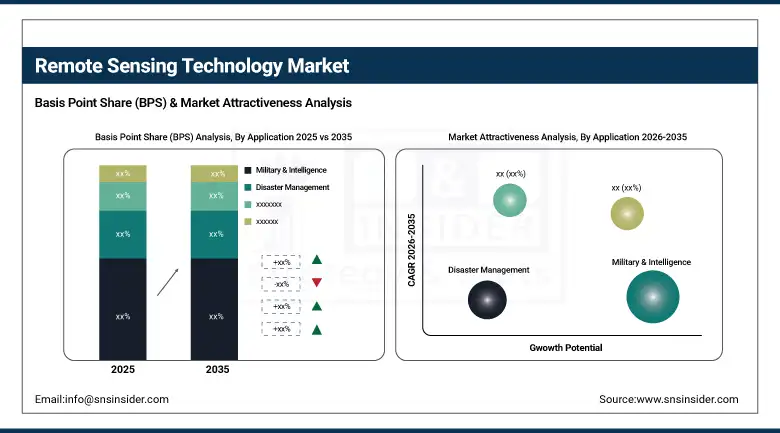
By Application, Military & Intelligence led with 34.27% market share in 2025, while Disaster Management is expected to grow at the fastest CAGR of 12.76% during the forecast period.
By Technology, Passive Sensing Dominates the Market While Active Sensing Grows Rapidly:
The Passive Sensing segment dominates the Remote Sensing Technology Market in terms of share, and this is because Passive Sensing is a cost-effective technology. Also, it is used in satellite imaging and environmental monitoring. Passive Sensing uses the energy of the sun and other environmental factors to provide accurate and precise images. Therefore, Passive Sensing is used in agriculture, forestry, and climate change studies.
Active Sensing is gaining significant traction in the Remote Sensing Technology Market, and this is because the use of Active Sensing is increasing. This is because Active Sensing is able to provide accurate and precise images in adverse conditions such as low light and clouds.
By Platform, Aerial Systems Dominate While Satellite Segment Expands Rapidly:
Aerial Systems are the market leaders due to the increased usage of drones and UAVs in various industries such as agriculture, infrastructure development, and environmental monitoring.
However, the Satellite segment is growing at a rapid pace due to its ability to provide wide area coverage and monitoring capabilities. The increased need to monitor the globe and the environment, as well as the development of satellite technology, is boosting the usage of satellite-based remote sensing solutions.
By Application, Military & Intelligence Dominates While Disaster Management Emerges as Fastest Growing:
The Military & Intelligence segment dominates the global remote sensing technology market, given the increased adoption of the technology in surveillance, reconnaissance, and security operations. The technology plays a vital role in the operations of various agencies in the defense sector.
On the other hand, the Disaster Management segment is the fastest-growing segment in the global remote sensing technology market, given the increased adoption of the technology in the prediction, assessment, and response to natural calamities, including floods, earthquakes, and wildfires.
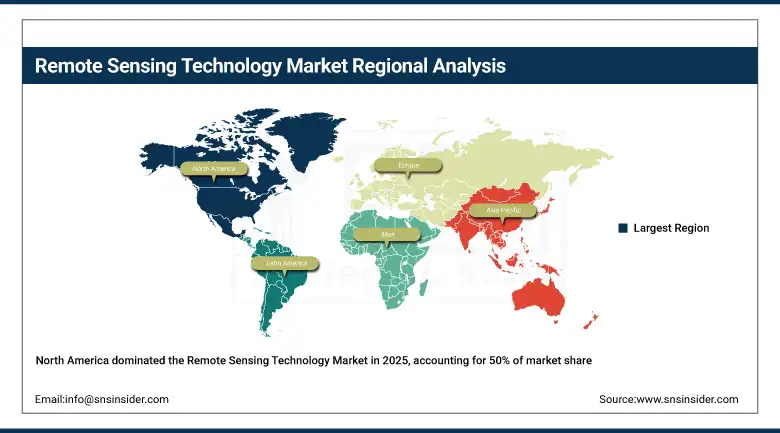
Remote Sensing Technology Market Regional Analysis:
North America Remote Sensing Technology Market Insights:
In 2025, North America has the highest share in the remote sensing technology market, which is around 50%. This can be attributed to the presence of key players, investments in space and defense technology, and the presence of advanced satellite remote sensing technology in the region. R&D activities are focused on active and passive remote sensing technology, mainly in North America, specifically in the United States. The increased demand for remote sensing technology in various sectors in North America, such as agriculture, environmental, and defense, has contributed to the region’s share in the marketplace.
Get Customized Report as per Your Business Requirement - Enquiry Now
Asia-Pacific Remote Sensing Technology Market Insights:
The Asia Pacific is also expected to witness the fastest growth in terms of remote sensing technology adoption during 2026 to 2035. The growth is attributed to the high rate of industrialization, increased investments in space technology, as well as the adoption of remote sensing technology by various industries. Other countries, such as China, India, Japan, and South Korea, have invested heavily in satellite technology as well as data analysis capabilities to improve monitoring and predictive analysis capabilities in various industries, such as agriculture, as well as natural resource management.
Europe Remote Sensing Technology Market Insights:
The region of Europe has a substantial share in the global market of Remote Sensing Technology. This is due to favorable regulations and space activities of prominent organizations such as the European Space Agency (ESA). The region is focused on environmental monitoring, climate change, and sustainable development. The application of remote sensing technology in agriculture and smart cities is also adding momentum to the market.
Latin America Remote Sensing Technology Market Insights:
Latin America is witnessing a growth trend in the Remote Sensing Technology Market, driven by the increased application of remote sensing technology in the agricultural, forestry, and natural resource sectors. Remote sensing technology is being used in countries such as Brazil and Argentina for crop monitoring and deforestation tracking. Increasing environmental conservation awareness is also contributing to the growth of the remote sensing technology market in the region.
Middle East & Africa (MEA) Remote Sensing Technology Market Insights:
The Middle East & Africa market is experiencing growth, driven by increasing investments in developing infrastructure, oil & gas exploration, and environment monitoring activities. The applications of remote sensing in desertification studies, water resources, and urban planning are on the rise. The government is taking initiatives, along with the help of international space agencies, which is likely to increase the market in the future.
Remote Sensing Technology Market Competitive Landscape:
Maxar Intelligence is a leading U.S.-based provider of earth imaging and geospatial intelligence solutions, specializing in satellite services and radar technologies.
-
In November 2024, Maxar Intelligence sold its Radar and Sensor Technology (RST) group to ARKA Group, a Danbury, Connecticut-based government contractor. This strategic move strengthened ARKA’s synthetic aperture radar (SAR) and geospatial intelligence capabilities while enabling Maxar to focus more closely on SAR advancements through its partnership with Umbra.
Northrop Grumman is a global aerospace and defense technology leader, delivering advanced systems in space, defense, and security, with strong expertise in radar and satellite protection technologies.
-
In January 2024, Northrop Grumman, together with the AUKUS alliance, unveiled the Deep Space Advanced Radar Capability (DARC). This next-generation system enhances space surveillance and satellite protection in geosynchronous orbit, offering 24/7, weather-resilient coverage via a global network of advanced ground-based sensors, marking a major breakthrough in satellite defense.
Remote Sensing Technology Companies are:
-
Vantor (Maxar Technologies)
-
Esri
-
General Dynamics Mission Systems, Inc.
-
Lockheed Martin Corporation
-
Orbital Insight
-
Planet Labs PBC
-
Northrop Grumman Corporation
-
General Dynamics Corp.
-
Honeywell Technology Solutions Inc.
-
ITT Corp.
-
Lumasense Technologies, Inc.
-
Thales Group
-
Leica Geosystems Holdings AG
-
DigitalGlobe
| Report Attributes | Details |
|---|---|
| Market Size in 2025 | USD 24.10 Billion |
| Market Size by 2035 | USD 70.44 Billion |
| CAGR | CAGR of 11.23% From 2026 to 2035 |
| Base Year | 2025 |
| Forecast Period | 2026-2035 |
| Historical Data | 2022-2024 |
| Report Scope & Coverage | Market Size, Segments Analysis, Competitive Landscape, Regional Analysis, DROC & SWOT Analysis, Forecast Outlook |
| Key Segments | • By Technology (Active Sensing, Passive Sensing) • By Platform (Satellite, Aerial Systems) • By Application (Agriculture & Living Resources, Military & Intelligence, Disaster Management, Infrastructure, Weather, Others) |
| Regional Analysis/Coverage | North America (US, Canada), Europe (Germany, UK, France, Italy, Spain, Russia, Poland, Rest of Europe), Asia Pacific (China, India, Japan, South Korea, Australia, ASEAN Countries, Rest of Asia Pacific), Middle East & Africa (UAE, Saudi Arabia, Qatar, South Africa, Rest of Middle East & Africa), Latin America (Brazil, Argentina, Mexico, Colombia, Rest of Latin America). |
| Company Profiles | Maxar Technologies (USA), Esri (USA), General Dynamics Mission Systems, Inc. (USA), Hexagon AB (Sweden), Lockheed Martin Corporation (USA), Orbital Insight (USA), Planet Labs PBC (USA), Northrop Grumman Corporation (USA), General Dynamics Corp. (USA), Raytheon Corporation (USA), Honeywell Technology Solutions Inc. (USA), ITT Corp. (USA), Lumasense Technologies, Inc. (USA), Thales Group (France), Leica Geosystems Holdings AG (Switzerland), DigitalGlobe (USA). |
Frequently Asked Questions
Rising demand for real-time geospatial data, advancements in satellite and drone technologies, increasing defense and surveillance needs, and growing applications in agriculture, disaster management, and environmental monitoring are driving the market.
The Remote Sensing Technology market is expected to grow at a compound annual growth rate of 11.32% from 2026-2035.
The global remote sensing technology market size was estimated at USD 24.10 billion in 2025 and is expected to reach USD 70.44 billion in 2035.
The Passive Sensing segment accounted for the largest share of the Remote Sensing Technology market.
The remote sensing technology market faces challenges such as high costs, data overload, accuracy and calibration issues, regulatory concerns, environmental interference, and technological limitations.
Get in Touch
