Power Quality Measurement Equipment Market Report Scope & Overview:
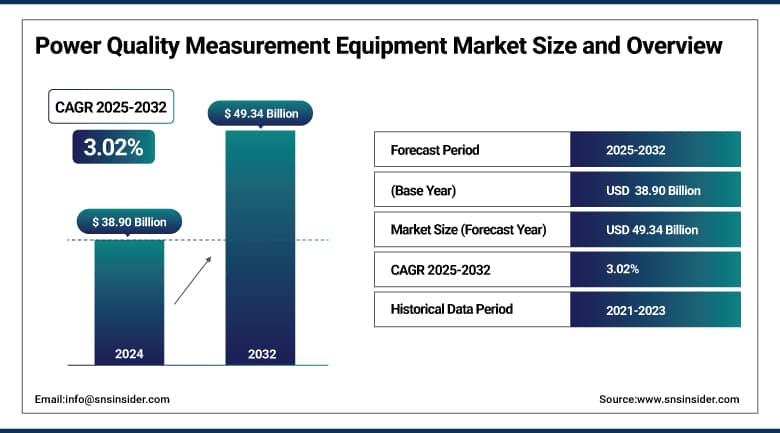
The Power Quality Measurement Equipment Market size was valued at USD 38.90 billion in 2024 and is expected to reach USD 49.34 billion by 2032, growing at a CAGR of 3.02% over the forecast period of 2025-2032.
The power quality equipment market growth is driven by increasing industrialization and urbanization, leading to increased production and commercial setups. Energy efficiency monitoring is a growing focus in this transformation, as it is essential to identify and rectify power anomalies, including voltage sags, harmonics, and transients. To reduce the time required for operations, coupled with the rising industrial and commercial energy consumption and demand for improved energy utilization, advanced power quality testing devices are steadily becoming an integral part of operations for real-time diagnostics and system optimization.
Innovation in the power quality measurement equipment industry primarily focuses on integrating IoT, cloud-based analytics, and AI-powered diagnostics. Such developments are improving the precision, connectivity, and user interface of measuring devices, enabling smart monitoring and fast fault detection. In addition, the transition towards sustainable infrastructure, along with the integrated electrical networks owing to renewable energy, is also responsible for driving the advanced adoption of modern solutions in the power quality equipment market. The market overall is experiencing an upward growth trajectory because of modernization and a widespread movement toward electrical efficiency, stability, and preventative maintenance through technology innovation. With the increasing digitalization of industries, the need for monitoring solutions for quality power will rise to the next level.
In May 2025, ITC Holdings Corp. will conduct low-flying helicopter inspections across Michigan from May 27 to June 30, 2025. These patrols, part of ITC’s vegetation management program, aim to detect damaged equipment and potential hazards. The initiative supports proactive maintenance and is mandated by the North American Electric Reliability Corporation.
To Get More Information On Power Quality Measurement Equipment Market - Request Free Sample Report
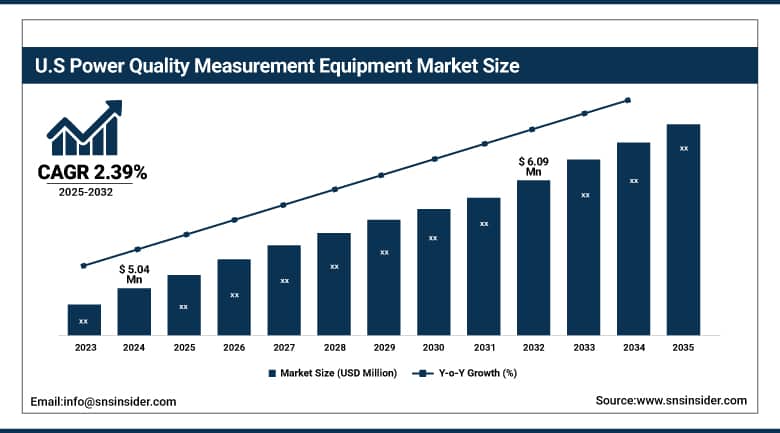
The U.S. Power Quality Measurement Equipment Market is expected to grow steadily from USD 5.04 million in 2024 to USD 6.09 million by 2032, with a CAGR of 2.39%. The growth is being propelled by soaring investment in power infrastructure and rising emphasis on observing and maintaining power quality. Growth in the market can also be attributed to the availability of technologically advanced measurement equipment. The steady increases indicate strong interest across industrial, commercial, and utility markets.
Power Quality Measurement Equipment Market Dynamics
Drivers
-
Rising industrial automation and electrification are driving critical demand for advanced power quality solutions
The rapid growth of industrial automotive and pharmaceuticals is changing due to the rapid evolution of industrial automation and electrification. With the growing dependence of these industries on automated processes and electrified systems, the need for a high-quality and uninterrupted power supply is becoming all but a necessity. Power outages or fluctuations can lead to expensive downtimes, injure delicate equipment, and decrease functioning efficiency. These challenges have led to the widespread adoption of advanced power quality measurement and monitoring tools. They help identify and prevent power disturbances in real-time, providing for seamless and zero-downtime operations. The media keeps talking about global investments in smart factories and industry 4.0 initiatives, leading to more electrification and automation. This trend emphasizes the necessity for power quality equipment to facilitate sustainable, effective, and modern-day industrial ecosystems.
In May 2025, Schneider Electric unveiled its latest industrial automation and electrification innovations at Hannover Messe. Key highlights included the AI-powered EcoStruxure Automation Expert platform and the Automation Copilot, developed with Microsoft, aimed at enhancing efficiency and flexibility. The company emphasized integrating automation, energy management, and digitalization to tackle rising energy costs and supply chain challenges.
Restraint
-
High Upfront Costs Hinder Adoption of Power Quality Measurement Equipment Among SMEs
The high capital investment is expected to be a key restraining factor in the power quality measurement equipment market. Many advanced systems have hefty upfront fees for purchase and installation as well as integration with our existing infrastructure. Especially for small and medium-sized enterprises (SMEs), these costs can be a relatively heavy burden, which, despite long-term advantages such as increased efficiency and less downtime, can make it difficult to justify the outlay. Along with this, continuous maintenance and the availability of skilled labor increase the total cost of ownership. This milestone financial barrier prevents adoption in many price-sensitive industries, which limits market growth potential. Cloud vendors and stakeholders need to think of affordable solutions, flexible financing, or government incentives to encourage broader adoption and fill the affordability gap for smaller organizations.
In February 2025, PW Consulting highlighted growing demand for power quality services in sectors like data centers, healthcare, and EV infrastructure, driven by the need for reliable power. However, high upfront costs and integration challenges limit adoption, especially among SMEs. In regions like India, financial constraints and poor infrastructure make it harder for SMEs to implement these solutions.
Power Quality Measurement Equipment Market Segmentation Outlook
By Type
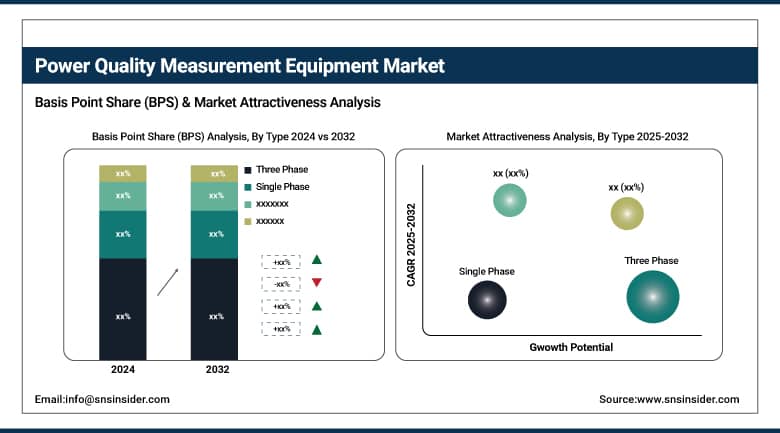
The three-phase segment dominated the market and accounted for 89.50% of the power quality measurement equipment market share. Three-phase power dominates in industrial, commercial, and large-scale infrastructure applications, where a balanced and stable power supply is vital for good practice operations. The combined voltage measurement in a three-phase system is complex, which means we need advanced measurement equipment to monitor voltage, current, and other power quality parameters accordingly. Three-phase measurement equipment is extensively used for this task, and Webber, with the strong demand for reliable and comprehensive power quality analysis offered by Three-phase measurement gear in these sectors, is the leader of this market.
The Single-Phase segment of the power quality measurement equipment market is recognized as the fastest-growing type. The growth of this segment is attributed to the widespread adoption of single-phase power systems in residential and small commercial applications, where cost efficiency and installation ease are most critical. In addition, the increasing demand for accurate measurement and control of power quality in these systems drives the requirement for single-phase measurement instruments. Compact, easy-to-use, and wireless technology features in equipment further propel the growth of this segment by bringing single-phase units into the hands of the most diverse group of end-users.
By End Use
The Industrial & Manufacturing segment holds a dominant position in the power quality measurement equipment market, accounting for 34.02% of the market share in 2024. This dominance is due to the critical need for reliable and efficient power systems to ensure continuous production processes. Voltage sags, surges, harmonics, and other power quality concerns can lead to massive downtime and destruction of delicate equipment. This incentivizes all industrial sectors to deploy advanced measurement equipment to measure and manage power quality so they can remain operationally stable and avoid expensive unplanned downtimes. It is the largest end-use category, driven by high energy use and strict quality demands for this segment.
The Commercial segment is recognized as the fastest-growing end-use category in the power quality measurement equipment market. The market for high-end electrical systems will continue to expand as businesses, from offices to shopping malls to data centers, increasingly depend on uninterrupted power supply and high-quality power distribution. Increasing energy efficiency coupled with smart grid penetration are contributing substantially to the development of new monitoring solutions. Moreover, commercial establishments are also required by regulatory bodies to monitor power consumption and minimize operating expenses, which propel them towards utilizing power quality measurement solutions to reduce energy consumption and avoid equipment failures.
By Equipment
The Uninterruptible Power Supply (UPS) segment dominated the market with a substantial 39.12% share as UPS systems provide backup power supply for critical equipment where an uninterrupted electricity supply is essential. They are used in industries, data centers, and healthcare facilities where seamless transfer of power is important to prevent data loss and damage to equipment and operations. Due to its efficiency, UPS is the number one player in this market.
Static VAR Compensators (SVCs) are essential for regulating voltage stability and improving power factors in electrical grids. They provide dynamic control of reactive power, thereby increasing systems' utilization and reducing losses. SVCs have a large industrial and utility following for power quality and voltage stability, especially on large power distribution networks where sensitive equipment can be affected by voltage fluctuations. They may not be the market leaders, but they play a crucial role in stabilizing power systems and, hence, find consistent demand and integration with the modern power grid.
Power Quality Measurement Equipment Market Regional Analysis
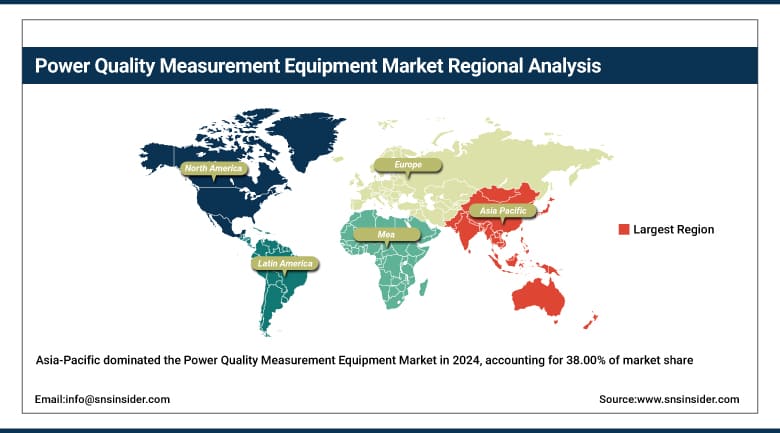
Asia-Pacific dominated the power quality measurement equipment market with a 38.00% share in 2024 and is the fastest-growing region. This growth is propelled by fast industrialization, urbanization, and growing energy production capacity. As electricity consumption rises, China, India, Japan, and South Korea are exporting mega-buck smart grid projects and power infrastructure upgrades to underpin demand. The increase in focus on enhancing power quality in order to minimize equipment malfunction and energy losses is one of the key factors driving the growth of the global power quality analyzer market. Moreover, government programs for renewable energy penetration and network modernization, and speedy regional consistent quality gear uptake.
China is the dominant country in the power quality measurement equipment market. This leadership is based on its fast-paced industrialization, development of large power infrastructure, and investments in smart grid technologies. Moreover, the emphasis of China on enhancing reliability and minimizing the downtime of power makes the nation one of the key markets for advanced power quality measurement solutions.
Get Customized Report as Per Your Business Requirement - Enquiry Now
Europe commands a significant share in the power quality measurement equipment market, driven by the region's focus on the integration of renewable energy sources and the deployment of smart grids The European Union (EU) is driving the implementation of advanced measurement tools through stringent regulations on power quality standards, energy efficiency, and sustainability initiatives. Germany, France, and the UK all have large and expensive programs to modernize power infrastructure and minimize downtime, and ensure grid stability. The significant amount of technological base in Europe and close collaboration between government and industry help in the innovation of such solutions, making Europe a key market for power quality solution providers.
North America holds a significant share in the power quality measurement equipment market due to its well-advanced industrial infrastructure, high rate of smart grid technologies adoption, and strict regulatory standards regarding power quality and reliability. Demand for accurate power quality measuring instruments is fueled by the region's aging electrical utilities and subsequent investments to upgrade power delivery systems. Furthermore, North America holds a significant market share with large-scale manufacturers and active research and development activities. The combination of these factors is keeping them growing and maintaining their competitive advantage in power quality monitoring solutions.
Key Players:
-
Siemens AG
-
Schneider Electric
-
General Electric Company
-
Emerson Electric Company
-
Toshiba Corporation
-
Fluke Corporation
-
Smiths Group plc.
-
A. Eberle GmbH & Co. KG
Recent Development
-
In February 2025: Eaton announced a $340 million investment to expand its transformer production in South Carolina. This expansion aims to meet the increasing demand for electrification and grid modernization, directly impacting the power quality equipment sector.
-
In January 2025: Toshiba Energy Systems & Solutions Corporation developed an intelligent electronic device (IED) compliant with the IEC 61850 standard. This device enhances monitoring and control systems for hydraulic turbine generators, contributing to improved power quality in hydroelectric power plants.
| Report Attributes | Details |
|---|---|
| Market Size in 2024 | USD 38.90 Billion |
| Market Size by 2032 | USD 49.34 Billion |
| CAGR | CAGR of 3.02% From 2025 to 2032 |
| Base Year | 2024 |
| Forecast Period | 2025-2032 |
| Historical Data | 2021-2023 |
| Report Scope & Coverage | Market Size, Segments Analysis, Competitive Landscape, Regional Analysis, DROC & SWOT Analysis, Forecast Outlook |
| Key Segments | • By Type (Single Phase, Three Phase) • By End Use (Industrial & Manufacturing, Commercial, Residential, Transportation, Utilities) • By Equipment (Uninterruptible Power Supply, Static VAR Compensator, Power Quality Meters) |
| Regional Analysis/Coverage | North America (US, Canada, Mexico), Europe (Germany, France, UK, Italy, Spain, Poland, Turkey, Rest of Europe), Asia Pacific (China, India, Japan, South Korea, Singapore, Australia, Rest of Asia Pacific), Middle East & Africa (UAE, Saudi Arabia, Qatar, South Africa, Rest of Middle East & Africa), Latin America (Brazil, Argentina, Rest of Latin America) |
| Company Profiles | ABB Ltd., Siemens AG, Schneider Electric, General Electric Company, Emerson Electric Company, Eaton Corporation Plc, Toshiba Corporation, Fluke Corporation, Smiths Group plc., A. Eberle GmbH & Co. KG |
Frequently Asked Questions
The Asia-Pacific region dominated the Power Quality Measurement Equipment market in 2024.
The “Three Phase” segment dominated the Power Quality Measurement Equipment market.
Rising industrial automation and electrification are driving critical demand for advanced power quality solutions to ensure reliable and efficient operations.
The Power Quality Measurement Equipment market was USD 38.90 billion in 2024 and is expected to reach USD 49.34 billion by 2032.
The Power Quality Measurement Equipment market is expected to grow at a CAGR of 3.02% from 2025-2032.
Get in Touch
