Radio Frequency Components Market Size Analysis:
The Radio Frequency Components Market was valued at USD 48.86 billion in 2025 and is expected to reach USD 174.05 billion by 2035, growing at a CAGR of 13.89% from 2026-2035.
Radio Frequency Components Market trends are increasing integration in 5G infrastructure, growing demand for IoT devices, advancements in GaN technology, miniaturization of components, and rising use in automotive and defense communication systems. The expansion of the Radio Frequency Components market can be attributed to the rapid implementation of 5G networks, rising requirement for smartphones, IoT gadgets, and associated wearables and increased investments in advanced wireless communication infrastructure.
Global smartphone shipments surpassed 1.3 billion units in 2024, driven by rising demand for advanced features including better connectivity and RF components
RF Components Market Size and Growth Projection
-
Market Size in 2025: USD 48.86 Billion
-
Market Size by 2035: USD 174.05 Billion
-
CAGR: 13.89% from 2026 to 2035
-
Base Year: 2025
-
Forecast Period: 2026–2035
-
Historical Data: 2022–2024

To Get more information On Radio Frequency Components Market - Request Free Sample Report
Radio Frequency Components Market Trends
-
Rising demand for high-speed wireless communication and 5G networks is driving the radio frequency (RF) components market.
-
Growing adoption across smartphones, IoT devices, automotive, and aerospace sectors is boosting market growth.
-
Expansion of MIMO, millimeter-wave, and high-frequency applications is fueling RF component deployment.
-
Increasing focus on miniaturization, power efficiency, and signal integrity is shaping adoption trends.
-
Advancements in RF filters, amplifiers, antennas, and transceivers are enhancing system performance and reliability.
-
Rising investments in telecom infrastructure, satellite communications, and defense electronics are supporting market expansion.
-
Collaborations between component manufacturers, OEMs, and network providers are accelerating innovation and global adoption.
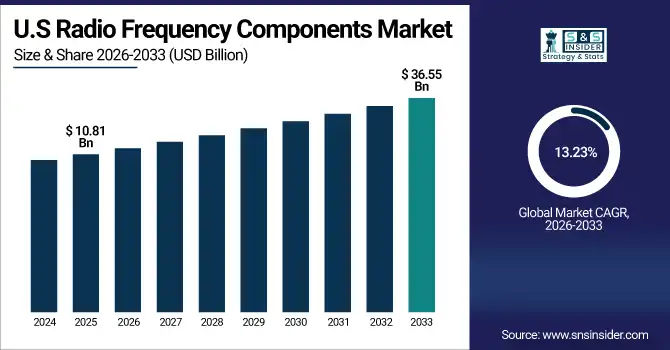
U.S. Radio Frequency Components Market Size Outlook
The U.S. Radio Frequency (RF) Components Market was valued at USD 10.81 billion in 2025 and is expected to reach USD 36.55 billion by 2035, growing at a CAGR of 13.23% from 2026-2035. The U.S. Radio Frequency Components Market growth is expanding driven by 5G deployments, increasing demand for high-end consumer electronics, higher defense spending, and technology innovations including GaN technology for high-performance applications.
Radio Frequency Components Market Growth Drivers:
-
Rapid 5G Rollout Smartphones IoT and GaN Technology Fuel Growth in Global RF Components Market
The global Radio Frequency (RF) Components market is being driven by several key market drivers such as rapid 5G network rollouts and of course deployment, which requires high-performance RF components to deliver higher data speeds and improved connectivity. With the increasing adoption of smartphones, IoT devices, and wearables, the demand for RF modules is also projected to grow, due to the need for compact, reliable, and efficient RF modules. Also, the rise in investment in automotive electronics, mainly in the field of connected as well as autonomous vehicles, is also fuelling the growth of the market. Emergence of technology advancement materials such as Gallium Nitride (GaN) increases power efficiency and enhances performance enabling quick market growth.
Over 340 5G networks were launched worldwide by the end of 2024, covering 55% of the global population, with projections to reach 85% by 2030
Radio Frequency Components Market Restraints:
-
Increasing RF System Complexity and Stringent Regulations Challenge Development Timelines and Manufacturing Efficiency
The growing complexity of RF system design requires highly specialized expertise and advanced manufacturing capabilities, placing a major restraint. As devices shrink and pack more features together, this complexity results in longer development lines and integration challenges, often at the worst possible time. Moreover, sharp regulatory requirements and standards of several nations can postpone product approvals and augment compliance burdens for the manufacturers.
Radio Frequency Components Market Opportunities:
-
Expanding Aerospace Defense and Miniaturization Trends Drive Global RF Components Market Growth Opportunities
Market opportunities are driven by the growing usage of RF components in the aerospace & defense sector for radar, navigation, and communication applications. The miniaturisation trend allows for the realisation of small, integrated devices for applications ranging from industrial automation to healthcare. This makes it the next big market in the world, with emerging economies investing in telecom infrastructure and smart city projects.
The integration of miniaturized RF components in medical devices has increased by over 30% in 2024, supporting wireless patient monitoring and telemedicine applications.
Radio Frequency Components Market Challenges:
-
Challenges in RF Components Market Stem from Raw Material Shortages Innovation Demands and Integration Issues
The systemic fragmentation of critical raw materials has created a second major challenge rising geopolitical tensions have exacerbated the availability of critical components, including Gallium Arsenide (GaAs) and Gallium Nitride (GaN). In addition, rapid changes in technology and an ongoing requirement for such innovation pushes companies to continually invest in R&D to remain competitive, which may be a barrier for smaller players. Lastly, integration issues related to emerging wireless technologies and legacy systems in multiple applications due to compatibility issues.
Radio Frequency Components Market Segmentation Analysis:
By Component Type
The Radio Frequency Components market was witnessed to be dominated by the filters segment in 2025, which had a notable share of 30.8%, owing to the importance of filters in providing signal clarity, reducing interference, and ensuring high performance of wireless communication systems. These chips are used extensively in 5G infrastructure, smartphones and IoT devices, and are critical to connect the devices to the high-speed mobile networks in an effective and reliable way. Strong demand for more advanced filtering technologies continues to solidify their market-leading position.
Antennas are projected to exhibit the highest growth throughout the forecast period from 2026 to 2035 owing to rising penetration of IoT and Boosted connected vehicle to everything (V2X), and next-generation wireless networks. Demand for innovative, compact, and high-performance antenna solutions is driven by the increasing adoption of smart devices and growing applications in automotive, aerospace, and industrial applications. The RF components market and antennas, in particular, will be one of the focus-opportunity areas as this acceleration takes place.
By Material
The Radio Frequency Components market is led by Gallium Arsenide (GaAs) with a 37.7% market share in 2025, as a result of its high electron mobility as well as its efficiency in high-frequency and high-speed applications. In fact, due to the high level of reliability and performance of RF components based on GaAs, this is the material of choice for most RF components heavily relied upon in smartphones, satellite communications, and radar systems. The dominance continues, supported by established manufacturing processes and proven performance.
Gallium nitride (Gan) is anticipated to grow at highest rate between 2026 and 2035. The inherent benefits of GaN, including enhanced power density, improved thermal conductivity, and increased efficiency, make it suitable for next-generation 5G networks, Defense radar systems, as well as power amplifiers. GaN technology continues to push innovation and greater application use-cases, as it represents a significant growth segment for the RF components market.
By Application
In 2025, Radio Frequency Components market in Consumer Electronics accounted for a dominant market share of 43.4%, due to high adoption of smart phones, tablets, laptops and wearables. This dominance can be attributed to the rising requirement of high-speed connectivity, along with small-sized, high-performance RF modules in these devices. Smartphone, tablet, personal laptop, and portable computer adoption coupled with ongoing consumer gadget innovation and IoT ecosystem expansion continue to drive demand for higher-performance RF components within this segment, securing its number one position in the market.
By Frequency Band
In 2025, High Frequency held the highest Radio Frequency Components market share of 31.3% attributed due to its significance in RF applications in advanced communication system, radar, and satellite systems. Because it provides higher data rates and larger transmission distances, It is the supported technology required for 5G as well as defence technologies. According to the report, high-frequency RF components are in demand across several domains because they provide reliable, high-performance wireless connectivity.

Radio Frequency (RF) Components Market Regional Outlook:
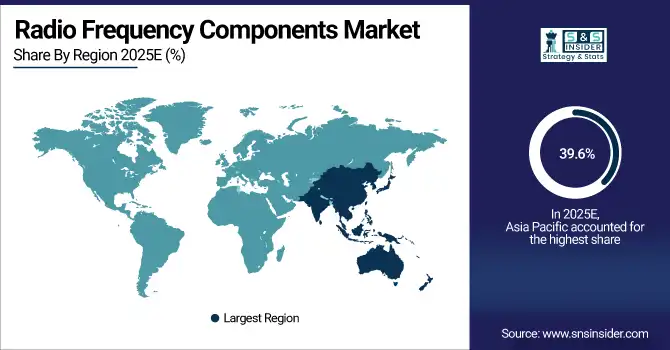
Asia Pacific Radio Frequency Components Market Insights
Asia Pacific held the largest share of Radio Frequency Components in 2025, accounting for 39.6%, due to high demand for consumer electronics, rapid deployment of 5G networks, and increased IoT and automotive applications. It is also the highest and fastest-growing RF components market in the world due to increasing telecom investments and technological advancements in the region.
Get Customized Report as per Your Business Requirement - Enquiry Now
China took over the Asia Pacific with smartphone production, 5G rollout, and semiconductor manufacturing.
North America Radio Frequency Components Market Insights
Strong investment in the 5G infrastructure market, aerospace, and automotive, and defense sectors position North America as a key region in Radio Frequency Components. Technological innovation, in addition to highly developed R&D capabilities and increasingly higher adoption of connected devices, is becoming the key driving the factors of this region. In North America, continuous government and private sector support for next-generation communication technologies, also propels the region's market growth.
the North American market is primarily driven by the United States which is a leader in 5G deployment, defence technology advancements and semiconductor innovations.
Europe Radio Frequency Components Market Insights
Europe plays a vital role in the Radio Frequency Components market owing to the rising Implementations of the 5G technology, increasing automotive electronics demand, and industrial automation. Anecdotal evidence shows that the combination of a strong focus on research and development, and a favourable regulatory environment, can support innovation in the manufacture of RF components. It also concentrates on sustainability and energy conservation, which further provides a tremendous impetus for the integration of RF components in smart cities and IoT applications across this region. This all leads to stable growth in the European market for RF components.
Middle East & Africa and Latin America Radio Frequency Components Market Insights
The Radio Frequency Components Market in Latin America and Middle East & Africa are steadily growing due to enhancement of telecom infrastructure and adoption of wireless technologies. The rollout of both 4G and 5G investments are driving the connectivity gap between urban and rural areas. Demand is increasing in both regions across sectors such as automotive, defense, and industrial automation. Even though these infrastructural and economic challenges are presenting hurdles, government initiatives in the form of smart city projects and digital transformation is presenting growth opportunities for the RF components market.
Radio Frequency Components Market Competitive Landscape:
Broadcom Inc.
Broadcom Inc. is a global technology leader providing semiconductor and infrastructure software solutions. Its RF front-end, Wi‑Fi, Bluetooth, and networking components serve mobile, data center, broadband, and enterprise markets. Broadcom specializes in high-performance wireless communication, connectivity silicon, and system-on-chip solutions. Its innovations in Wi‑Fi, RF front-end modules, and advanced semiconductor technology enable ultra-low latency, high-speed connectivity, and AI-ready infrastructure, supporting next-generation wireless and enterprise networking applications.
-
2025 – Broadcom unveiled the industry’s first Wi‑Fi 8 silicon ecosystem, advancing RF connectivity with ultra-low latency and higher speeds for next-gen wireless applications.
-
2024 – Broadcom launched Wi‑Fi 7 RF front-end modules using Tower Semiconductor RFSOI technology, improving mobile connectivity, efficiency, and performance for high-speed devices.
-
2023 – Broadcom introduced FiFEM RF front-end modules optimized for Wi‑Fi 7 access points, reducing power, cost, and enhancing 5/6 GHz band performance.
Qualcomm Incorporated
Qualcomm is a leading semiconductor and telecommunications company, renowned for its Snapdragon platforms, 5G modems, and RF front-end technologies. The company focuses on high-performance mobile, wearable, automotive, and IoT solutions, integrating optimized RF components to enhance connectivity, reduce power consumption, and minimize form factor. Qualcomm’s innovations in RF front ends, wireless SoCs, and advanced connectivity solutions support AI applications, next-gen mobile devices, and global wireless standards including Wi‑Fi, 5G, and ultra-low latency networks.
-
2025 – Qualcomm highlighted advanced RF front-end components in Snapdragon platforms, improving connectivity efficiency, power consumption, and miniaturization for wearable and connected devices.
Skyworks Solutions, Inc. & Qorvo
Skyworks Solutions and Qorvo are leading providers of RF, analog, and mixed-signal components, serving wireless communication, defense, and IoT markets. Skyworks specializes in high-performance RF front-end modules and antenna interface solutions, while Qorvo focuses on RF power amplifiers and connectivity ICs. Their combined expertise creates integrated solutions for Wi‑Fi, 5G, and IoT applications. Together, they aim to enhance wireless performance, range, and efficiency across consumer, industrial, and enterprise markets.
-
2025 – Skyworks and Qorvo announced a strategic combination, forming a $22B US-based leader in RF solutions, encompassing front-end, analog, and mixed-signal technologies.
-
2024 – Skyworks launched a new integrated RF front-end module family for Wi‑Fi, improving throughput, range, and simplifying connectivity design for modern devices.
Radio Frequency (RF) Components Companies are:
-
Qualcomm Incorporated
-
Murata Manufacturing Co., Ltd.
-
Qorvo, Inc.
-
NXP Semiconductors N.V.
-
Analog Devices, Inc.
-
Taiyo Yuden Co., Ltd.
-
Infineon Technologies AG
-
Cree, Inc. (Wolfspeed)
-
STMicroelectronics N.V.
-
Samsung Electro-Mechanics Co., Ltd.
-
Texas Instruments Incorporated
-
TDK Corporation
-
Renesas Electronics Corporation
-
Amphenol RF
-
Cobham Advanced Electronic Solutions
-
Richardson RFPD, Inc.
-
API Technologies Corp.
-
Mitsubishi Electric Corporation
| Report Attributes | Details |
|---|---|
| Market Size in 2025 | USD 48.86 Billion |
| Market Size by 2035 | USD 174.05 Billion |
| CAGR | CAGR of 13.89% From 2026 to 2035 |
| Base Year | 2025 |
| Forecast Period | 2026-2035 |
| Historical Data | 2022-2024 |
| Report Scope & Coverage | Market Size, Segments Analysis, Competitive Landscape, Regional Analysis, DROC & SWOT Analysis, Forecast Outlook |
| Key Segments | • By Component Type (Filters, Power Amplifiers, Duplexers, Antennas, Resonators, and Oscillators) • By Material (Gallium Arsenide (GaAs), Silicon, Gallium Nitride (GaN), Quartz, and Others) • By Application (Consumer Electronics, Automotive, Aerospace & Defense, Telecommunication, and Industrial Equipment) • By Frequency Band (Low Frequency, Medium Frequency, High Frequency, and Very High Frequency) |
| Regional Analysis/Coverage | North America (US, Canada, Mexico), Europe (Germany, France, UK, Italy, Spain, Poland, Turkey, Rest of Europe), Asia Pacific (China, India, Japan, South Korea, Singapore, Australia, Taiwan, Rest of Asia Pacific), Middle East & Africa (UAE, Saudi Arabia, Qatar, South Africa, Rest of Middle East & Africa), Latin America (Brazil, Argentina, Rest of Latin America) |
| Company Profiles | Broadcom Inc., Qualcomm Incorporated, Murata Manufacturing Co., Ltd., Qorvo, Inc., Skyworks Solutions, Inc., NXP Semiconductors N.V., Analog Devices, Inc., Taiyo Yuden Co., Ltd., Infineon Technologies AG, Cree, Inc. (Wolfspeed), STMicroelectronics N.V., Samsung Electro-Mechanics Co., Ltd., Texas Instruments Incorporated, TDK Corporation, Renesas Electronics Corporation, Amphenol RF, Cobham Advanced Electronic Solutions, Richardson RFPD, Inc., API Technologies Corp., Mitsubishi Electric Corporation. |
Frequently Asked Questions
Asia Pacific dominated the Radio Frequency Components Market in 2025.
Gallium Arsenide (GaAs) segment dominated the Radio Frequency Components Market.
The major growth factor driving the Radio Frequency Components Market is the rising adoption of 5G technology and advanced wireless communication devices.
The Radio Frequency Components Market was valued at USD 48.86 billion in 2025 and is expected to reach USD 174.05 billion by 2035.
The Radio Frequency Components Market is expected to grow at a CAGR of 13.89% from 2026-2035.
Get in Touch
