image

Resin Market Report Scope & Overview:

Resin-Market Revenue Analysis

Get PDF Sample Copy of Resin Market - Request Sample Report

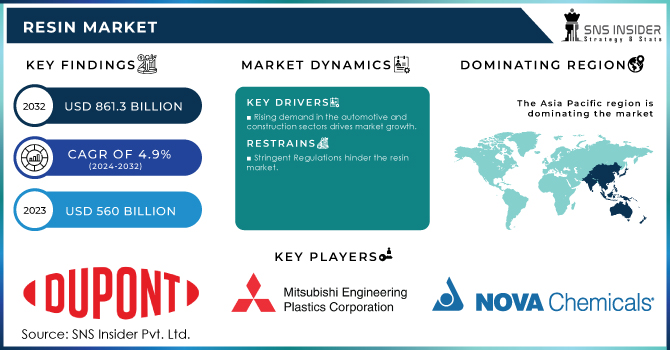
The Resin Market size was valued at USD 560 Billion in 2023. It is expected to grow to USD 861.3 Billion by 2032 and grow at a CAGR of 4.9% over the forecast period of 2024-2032.

Advancements in resin technology help to enhance product performance, and they become more and more suitable for use in high-performance applications. The constant development of resins may result in thermal stability improvements, chemical resistance, and greater mechanical strength, which are especially important for such sectors as aerospace, electronics, smart textile, and medical devices. Moreover, the development of 3D print technologies has boosted the creation of resins with special properties: they cure faster and are used to produce goods in the healthcare industry (e.g., prosthetics), automotive industry (prototypes), and consumer goods.

However, according to the U.S. Department of Energy, the use of advanced materials, which also refer to high-performance resins, is vital for enhancing energy efficiency and reducing negative environmental impact. For example, by 2030, the U.S. government plans to reduce energy use in manufacturing by 25%. This will be achieved by the numerous energy-saving innovations, which involve materials like advanced resins, that enable greater durability and performance of final products.

Resins play a vital role in the electronics industry. They are widely used for the encapsulation and insulation of electronic components, where high thermal conductivity and electrical insulation play an important role. The enlargement of the global market for consumer electronics and smart devices contributes to the increased demand for resins that are durable, flexible, and lightweight. It is relevant to wearable electronics, including fitness trackers and smartwatches, but it is also applicable to consumer electronics such as smartphones and home appliances. In this case, the peculiar characteristics of the identified type of polymer allow promoting the work of modern devices and extending its lifespan.

According to the U.S. International Trade Commission, the demand for advanced materials, which include one of the specialized resins, is related to the increasing use of electronic devices in the United States. Electronics and other end products together form 29% of the total electronic component market, and this trend suggests the necessity for developing and applying more advanced forms of resins that meet new challenges of insulation and durability.

Drivers

Rising demand in the automotive and construction sectors drives market growth.

The resin market has been experiencing remarkable growth in the automotive and the construction industry. In the automotive industry, demand for resins has been on the rise due to the lightweight and durable properties of most resins. These generally translate to higher fuel efficiencies and a corresponding increase in the performance of the vehicle. In addition, the shift of manufacturers from petroleum vehicles to electric vehicles has led to an increase in the demand for new advanced materials among them resins that could stand high temperatures and act as isolators for the electrical components of the vehicle. Concerning this development, both resins and plastics have been experiencing high demand in the automotive industry. In the construction industry, demand for resins has also been high as resins are used to develop adhesives, coatings, and composites that could increase the durability and resistance of the structures to environmental effects that compromise the structure of buildings.

Furthermore, as the demand for resin grows, they will be particularly needed in developing urbanization and the growth of infrastructures in the developed markets which would stimulate increased demand for resins in the construction industry. According to the U.S. Department of Energy, high-performance resins and other advanced materials are crucial to the reduction of energy consumption in both the automotive and construction sectors. The department adds that the use of lightweight materials such as resins in vehicles would lower vehicle energy use by 5 to 6% by national goals concerning the energy efficiency of vehicles.

Restraint

  • Stringent Regulations hinder the resin market

The Environmental Protection Agency (EPA), the Occupational Safety and Health Administration (OSHA), and the Consumer Product Safety Commission (CPSC) are other government entities that regulate the usage of resins. These organizations implement resin-use laws to protect human health and the environment. These government bodies' requirements might make it more difficult and expensive for resin manufacturers to promote their goods. This may result in a fall in resin demand and a slowing in resin market growth.

Opportunities

Rapid Growth in the packaging industry

The packaging industry's rapid growth, as well as rising demand for packaging solutions from the food and beverage, consumer goods, pharmaceutical, and e-commerce industries, will provide profitable prospects for the market. Plastics are widely utilized in the packaging of various items in the form of films, corrugated boxes, poly bags, foil-sealed bags, trays, and rigid boxes. Electrical and electrical industries, as well as pharmaceutical producers, have advanced the plastic packaging business. Furthermore, flexible packaging is favored by food and beverage makers, which enhances the packaging solutions industry and influences plastic demand growth.

Market segmentation

By Type

Polyethylene (PE) held the largest market share around 22% in 2023. It is the most commonly used thermoplastic resin in the resin market due to its toughness, chemical resistance, and ease of processing. It is applied in the manufacture of both flexible and rigid packaging materials across the globe and is tough and economical. Notably, in the packaging industry, the resin is used to develop plastic bags, containers, and films due to its excellent barrier properties. It is also highly valued in the construction and automotive industry because of its lightweight and tough nature.

Therefore, in the construction industry, the material is used for pipes and insulation, while in the automobile industry, it is used to develop body panels and other components. Its low cost and wide availability as compared to other resins used across the world make it superior. It is also efficient due to its recyclability nature and resilience in ecologically diverse environments. According to the U.S. Environmental Protection Agency, polyethylene is one of the most recycled plastics and accounts for more than 34% of the plastic recycling stream.

Moreover, Polyurethane resin is the fastest-growing segment in the resin market. Polyurethane resin is an elastic and flexible resin that is often used in foams, cushions, and seals. Other Epoxy resin, Silicone resin, and acrylic resins are used in adhesives, coatings, manufacture of lenses, windows, gaskets, seals, and molds.

By End-Use

The packaging segment accounted for the largest share around 24% in 2023. and it is expected to maintain its lead throughout the forecast period. The increasing requirement for proper packaging solutions from several industries such as consumer goods, food & beverage, electrical & electronics, and construction is driving the growth of this segment. Moreover, growing consumption of frozen and ready-to-eat foods is also supporting the growth of this segment.

The building & construction segment also holds a significant share of the market in 2023. The growth of the segment can be ascribed to the increasing urbanization and infrastructural developments in the developing nations, and the renovation of the existing and old constructions. Resins are used to manufacture several construction & building products that consist of flooring, countertops, roofing, pipes & fittings, coatings, and adhesives.

The growth of the automotive & transportation segment is due to the increasing usage of plastics in automobiles. It is possible to substitute vehicle metal parts & components with plastics as they are lighter in weight and possess similar physical properties.

Regional Analysis

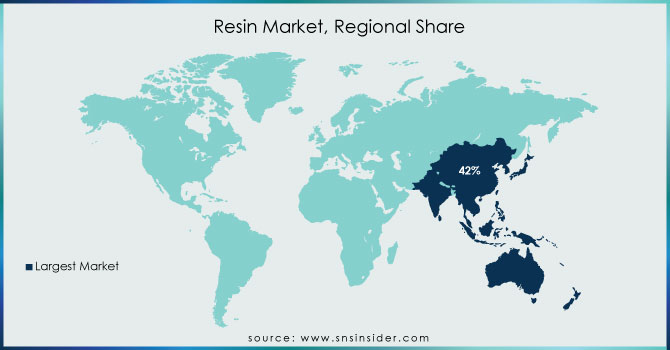
The Asia Pacific region held the highest market share around 42% in 2023 in the resin market. It is expanding due to rising demand for resins in the automotive, construction, and packaging industries. The demand is due to the presence of major resin producers, exporters, and consumers in countries like China and India. China is a big producer of electronics such as televisions, laptop computers, and smartphones.

According to the Ministry of Economy, Trade, and Industry (METI) in Japan, the region’s resin production capacity has significantly increased, with China alone accounting for over 30% of the global production of plastic resins, including polyethylene, in recent years. This extensive production capacity supports the Asia-Pacific's dominance in the market, as regional manufacturers can meet local and global demand efficiently, contributing to the region's leading market share.

The rising demand for packages from the food and beverage and cosmetics industries is expected to drive the North American industry. The region is expected to increase significantly due to rising demand for packaging materials, consumer goods, electronic gadgets, and other products. This rising packaging requirement will create new opportunities for North American end products.

Europe is mostly expanding due to increased plastic usage in the automotive industry. Because of their features such as electrical insulation, corrosion suppression, and other aspects, plastics are employed in automobiles. Furthermore, car pollution rules have encouraged automakers to increase the amount of plastic in their vehicles, supporting market development.

Latin America is expected to rise significantly as a result of increased investments, pharmaceutical disposal income, and new infrastructure initiatives. Packaging demand from textile and beverage applications influences the Middle East and Africa.

Resin-Market-Regional-Share

Get Customised Report as per Your Business Requirement - Enquiry Now

Key Players

  • Dupont (Delrin Acetal Resin)

  • Mitsubishi Engineering-Plastics Corporation (Novarex Polycarbonate Resin)

  • Nova Chemicals (SCLAIR Polyethylene Resin)

  • Arkema (Rilsan Polyamide Resin)

  • BASF SE (Ultrason Polysulfone Resin)

  • LyondellBasell (Purell Polypropylene Resin)

  • INEOS Holdings Ltd. (Eltex Polyethylene Resin)

  • Qenos (Alkathene LDPE Resin)

  • Hexion (Epon Epoxy Resin)

  • Invista (Rynite PET Resin)

  • Dow Chemical Company (VERSIFY Elastomer Resin)

  • SABIC (Lexan Polycarbonate Resin)

  • Sumitomo Chemical (Evolue Polyethylene Resin)

  • ExxonMobil Chemical (Exceed XP Polyethylene Resin)

  • Celanese Corporation (Celcon Acetal Copolymer Resin)

  • Solvay (Radel Polyphenylsulfone Resin)

  • Evonik Industries (VESTAMID Polyamide Resin)

  • Teijin Limited (Panlite Polycarbonate Resin)

  • Toray Industries (Amilan Polyamide Resin)

  • Formosa Plastics Corporation (Formolene Polyethylene Resin)

Recent Development:

  • In 2023 INEOS Solution commercialized K-Resins KR21 by  Asian household appliance makers, specifically refrigerator-in liners

  • In 2023 Sabic promote bio-based variants of all NORYL resin grades to promote the bio-economy of plastics

  • In 2023 BASF Shanghai Coatings, as well as the resin facility of BASF Coatings in Caojing, Shanghai, all declared their intention to use 100% renewable energy and begin operations

Resin Market Report Scope:
Report Attributes Details

Market Size in 2023

 US$ 560 Billion

Market Size by 2032

 US$ 861.32 Billion

CAGR 

 CAGR of 4.90% From 2024 to 2032

Base Year

2023

Forecast Period

 2024-2032

Historical Data

 2020-2022

Report Scope & Coverage

Market Size, Segments Analysis, Competitive  Landscape, Regional Analysis, DROC & SWOT Analysis, Forecast Outlook

Key Segments

• By Type (Polypropylene, Polystyrene, Polyvinyl chloride, Polyurethane, Acrylonitrile, Polyethylene terephthalate, Polyamide, Polyethylene, polycarbonate)
• By End-use industry (Automotive & Transportation, Consumer goods/lifestyle, Building & Construction, Electrical & electronics, Packaging, Agriculture, other)

Regional Analysis/Coverage

North America (US, Canada, Mexico), Europe (Eastern Europe [Poland, Romania, Hungary, Turkey, Rest of Eastern Europe] Western Europe] Germany, France, UK, Italy, Spain, Netherlands, Switzerland, Austria, Rest of Western Europe]), Asia Pacific (China, India, Japan, South Korea, Vietnam, Singapore, Australia, Rest of Asia Pacific), Middle East & Africa (Middle East [UAE, Egypt, Saudi Arabia, Qatar, Rest of Middle East], Africa [Nigeria, South Africa, Rest of Africa], Latin America (Brazil, Argentina, Colombia Rest of Latin America)

Company Profiles

Dupont, Mitsubishi Engineering-Plastics corporation, Nova Chemicals, Arkema, BASF SE, LynondellBasell, INEOS Holdings Ltd., Qenos, Hexion, Invista

Key Drivers

• Growing demand from end-use industries
• Applications of different types of resins

Market Opportunity

• Rapid Growth in the packaging industry


Frequently Asked Questions

Ans. USD 821.09 billion is the projected Resin Market size of the market by 2031.

Ans. USD 560 billion is the market size of the Resin Market in 2023.

Ans. The CAGR of the Resin Market over the forecast period is 4.9%.

Ans. Asia Pacific is the fastest-growing region of the Resin Market in 2023.

Ans. Drivers are Growing demand from end-use industries and applications of different types of resins

Table of Content

1. Introduction

1.1 Market Definition

1.2 Scope (Inclusion and Exclusions)

1.3 Research Assumptions

2. Executive Summary

2.1 Market Overview

2.2 Regional Synopsis

2.3 Competitive Summary

3. Research Methodology

3.1 Top-Down Approach

3.2 Bottom-up Approach

3.3. Data Validation

3.4 Primary Interviews

4. Market Dynamics Impact Analysis

3.1 Market Driving Factors Analysis

3.1.2 Drivers

3.1.2 Restraints

3.1.3 Opportunities

3.1.4 Challenges

3.2 PESTLE Analysis

3.3 Porter’s Five Forces Model

5. Statistical Insights and Trends Reporting

5.1 Production Capacity and Utilization, by Country, by Type, 2023

5.2 Feedstock Prices, by Country, by Type, 2023

5.3 Regulatory Impact, by l Country, by Type, 2023.

5.4 Environmental Metrics: Emissions Data, Waste Management Practices, and     Sustainability Initiatives, by Region

5.5 Innovation and R&D, by Type, 2023

6. Competitive Landscape

6.1 List of Major Companies, By Region

6.2 Market Share Analysis, By Region

6.3 Product Benchmarking

6.3.1 Product specifications and features

6.3.2 Pricing

6.4 Strategic Initiatives

6.4.1 Marketing and promotional activities

6.4.2 Distribution and supply chain strategies

6.4.3 Expansion plans and new Product launches

6.4.4 Strategic partnerships and collaborations

6.5 Technological Advancements

6.6 Market Positioning and Branding

7. Resin Market Segmentation, by Type

7.1 Chapter Overview

7.2 Polypropylene

        7.2.1 Polypropylene Market Trends Analysis (2020-2032)

7.2.2 Polypropylene Market Size Estimates and Forecasts to 2032 (USD Billion)

7.3 Polystyrene

       7.3.1 Polystyrene Market Trends Analysis (2020-2032)

       7.3.2 Polystyrene Market Size Estimates and Forecasts to 2032 (USD Billion)

7.4 Polyvinyl chloride

       7.4.1 Polyvinyl chloride Market Trends Analysis (2020-2032)

       7.4.2 Polyvinyl chloride Market Size Estimates and Forecasts to 2032 (USD Billion)

7.5 Polyurethane

        7.5.1 Polyurethane Market Trends Analysis (2020-2032)

7.5.2 Polyurethane Market Size Estimates and Forecasts to 2032 (USD Billion)

7.6 Acrylonitrile

       7.6.1 Acrylonitrile Market Trends Analysis (2020-2032)

       7.6.2 Acrylonitrile Market Size Estimates and Forecasts to 2032 (USD Billion)

7.7 Polyethylene terephthalate

       7.7.1 Polyethylene terephthalate Market Trends Analysis (2020-2032)

       7.7.2 Polyethylene terephthalate Market Size Estimates and Forecasts to 2032 (USD Billion)

7.8 Polyamide     

       7.8.1 Polyamide Market Trends Analysis (2020-2032)

       7.8.2 Polyamide Market Size Estimates and Forecasts to 2032 (USD Billion)

7.9 Polyethylene

       7.9.1 Polyethylene Market Trends Analysis (2020-2032)

       7.9.2 Polyethylene Market Size Estimates and Forecasts to 2032 (USD Billion)

7.10 Polycarbonate

       7.10.1 Polycarbonate Market Trends Analysis (2020-2032)

       7.10.2 Polycarbonate Market Size Estimates and Forecasts to 2032 (USD Billion)

8. Resin Market Segmentation, by End-Use

8.1 Chapter Overview

8.2 Automotive & Transportation

        8.2.1 Automotive & Transportation Market Trends Analysis (2020-2032)

8.2.2 Automotive & Transportation Market Size Estimates and Forecasts to 2032 (USD Billion)

8.3 Consumer goods/lifestyle

       8.3.1 Consumer goods/lifestyle Market Trends Analysis (2020-2032)

8.3.2 Consumer goods/lifestyle Market Size Estimates and Forecasts to 2032 (USD Billion)

8.4 Building & Construction

        8.4.1 Building & Construction Market Trends Analysis (2020-2032)

8.4.2 Building & Construction Market Size Estimates and Forecasts to 2032 (USD Billion)

8.5 Electrical & electronics

        8.5.1 Electrical & electronics Market Trends Analysis (2020-2032)

8.5.2 Electrical & electronics Market Size Estimates and Forecasts to 2032 (USD Billion)

8.6 Packaging

       8.6.1 Packaging Market Trends Analysis (2020-2032)

8.6.2 Packaging Market Size Estimates and Forecasts to 2032 (USD Billion)

8.7 Agriculture

        8.7.1 Agriculture Market Trends Analysis (2020-2032)

8.7.2 Agriculture Market Size Estimates and Forecasts to 2032 (USD Billion)

8.8 Others

        8.8.1 Others Market Trends Analysis (2020-2032)

8.8.2 Others Market Size Estimates and Forecasts to 2032 (USD Billion)

9. Regional Analysis

9.1 Chapter Overview

9.2 North America

9.2.1 Trends Analysis

9.2.2 North America Resin Market Estimates and Forecasts, by Country (2020-2032) (USD Billion)

9.2.3 North America Resin Market Estimates and Forecasts, by Type (2020-2032) (USD Billion)  

9.2.4 North America Resin Market Estimates and Forecasts, by Application (2020-2032) (USD Billion)

9.2.5 USA

9.2.5.1 USA Resin Market Estimates and Forecasts, by Type (2020-2032) (USD Billion)

9.2.5.2 USA Resin Market Estimates and Forecasts, by Application (2020-2032) (USD Billion)

9.2.6 Canada

9.2.6.1 Canada Resin Market Estimates and Forecasts, by Type (2020-2032) (USD Billion)

9.2.6.2 Canada Resin Market Estimates and Forecasts, by Application (2020-2032) (USD Billion)

9.2.7 Mexico

9.2.7.1 Mexico Resin Market Estimates and Forecasts, by Type (2020-2032) (USD Billion)

9.2.7.2 Mexico Resin Market Estimates and Forecasts, by Application (2020-2032) (USD Billion)

9.3 Europe

9.3.1 Eastern Europe

9.3.1.1 Trends Analysis

9.3.1.2 Eastern Europe Resin Market Estimates and Forecasts, by Country (2020-2032) (USD Billion)

9.3.1.3 Eastern Europe Resin Market Estimates and Forecasts, by Type (2020-2032) (USD Billion)  

9.3.1.4 Eastern Europe Resin Market Estimates and Forecasts, by Application (2020-2032) (USD Billion)

9.3.1.5 Poland

9.3.1.5.1 Poland Resin Market Estimates and Forecasts, by Type (2020-2032) (USD Billion)

9.3.1.5.2 Poland Resin Market Estimates and Forecasts, by Application (2020-2032) (USD Billion)

9.3.1.6 Romania

9.3.1.6.1 Romania Resin Market Estimates and Forecasts, by Type (2020-2032) (USD Billion)

9.3.1.6.2 Romania Resin Market Estimates and Forecasts, by Application (2020-2032) (USD Billion)

9.3.1.7 Hungary

9.3.1.7.1 Hungary Resin Market Estimates and Forecasts, by Type (2020-2032) (USD Billion)

9.3.1.7.2 Hungary Resin Market Estimates and Forecasts, by Application (2020-2032) (USD Billion)

9.3.1.8 Turkey

9.3.1.8.1 Turkey Resin Market Estimates and Forecasts, by Type (2020-2032) (USD Billion)

9.3.1.8.2 Turkey Resin Market Estimates and Forecasts, by Application (2020-2032) (USD Billion)

9.3.1.9 Rest of Eastern Europe

9.3.1.9.1 Rest of Eastern Europe Resin Market Estimates and Forecasts, by Type (2020-2032) (USD Billion)

9.3.1.9.2 Rest of Eastern Europe Resin Market Estimates and Forecasts, by Application (2020-2032) (USD Billion)

9.3.2 Western Europe

9.3.2.1 Trends Analysis

9.3.2.2 Western Europe Resin Market Estimates and Forecasts, by Country (2020-2032) (USD Billion)

9.3.2.3 Western Europe Resin Market Estimates and Forecasts, by Type (2020-2032) (USD Billion)  

9.3.2.4 Western Europe Resin Market Estimates and Forecasts, by Application (2020-2032) (USD Billion)

9.3.2.5 Germany

9.3.2.5.1 Germany Resin Market Estimates and Forecasts, by Type (2020-2032) (USD Billion)

9.3.2.5.2 Germany Resin Market Estimates and Forecasts, by Application (2020-2032) (USD Billion)

9.3.2.6 France

9.3.2.6.1 France Resin Market Estimates and Forecasts, by Type (2020-2032) (USD Billion)

9.3.2.6.2 France Resin Market Estimates and Forecasts, by Application (2020-2032) (USD Billion)

9.3.2.7 UK

9.3.2.7.1 UK Resin Market Estimates and Forecasts, by Type (2020-2032) (USD Billion)

9.3.2.7.2 UK Resin Market Estimates and Forecasts, by Application (2020-2032) (USD Billion)

9.3.2.8 Italy

9.3.2.8.1 Italy Resin Market Estimates and Forecasts, by Type (2020-2032) (USD Billion)

9.3.2.8.2 Italy Resin Market Estimates and Forecasts, by Application (2020-2032) (USD Billion)

9.3.2.9 Spain

9.3.2.9.1 Spain Resin Market Estimates and Forecasts, by Type (2020-2032) (USD Billion)

9.3.2.9.2 Spain Resin Market Estimates and Forecasts, by Application (2020-2032) (USD Billion)

9.3.2.10 Netherlands

9.3.2.10.1 Netherlands Resin Market Estimates and Forecasts, by Type (2020-2032) (USD Billion)

9.3.2.10.2 Netherlands Resin Market Estimates and Forecasts, by Application (2020-2032) (USD Billion)

9.3.2.11 Switzerland

9.3.2.11.1 Switzerland Resin Market Estimates and Forecasts, by Type (2020-2032) (USD Billion)

9.3.2.11.2 Switzerland Resin Market Estimates and Forecasts, by Application (2020-2032) (USD Billion)

9.3.2.12 Austria

9.3.2.12.1 Austria Resin Market Estimates and Forecasts, by Type (2020-2032) (USD Billion)

9.3.2.12.2 Austria Resin Market Estimates and Forecasts, by Application (2020-2032) (USD Billion)

9.3.2.13 Rest of Western Europe

9.3.2.13.1 Rest of Western Europe Resin Market Estimates and Forecasts, by Type (2020-2032) (USD Billion)

9.3.2.13.2 Rest of Western Europe Resin Market Estimates and Forecasts, by Application (2020-2032) (USD Billion)

9.4 Asia Pacific

9.4.1 Trends Analysis

9.4.2 Asia Pacific Resin Market Estimates and Forecasts, by Country (2020-2032) (USD Billion)

9.4.3 Asia Pacific Resin Market Estimates and Forecasts, by Type (2020-2032) (USD Billion)  

9.4.4 Asia Pacific Resin Market Estimates and Forecasts, by Application (2020-2032) (USD Billion)

9.4.5 China

9.4.5.1 China Resin Market Estimates and Forecasts, by Type (2020-2032) (USD Billion)

9.4.5.2 China Resin Market Estimates and Forecasts, by Application (2020-2032) (USD Billion)

9.4.6 India

9.4.5.1 India Resin Market Estimates and Forecasts, by Type (2020-2032) (USD Billion)

9.4.5.2 India Resin Market Estimates and Forecasts, by Application (2020-2032) (USD Billion)

9.4.5 Japan

9.4.5.1 Japan Resin Market Estimates and Forecasts, by Type (2020-2032) (USD Billion)

9.4.5.2 Japan Resin Market Estimates and Forecasts, by Application (2020-2032) (USD Billion)

9.4.6 South Korea

9.4.6.1 South Korea Resin Market Estimates and Forecasts, by Type (2020-2032) (USD Billion)

9.4.6.2 South Korea Resin Market Estimates and Forecasts, by Application (2020-2032) (USD Billion)

9.4.7 Vietnam

9.4.7.1 Vietnam Resin Market Estimates and Forecasts, by Type (2020-2032) (USD Billion)

9.2.7.2 Vietnam Resin Market Estimates and Forecasts, by Application (2020-2032) (USD Billion)

9.4.8 Singapore

9.4.8.1 Singapore Resin Market Estimates and Forecasts, by Type (2020-2032) (USD Billion)

9.4.8.2 Singapore Resin Market Estimates and Forecasts, by Application (2020-2032) (USD Billion)

9.4.9 Australia

9.4.9.1 Australia Resin Market Estimates and Forecasts, by Type (2020-2032) (USD Billion)

9.4.9.2 Australia Resin Market Estimates and Forecasts, by Application (2020-2032) (USD Billion)

9.4.10 Rest of Asia Pacific

9.4.10.1 Rest of Asia Pacific Resin Market Estimates and Forecasts, by Type (2020-2032) (USD Billion)

9.4.10.2 Rest of Asia Pacific Resin Market Estimates and Forecasts, by Application (2020-2032) (USD Billion)

9.5 Middle East and Africa

9.5.1 Middle East

9.5.1.1 Trends Analysis

9.5.1.2 Middle East Resin Market Estimates and Forecasts, by Country (2020-2032) (USD Billion)

9.5.1.3 Middle East Resin Market Estimates and Forecasts, by Type (2020-2032) (USD Billion)  

9.5.1.4 Middle East Resin Market Estimates and Forecasts, by Application (2020-2032) (USD Billion)

9.5.1.5 UAE

9.5.1.5.1 UAE Resin Market Estimates and Forecasts, by Type (2020-2032) (USD Billion)

9.5.1.5.2 UAE Resin Market Estimates and Forecasts, by Application (2020-2032) (USD Billion)

9.5.1.6 Egypt

9.5.1.6.1 Egypt Resin Market Estimates and Forecasts, by Type (2020-2032) (USD Billion)

9.5.1.6.2 Egypt Resin Market Estimates and Forecasts, by Application (2020-2032) (USD Billion)

9.5.1.7 Saudi Arabia

9.5.1.7.1 Saudi Arabia Resin Market Estimates and Forecasts, by Type (2020-2032) (USD Billion)

9.5.1.7.2 Saudi Arabia Resin Market Estimates and Forecasts, by Application (2020-2032) (USD Billion)

9.5.1.8 Qatar

9.5.1.8.1 Qatar Resin Market Estimates and Forecasts, by Type (2020-2032) (USD Billion)

9.5.1.8.2 Qatar Resin Market Estimates and Forecasts, by Application (2020-2032) (USD Billion)

9.5.1.9 Rest of Middle East

9.5.1.9.1 Rest of Middle East Resin Market Estimates and Forecasts, by Type (2020-2032) (USD Billion)

9.5.1.9.2 Rest of Middle East Resin Market Estimates and Forecasts, by Application (2020-2032) (USD Billion)

9.5.2 Africa

9.5.2.1 Trends Analysis

9.5.2.2 Africa Resin Market Estimates and Forecasts, by Country (2020-2032) (USD Billion)

9.5.2.3 Africa Resin Market Estimates and Forecasts, by Type (2020-2032) (USD Billion)  

9.5.2.4 Africa Resin Market Estimates and Forecasts, by Application (2020-2032) (USD Billion)

9.5.2.5 South Africa

9.5.2.5.1 South Africa Resin Market Estimates and Forecasts, by Type (2020-2032) (USD Billion)

9.5.2.5.2 South Africa Resin Market Estimates and Forecasts, by Application (2020-2032) (USD Billion)

9.5.2.6 Nigeria

9.5.2.6.1 Nigeria Resin Market Estimates and Forecasts, by Type (2020-2032) (USD Billion)

9.5.2.6.2 Nigeria Resin Market Estimates and Forecasts, by Application (2020-2032) (USD Billion)

9.6 Latin America

9.6.1 Trends Analysis

9.6.2 Latin America Resin Market Estimates and Forecasts, by Country (2020-2032) (USD Billion)

9.6.3 Latin America Resin Market Estimates and Forecasts, by Type (2020-2032) (USD Billion)  

9.6.4 Latin America Resin Market Estimates and Forecasts, by Application (2020-2032) (USD Billion)

9.6.5 Brazil

9.6.5.1 Brazil Resin Market Estimates and Forecasts, by Type (2020-2032) (USD Billion)

9.6.5.2 Brazil Resin Market Estimates and Forecasts, by Application (2020-2032) (USD Billion)

9.6.6 Argentina

9.6.6.1 Argentina Resin Market Estimates and Forecasts, by Type (2020-2032) (USD Billion)

9.6.6.2 Argentina Resin Market Estimates and Forecasts, by Application (2020-2032) (USD Billion)

9.6.7 Colombia

9.6.7.1 Colombia Resin Market Estimates and Forecasts, by Type (2020-2032) (USD Billion)

9.6.7.2 Colombia Resin Market Estimates and Forecasts, by Application (2020-2032) (USD Billion)

9.6.8 Rest of Latin America

9.6.8.1 Rest of Latin America Resin Market Estimates and Forecasts, by Type (2020-2032) (USD Billion)

9.6.8.2 Rest of Latin America Resin Market Estimates and Forecasts, by Application (2020-2032) (USD Billion)

10. Company Profiles

           10.1 Dupont

                          10.1.1 Company Overview

10.1.2 Financial

10.1.3 Product / Services Offered

10.1.4 SWOT Analysis

           10.2   Mitsubishi Engineering-Plastics corporation

                           10.2.1 Company Overview

10.2.2 Financial

10.2.3 Product / Services Offered

10.2.4 SWOT Analysis

10.3 Nova Chemicals

              10.3.1 Company Overview

10.3.2 Financial

10.3.3 Product / Services Offered

10.3.4 SWOT Analysis

10.4 Arkema

             10.4.1 Company Overview

10.4.2 Financial

10.4.3 Product / Services Offered

10.4.4 SWOT Analysis

10.5 BASF SE

             10.5.1 Company Overview

10.5.2 Financial

10.5.3 Product / Services Offered

10.5.4 SWOT Analysis

10.6 LynondellBasell

             10.6.1 Company Overview

10.6.2 Financial

10.6.3 Product / Services Offered

10.6.4 SWOT Analysis

10.7 INEOS Holdings Ltd.

             10.7.1 Company Overview

10.7.2 Financial

10.7.3 Product / Services Offered

10.7.4 SWOT Analysis

10.8 Qenos

             10.8.1 Company Overview

10.8.2 Financial

10.8.3 Product / Services Offered

10.8.4 SWOT Analysis

10.9 Hexion

             10.9.1 Company Overview

10.9.2 Financial

10.9.3 Product / Services Offered

10.9.4 SWOT Analysis

10.10 Invista

             10.10.1 Company Overview

10.10.2 Financial

10.10.3 Product / Services Offered

10.10.4 SWOT Analysis

11. Use Cases and Best Practices

12. Conclusion

An accurate research report requires proper strategizing as well as implementation. There are multiple factors involved in the completion of good and accurate research report and selecting the best methodology to compete the research is the toughest part. Since the research reports we provide play a crucial role in any company’s decision-making process, therefore we at SNS Insider always believe that we should choose the best method which gives us results closer to reality. This allows us to reach at a stage wherein we can provide our clients best and accurate investment to output ratio.

Each report that we prepare takes a timeframe of 350-400 business hours for production. Starting from the selection of titles through a couple of in-depth brain storming session to the final QC process before uploading our titles on our website we dedicate around 350 working hours. The titles are selected based on their current market cap and the foreseen CAGR and growth.


The 5 steps process:

Step 1: Secondary Research:

Secondary Research or Desk Research is as the name suggests is a research process wherein, we collect data through the readily available information. In this process we use various paid and unpaid databases which our team has access to and gather data through the same. This includes examining of listed companies’ annual reports, Journals, SEC filling etc. Apart from this our team has access to various associations across the globe across different industries. Lastly, we have exchange relationships with various university as well as individual libraries.

Secondary Research

Step 2: Primary Research

When we talk about primary research, it is a type of study in which the researchers collect relevant data samples directly, rather than relying on previously collected data.  This type of research is focused on gaining content specific facts that can be sued to solve specific problems. Since the collected data is fresh and first hand therefore it makes the study more accurate and genuine.

We at SNS Insider have divided Primary Research into 2 parts.

Part 1 wherein we interview the KOLs of major players as well as the upcoming ones across various geographic regions. This allows us to have their view over the market scenario and acts as an important tool to come closer to the accurate market numbers. As many as 45 paid and unpaid primary interviews are taken from both the demand and supply side of the industry to make sure we land at an accurate judgement and analysis of the market.

This step involves the triangulation of data wherein our team analyses the interview transcripts, online survey responses and observation of on filed participants. The below mentioned chart should give a better understanding of the part 1 of the primary interview.

Primary Research

Part 2: In this part of primary research the data collected via secondary research and the part 1 of the primary research is validated with the interviews from individual consultants and subject matter experts.

Consultants are those set of people who have at least 12 years of experience and expertise within the industry whereas Subject Matter Experts are those with at least 15 years of experience behind their back within the same space. The data with the help of two main processes i.e., FGDs (Focused Group Discussions) and IDs (Individual Discussions). This gives us a 3rd party nonbiased primary view of the market scenario making it a more dependable one while collation of the data pointers.

Step 3: Data Bank Validation

Once all the information is collected via primary and secondary sources, we run that information for data validation. At our intelligence centre our research heads track a lot of information related to the market which includes the quarterly reports, the daily stock prices, and other relevant information. Our data bank server gets updated every fortnight and that is how the information which we collected using our primary and secondary information is revalidated in real time.

Data Bank Validation

Step 4: QA/QC Process

After all the data collection and validation our team does a final level of quality check and quality assurance to get rid of any unwanted or undesired mistakes. This might include but not limited to getting rid of the any typos, duplication of numbers or missing of any important information. The people involved in this process include technical content writers, research heads and graphics people. Once this process is completed the title gets uploader on our platform for our clients to read it.

Step 5: Final QC/QA Process:

This is the last process and comes when the client has ordered the study. In this process a final QA/QC is done before the study is emailed to the client. Since we believe in giving our clients a good experience of our research studies, therefore, to make sure that we do not lack at our end in any way humanly possible we do a final round of quality check and then dispatch the study to the client.

Key Segments:

By Type

By End-Use

  • Automotive & Transportation

  • Consumer goods/lifestyle

  • Building & Construction

  • Electrical & electronics

  • Packaging

  • Agriculture

  • Other

Request for Segment Customization as per your Business Requirement: Segment Customization Request

Regional Coverage:

North America

  • US

  • Canada

  • Mexico

Europe

  • Eastern Europe

    • Poland

    • Romania

    • Hungary

    • Turkey

    • Rest of Eastern Europe

  • Western Europe

    • Germany

    • France

    • UK

    • Italy

    • Spain

    • Netherlands

    • Switzerland

    • Austria

    • Rest of Western Europe

Asia Pacific

  • China

  • India

  • Japan

  • South Korea

  • Vietnam

  • Singapore

  • Australia

  • Rest of Asia Pacific

Middle East & Africa

  • Middle East

    • UAE

    • Egypt

    • Saudi Arabia

    • Qatar

    • Rest of Middle East

  • Africa

    • Nigeria

    • South Africa

    • Rest of Africa

  • Latin America

  • Brazil

  • Argentina

  • Colombia

  • Rest of Latin America

Request for Country Level Research Report: Country Level Customization Request

Available Customization

With the given market data, SNS Insider offers customization as per the company’s specific needs. The following customization options are available for the report:

  • Product Analysis

  • Criss-Cross segment analysis (e.g. Product X Application)

  • Product Matrix which gives a detailed comparison of product portfolio of each company

  • Geographic Analysis

  • Additional countries in any of the regions

  • Company Information

  • Detailed analysis and profiling of additional market players (Up to five)


  •            5000 (33% Discount)


  •            8950 (40% Discount)


  •            3050 (23% Discount)

Start a Conversation

Hi! Click one of our member below to chat on Phone