RF-over-Fiber Market Report Scope & Overview:
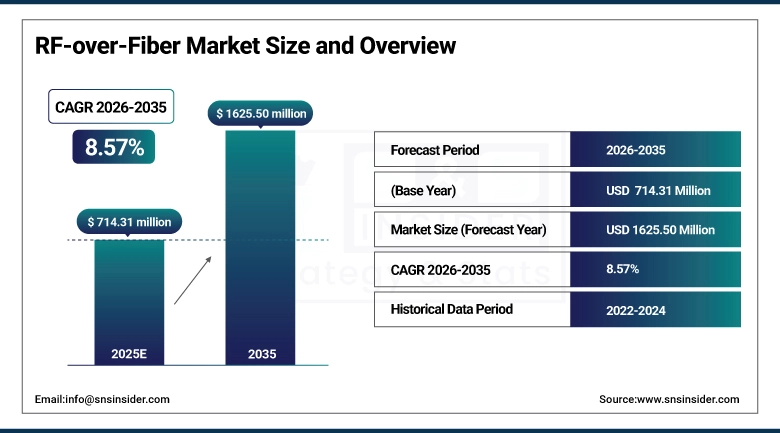
The RF-over-Fiber Market size was valued at USD 714.31 Million in 2025 and is expected to reach USD 1625.50 Million by 2035, growing at a CAGR of 8.57% over the forecast period of 2026–2035.
RF over Fiber commonly written as RFoF refers to the technique of transmitting radio frequency signals over optical fiber rather than conventional coaxial cable. The core appeal is straightforward: fiber carries RF signals across much longer distances with far less signal loss, and it does so without picking up the electromagnetic interference that plagues copper-based links. These characteristics have made RFoF an increasingly practical choice for sectors where signal quality cannot be compromised telecom backhaul, live broadcast facilities, radar testing, hospital imaging systems, and military communications among them.
In 2024, RFOptic launched its RFoF Ultra series, extending supported frequencies to 18 GHz for electronic warfare and 5G testing applications. The company simultaneously broadened its commercial footprint into the U.S., India, and EMEA markets a sign of how quickly global demand is diversifying.
RF-over-Fiber Market Size and Growth Projection:
-
Market Size in 2025: USD 657.93 Million
-
Market Size by 2035: USD 1625.50 Million
-
CAGR: 8.57% from 2025 to 2035
-
Base Year: 2024
-
Forecast Period: 2026–2035
-
Historical Data: 2022–2024
To Get more information on RF-over-Fiber Market - Request Free Sample Report
RF-over-Fiber Market Trends Analysis:
-
5G small-cell densification is pushing telecom operators to replace legacy coax fronthaul with fiber-based RF links, making RFoF a default choice for new-build distributed antenna systems in urban centres.
-
Hybrid RFoF platforms capable of carrying both analog and digitized RF on a single strand are drawing interest from defence integrators who need flexible, multi-signal infrastructure without running separate cables.
-
Optical amplifier adoption within long-haul RFoF links is rising sharply, particularly in satellite ground station upgrades where signal boost over multi-kilometre runs is non-negotiable.
-
Healthcare networks are slowly but steadily replacing in-building coax with RFoF solutions to eliminate RF noise inside MRI suites and operating theatres a niche but high-margin growth pocket.
-
Wideband transmitter modules rated to 40 GHz are moving from prototype to production, opening the door for RFoF deployment in Ka-band satellite links and millimetre-wave radar test systems.
U.S. RF-over-Fiber Market Size Outlook:
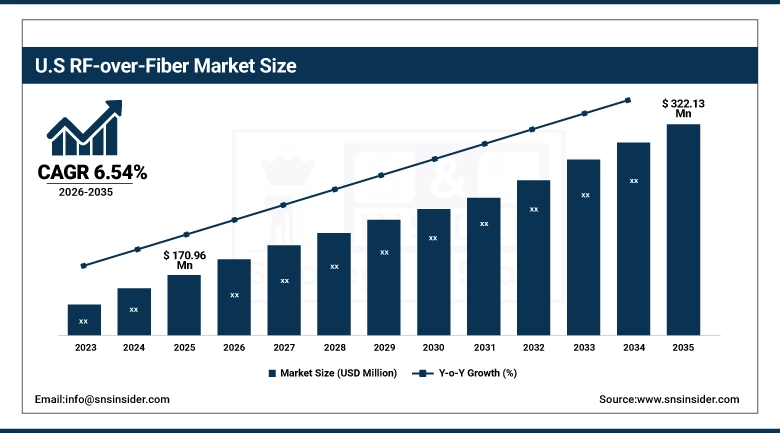
The U.S. RF Over Fiber Market size was USD 170.96 Million in 2025 and is expected to reach USD 322.13 Million by 2035, growing at a CAGR of 6.54% over the forecast period of 2026–2035.
The United States remains the single largest country-level market for RF over fiber, a position backed by a few mutually reinforcing factors. Pentagon and intelligence agency procurement for fibre-fed RF distribution in command-and-control facilities has been consistent for years. On the commercial side, the three major national carriers are mid-way through 5G densification programmes that require upgraded fronthaul infrastructure in hundreds of cities.
In March 2024, Broadcom introduced Bailly its 51.2 Tbps co-packaged optics Ethernet switch claiming a 70% reduction in power consumption relative to its predecessor. While primarily a data centre product, it illustrates the wider push toward integrated optical-electrical architectures that is feeding through into RFoF component design.
RF-over-Fiber Market Growth Drivers:
-
5G Rollout and the Shift Toward Fibre-Fed Radio Access Networks
Of all the forces shaping this market right now, 5G buildout is probably the most consequential. When a mobile operator deploys a dense layer of sub-6 GHz and mmWave small cells across a city, it needs a way to connect each remote radio head back to the centralised baseband unit. Coaxial cable works at short distances, but the losses become unacceptable beyond a few hundred metres, and running dedicated coax to hundreds of street-level nodes is neither practical nor cost-effective. Fibre-based RF distribution solves both problems: it runs clean RF signals over kilometres with negligible loss, and because fibre itself is now commodity infrastructure in most metro areas, the incremental cost is manageable. The broader demand pipeline is deepening as IoT connectivity, factory automation, and vehicle-to-everything (V2X) communications all place fresh requirements on radio access infrastructure.
RF-over-Fiber Market Growth Restraints:
-
Regulatory Patchwork and Spectrum Licensing Complexity
Building out RFoF infrastructure across multiple countries is harder than it looks on paper. Spectrum licensing rules vary enormously what is permitted in one jurisdiction may require lengthy regulatory approval in another, and the standards governing signal levels, interference thresholds, and equipment certification are not harmonised globally. For vendors selling into both commercial telecom and defence markets, maintaining dual compliance frameworks adds cost and extends sales cycles. Smaller system integrators, in particular, cite regulatory navigation as a meaningful drag on project timelines in new geographic markets.
RF-over-Fiber Market Growth Opportunities:
-
Rural Broadband Gaps and the Economics of Long-Haul RF Delivery
There is a substantial and still largely unaddressed market in rural and remote connectivity. Governments in South and Southeast Asia, sub-Saharan Africa, and parts of Latin America have committed meaningful capital to rural broadband expansion the question is which technology can deliver reliable, high-speed service at a cost that works in low-ARPU environments. RFoF has a genuine edge here. A single fibre trunk can carry multiple RF carriers across tens of kilometres to serve a cluster of villages, with the RF signal distributed locally from a small base station at the receiving end. The infrastructure cost per connected household is substantially lower than alternatives like satellite or point-to-point microwave in many terrain types.
RF-over-Fiber Market Segment:
-
By Technology: Digital RF Over Fiber held the dominant share of 47.36% in 2025; Hybrid RF Over Fiber is the fastest-growing segment, forecast at a CAGR of 9.67% over 2026–2035.
-
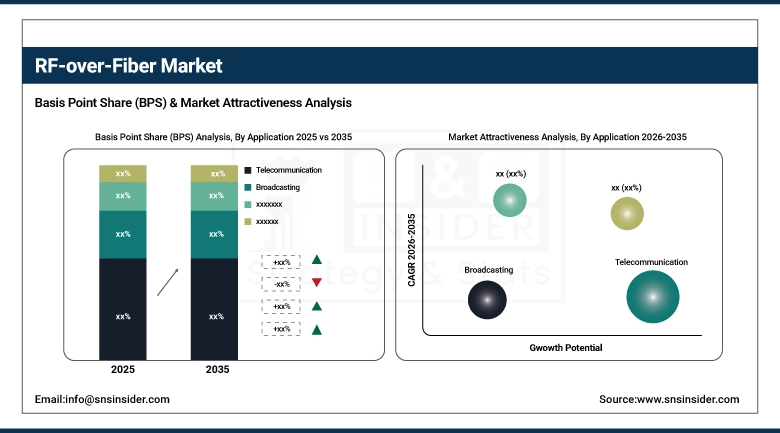
By Application: Telecommunication led with 43.49% revenue share in 2025; Broadcasting is set to be the fastest-growing application at a CAGR of 9.92% over the forecast period.
-
By Component: Transmitters accounted for the highest component share of 42.93% in 2025; Optical Amplifiers are expected to grow at the fastest CAGR of 9.43% through 2035.
-
By End-User: Service Providers dominated with a 57.98% share in 2025; Healthcare Institutions represent the fastest-growing end-user category at a CAGR of 9.77%.
By Application: Telecom Dominates; Broadcasting Catches Up Quickly.
Telecommunications accounted for roughly 43.49% of total RF Over Fiber revenue in 2024, and the segment's hold on the market shows no sign of loosening in the near term. The logic is structural: global mobile data consumption continues to rise, operators keep adding spectrum bands, and each new band typically requires a fresh fronthaul link between antenna and baseband. Broadcasting sits at the other end of the application table in terms of current size, but its forecast CAGR of 9.92% through 2035 makes it the growth story worth watching. The catalyst is millimetre-wave 5G and, further out, 6G. NEC's June 2024 radio-over-fiber system built around a 1-bit fibre transmission technique demonstrated that mmWave signals can be delivered to small, inexpensive antenna units without the costly high-frequency electronics normally required at the antenna end.
By Technology: Digital RF Over Fiber Leads; Hybrid Format Gains Ground.
Digital RF Over Fiber held the largest technology share 47.36% in 2024 and the reasons are not hard to find. Once an RF signal is digitised and wrapped in a standard digital format, it travels over fibre with none of the nonlinear distortion issues that affect analog links at high power levels. For broadcasting studios managing dozens of simultaneous feeds, and for defence systems where signal authenticity matters, that reliability premium justifies the slightly higher system cost. Hybrid RF Over Fiber is a different story smaller today but growing faster, with a forecast CAGR of 9.67% through 2035. The appeal is infrastructure efficiency: a single hybrid-capable fibre link can carry both legacy analog signals and modern digital feeds simultaneously, which matters enormously for organisations that cannot afford to replace everything at once.
By Component: Transmitters Are the Workhorse; Amplifiers Are the Growth Engine.
Transmitters took a 42.93% component share in 2025, which reflects their indispensable role: without a high-quality electro-optic conversion at the input end, the rest of the link cannot function. Recent product development has focused on pushing the frequency ceiling upward APITech's latest military-grade transmitters cover wide instantaneous bandwidths above 10 GHz with noise figures that would have been considered exceptional five years ago. Optical Amplifiers are a smaller component category but the fastest-growing one, with a projected CAGR of 9.43%. As RFoF deployments extend to longer distances campus-scale and inter-city links in aerospace and satellite ground station applications the signal needs to be regenerated periodically.
By End-User: Service Providers Lead; Healthcare Adds a New Growth Track.
Service Providers accounted for 57.98% of end-user demand in 2025 a share that reflects how thoroughly RFoF has been absorbed into mainstream telecom infrastructure. Healthcare Institutions is a much smaller segment today, but a CAGR of 9.77% through 2035 signals genuine structural growth rather than a one-off uptick. In clinical environments, RF interference is not merely inconvenient it can disrupt life-critical equipment. Replacing coax-based in-building wireless with RFoF eliminates that interference risk entirely.
RF-over-Fiber Market Regional Analysis:
North America RF-over-Fiber Market Insights:
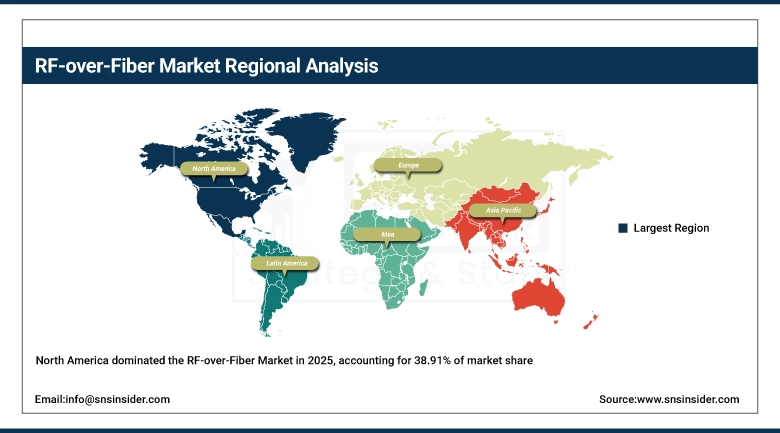
North America held approximately 38.91% of global RF Over Fiber revenue in 2024, maintaining a regional lead that has been in place for well over a decade. Three industries drive that concentration: commercial telecom, federal defence and intelligence, and cable television. Each has different buying cycles and different technical requirements, but all three are expanding their fibre RF infrastructure for reasons that are unlikely to reverse in the near term.
Get Customized Report as per Your Business Requirement - Enquiry Now
U.S. and Canada RF-over-Fiber Market Insights:
The U.S. accounts for the overwhelming majority of the North American market. Its combination of large-scale defence spending, three national mobile operators mid-way through 5G buildout, and a cable industry undergoing fibre upgrade cycles creates a procurement environment that few other geographies can match. Canada's market is smaller but growing, underpinned by federal rural broadband commitments and the build-out of smart city infrastructure in Toronto, Vancouver, and Calgary, all of which require reliable long-distance RF distribution links.
Asia Pacific RF-over-Fiber Market Insights:
Asia Pacific is forecast to grow at the fastest regional rate a CAGR of 10.00% through 2035 and the underlying dynamics are not particularly surprising given the scale of infrastructure investment across the region. China is the headline story: state-owned carriers have deployed 5G at a pace and scale that dwarfs any other country, and that rollout has required massive investment in RFoF-based fronthaul. Huawei's RF Over Fiber product portfolio has been central to those deployments. Japan and South Korea, both technically sophisticated markets with high population densities favourable to small-cell architectures, are also significant consumers
Europe RF-over-Fiber Market Insights:
Europe's RF Over Fiber market is advancing at a measured pace, shaped by a mix of commercial telecom upgrades and a significant uplift in defence-related procurement. Germany leads the continent, partly because of its strong industrial base in precision electronics, and partly because of German government spending on digital infrastructure modernisation. France and the UK are active markets too, driven in part by NATO interoperability requirements that are pushing member states to upgrade aging military communications infrastructure.
Latin America RF-over-Fiber Market Insights:
Brazil is the dominant market in Latin America, accounting for a disproportionate share of regional RF Over Fiber activity. The country's major telecom operators are investing in 5G coverage expansion beyond the São Paulo-Rio corridor, which requires cost-effective fronthaul for new sites in secondary cities. Government broadband programmes, including subsidy schemes for rural internet access, are beginning to translate into tendering activity for fibre-based distribution systems.
Middle East and Africa RF-over-Fiber Market Insights:
The Gulf states primarily the UAE and Saudi Arabia dominate Middle East spending on RF over fiber, for reasons that are part 5G ambition and part defence modernisation. Both countries have set explicit smart city targets that require high-density wireless coverage, which translates into RFoF fronthaul procurement. Saudi Arabia's Vision 2030 infrastructure programme includes significant telecommunications components, and NEOM's construction is generating demand for bespoke RF distribution systems. South Africa leads sub-Saharan Africa, supported by the expansion of fibre backbone networks and growing interest in RFoF for mining and industrial communications where RF reliability in difficult physical environments is a premium requirement.
RF-over-Fiber Market Competitive Landscape:
Coherent Corp. occupies a broad position across the RF over fiber value chain from laser sources and optical amplifiers through to fully integrated RFoF subsystems. The company's origins in laser manufacturing give it a materials and component depth that pure-play RFoF vendors cannot easily replicate.
-
In 2024, Coherent Corp. extended its optical amplifier and transceiver product lines to cover a wider range of high-capacity RFoF applications across defence backhaul, satellite ground stations, and telecom infrastructure consolidating its position as a vertically integrated supplier in the market.
HUBER+SUHNER AG brings Swiss manufacturing precision to a product category where consistency matters. The company's fibre optic connectivity hardware is specified into defence communications networks across Europe and increasingly in North America, and its recent move into higher-frequency RFoF modules has expanded the addressable market meaningfully.
-
In December 2024, HUBER+SUHNER released the RF-over-Fiber 2300 series a product line extending the supported frequency range to 40 GHz, with ultra-low latency specifications suited to radar systems, satellite communications, and 5G testing environments.
EMCORE Corporation has long been one of the go-to suppliers for cable TV and satellite ground station operators requiring reliable, high-volume RFoF modules. Its product catalogue covers the full range from standard analog links to advanced digitised RF systems, and the company has demonstrated consistent ability to scale production as operator procurement volumes grow. Its primary competitive challenge is differentiation in a space where competing modules are converging on similar specifications the company has responded by deepening application engineering support for large accounts.
-
In 2024, EMCORE expanded its RFoF module portfolio in response to telecom operator demand for higher optical transmission density, focusing on improved signal quality and compactness for centralised RAN deployments.
RF-over-Fiber Companies are:
-
HUBER+SUHNER AG
-
EMCORE Corporation
-
G&H Group
-
Broadcom Inc.
-
DEV Systemtechnik GmbH
-
Global Foxcom
-
RF Optic Ltd.
-
Syntonics LLC
| Report Attributes | Details |
|---|---|
| Market Size in 2025 | USD 714.31 Billion |
| Market Size by 2035 | USD 1625.50 Billion |
| CAGR | CAGR of 8.57% From 2026 to 2035 |
| Base Year | 2025 |
| Forecast Period | 2026-2035 |
| Historical Data | 2022-2024 |
| Report Scope & Coverage | Market Size, Segments Analysis, Competitive Landscape, Regional Analysis, DROC & SWOT Analysis, Forecast Outlook |
| Key Segments | • By Technology (Analog RF Over Fiber, Digital RF Over Fiber, Hybrid RF Over Fiber) • By Application (Telecommunication, Broadcasting, Military and Aerospace, Medical, Industrial) • By End User (Service Providers, Telecom Operators, Government and Defense, Healthcare Institutions) • By Component (Transmitter, Receiver, Optical Amplifier, Fiber Optic Cable) |
| Regional Analysis/Coverage | North America (US, Canada), Europe (Germany, UK, France, Italy, Spain, Russia, Poland, Rest of Europe), Asia Pacific (China, India, Japan, South Korea, Australia, ASEAN Countries, Rest of Asia Pacific), Middle East & Africa (UAE, Saudi Arabia, Qatar, South Africa, Rest of Middle East & Africa), Latin America (Brazil, Argentina, Mexico, Colombia, Rest of Latin America). |
| Company Profiles | Coherent Corp., HUBER+SUHNER AG, EMCORE Corporation, G&H Group, SEIKOH GIKEN CO., LTD, Broadcom Inc., DEV Systemtechnik GmbH, Global Foxcom, RF Optic Ltd., Syntonics LLC. |
Frequently Asked Questions
North America dominated the RF Over Fiber market in 2024.
Digital RF Over Fiber segment dominated the RF Over Fiber market.
The major growth factor of the RF Over Fiber market is the increasing demand for high-speed, low-latency communication in 5G and beyond.
The RF Over Fiber market size was USD 657.93 million in 2024 and is expected to reach USD 1264.34 million by 2032.
The RF Over Fiber market is expected to grow at a CAGR of 8.57% from 2025-2032.
Get in Touch
