Semiconductor Modeling and Simulation Market Report Scope & Overview:
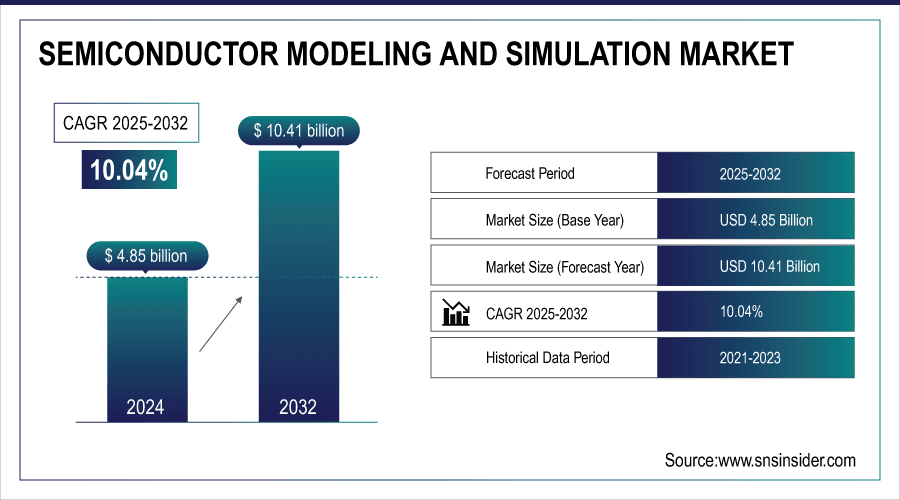
The Semiconductor Modeling and Simulation Market size was valued at USD 4.85 Billion in 2024 and is projected to reach USD 10.41 Billion by 2032, growing at a CAGR of 10.04% during 2025-2032.
The Semiconductor Modeling & Simulation Market is all about the specialized software tools that chip designers use before a semiconductor is manufactured. These platforms allow engineers to test, tweak, and validate chip designs virtually, reducing costly trial-and-error in fabrication. They cover everything from device-level physics (TCAD) and circuit simulations (SPICE, analog/mixed-signal) to system-level modeling for performance under real-world conditions like thermal stress, power consumption, and electromagnetic interference. This market encompasses Integrated Device Manufacturers (IDMs), fabless design firms, foundries, and Outsourced Semiconductor Assembly & Test (OSAT) suppliers. As companies design more AI accelerators, 5G/6G communication chips, automotive electronics, and chiplets, simulation tools are becoming a fundamental part of the semiconductor ecosystem—enabling companies to speed up design cycles, enhance first-pass yield, and reduce re-spins.
First-pass yield improvement of ~25–30% has been reported when advanced simulation platforms are used vs. traditional design flows (IEEE Design Automation study).

To Get More Information On Semiconductor Modeling and Simulation Market - Request Free Sample Report
Key Semiconductor Modeling and Simulation Market Trends
-
Customized simulators are needed to fit quantum behavior and particle interaction for good quantum chip design.
-
Simulation tools are increasingly being leveraged to test AI algorithms on hardware so that we can optimize chips for AI workloads.
-
Demand for advanced modeling to secure high-speed interconnection and data processing is fueled by 5G networks roll out.
-
Enhanced quantum simulators reduce the need for expensive physical experiments, thereby speeding up innovation and development cycles.
-
Integrated simulation solutions are necessary to verify performance of future mobile, IoT, and communication equipment.
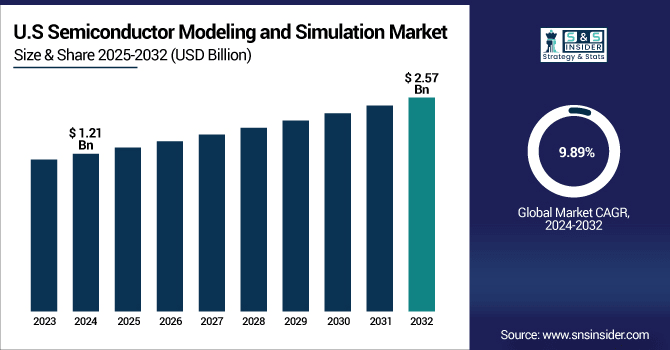
The U.S. Semiconductor Modeling and Simulation Market size was valued at USD 1.21 Billion in 2024 and is projected to reach USD 2.57 Billion by 2032, growing at a CAGR of 9.89% during 2025-2032. "Semiconductor Modeling and Simulation Market analysis of the Semiconductor Modeling and Simulation market focuses on the market data and information, with the information processed according to market trends, drivers, and market challenges. Engineers rely on high-end simulation tools to improve the performance of their chips, decrease costly design errors, and speed time to market.

Moreover, the increasing use of AI, cloud-based systems, and 3D ICs and quantum devices is contributing to the demand. Organizations are adopting simulation solutions to enhance energy efficiency, address thermal challenges, and deliver product reliability amidst ever-tightening development schedules for smaller, higher-performing chips.
Semiconductor Modeling and Simulation Market Growth Drivers:
-
Adoption of AI, Machine Learning, and 5G Demanding High-Performance Chips.
The growth of AI and machine learning are also changing the design and simulation requirements for semiconductors. Simulator tools are more and more widely employed to get fast insights on quality of AI algorithms on hardware. Firms can fine-tune chips to be best suited to AI workloads, giving them better overall performance. The roll-out of 5G networks, additionally, only increases the need for chips that take care of the heavy lifting involved in complex data processing. For high-speed interconnection, modeling is necessary to guarantee reliable performance across the time-domain. Simulation allows design validation for future mobile, IOT and communication devices. AI and 5G Integration Driving Major Innovation And Industry Growth In Semiconductors. Such technologies generate the need for sophisticated modeling and simulation tools.
Over 66% of demand for semiconductor modeling and simulation is driven by increased AI, 5G, and IoT chip design using integrated modeling platforms .
Semiconductor Modeling and Simulation Market Restraints:
-
High Costs and Operational Complexity of Advanced Simulation Software
The semiconductor modeling and simulation industry have its own set of issues with expensive high end software. In many cases small and medium-sized companies cannot afford major investments for the implementation. Such instruments need trained creature comfort and contribute to both running cost and skill requirement. The costs of licensing, application integration and software maintenance add to the growing fiscal pains for businesses. More complicated workflows can lead to slower deployment and less efficiency with teams that lack experience. High Capex for market access especially for new Semiconductor developers. Constraints in cost force the demand for cheaper and scalable simulation alternatives. Solving these challenges is a key opportunity to increase accessibility in the industry.
Semiconductor Modeling and Simulation Market Opportunities:
-
Growing Demand for Simulation Tools in Quantum Computing Applications
Quantum computing opens a vast market to be covered by the semiconductor simulation software. The modeling of a quantum processor is of a particular type and not like usual semiconductor simulations. Simulation technologies must exist to correctly predict quantum phenomenon and the behavior of particles. This should enable engineers to design quantum chips that are reliable and of high quality. With growing market of quantum computing, need of better simulation solutions is increasing. Firms that invest early in quantum- centric modeling tools might have a competitive edge. Improved simulator reduces the number of expensive trial and error experiments for quantum devices. Overall, quantum computing offers a high-growth avenue for semiconductor simulation providers.
Around 65% of quantum computing labs use simulation tools for multi-institution collaboration to model complex qubit interactions
Key Semiconductor Modeling and Simulation Market Segment Analysis
-
By Component, Software led with ~ 68.33% share in 2024; Services fastest growing (CAGR 10.33%).
-
By Application, Consumer Electronics dominated ~ 34.23% in 2024; Automotive fastest growing (CAGR 10.63%).
-
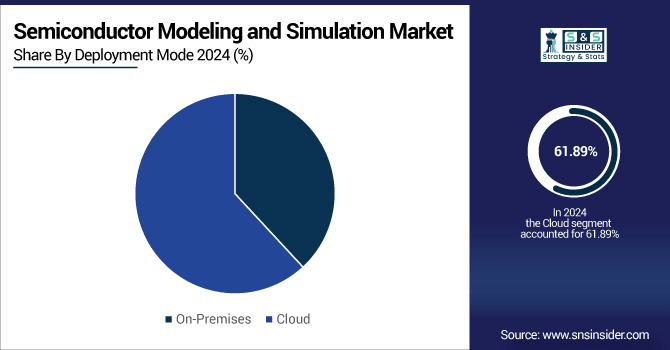
By Deployment Mode, Cloud led ~ 61.89% in 2024; with (CAGR 10.11%).
-
By End-User, BFSI held ~ 38.54% in 2024; IT and Telecommunications fastest growing (CAGR 10.40%).
By Deployment Mode, Cloud Lead and Registers Fastest Growth
In the semiconductor modeling and simulation market, cloud deployment leads due to its scalability, flexibility, and ability to support collaborative design workflows across multiple locations. cloud delivery is seeing the most rapid adoption as more companies are moving away from traditional on-premise offerings towards more agile, subscription -based deployment. Add to this blooming combination of AI, big data and high performance computing the adoption of cloud platforms and challenge just thrives. Cloud imaging offsite becomes in general the primary and most rapidly growing cloud deployment mode available in the market.

By Component, Software Leads Market While Services Registers Fastest Growth
In the semiconductor modeling and simulation market, software dominates as the largest component due to its essential role in designing, testing, and validating semiconductor devices. This software lets engineers to emulate and explore large designs which can simulate numbers at full-chip capacity and minimize expensive errors prior to production. In contrast, it is the services that are showing the highest rates of growth, again led by greater need for consulting, integration, training and support. With the increasing complexity of simulation applications, companies need the professional services to make sure they are properly implemented and getting the most value. Other services consist of cloud-based implementation, professional support and customization for special design applications. Additionally, the explosion of AI, 3D ICs and quantum computers is driving demand for a growing range of specialized services.
By Application, Consumer Electronics Dominate While Automotive Shows Rapid Growth
In the semiconductor modeling and simulation market, consumer electronics dominate as the largest application segment due to the high volume of smartphones, laptops, and wearable devices requiring advanced chip designs. The use of such devices require high-performance, low loss, and low form factor semiconductors, and simulation tools are critical in device design and reliability testing. Automotive segment however is projected to exhibit swift expansion owing to rising adoption of advanced driver-assistance systems (ADAS), electric vehicles (EVs) and autonomous driving solutions. Simulations need to be accurate enough to help model everything from automotive chips, for safety, thermal and power efficiency, driving a need for increasingly specialized solutions. The growing popularity of connected and smart cars only adds fuel to the flame.
By End-User, BFSI Lead While IT and Telecommunications Grow Fastest
In the semiconductor modeling and simulation market, the BFSI (Banking, Financial Services, and Insurance) sector leads due to its demand for high-performance computing and secure, reliable semiconductor devices for data processing and transaction systems. These simulation tools cover many aspects of high-performance financial hardware, supporting efficiency, accuracy, and risk reduction simulation. The IT and telecommunications industry is also the fastest growing, as 5G infrastructure, cloud computing and expanding data center requirements boost demand. These industries need higher-end chips that can process massive amounts of data and speedy connectivity. For these markets, simulation solutions provide faster development and validation of complex semiconductor designs.
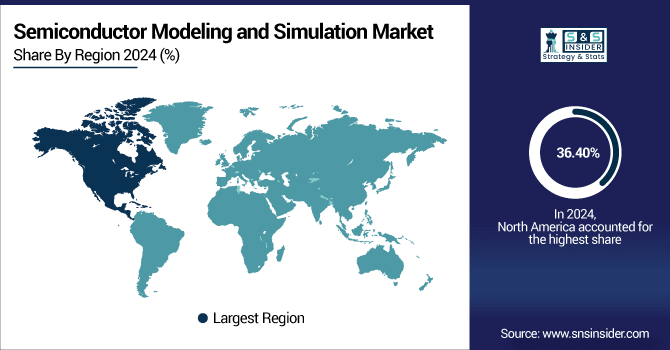
North America Semiconductor Modeling and Simulation Market Insights
In 2024 North America dominated the Semiconductor Modeling and Simulation Market and accounted for 36.40% of revenue share, this leadership is due to the region’s strong semiconductor industry, extensive R&D investments, and early adoption of advanced simulation technologies. Additionally, the presence of major software providers and innovative tech companies supports market growth.

Get Customized Report as Per Your Business Requirement - Enquiry Now
Asia-pacific Semiconductor Modeling and Simulation Market Insights
Asia-pacific is expected to witness the fastest growth in the Semiconductor Modeling and Simulation Market over 2025-2032, with a projected CAGR of 29.76% due to rapid industrialization, increasing semiconductor manufacturing, and rising investments in advanced chip design. The region’s expanding electronics and automotive sectors further drive demand for simulation tools. Government initiatives supporting R&D and technology adoption also contribute to accelerated growth.
Europe Semiconductor Modeling and Simulation Market Insights
Europe became the prospective market for the Semiconductor Modeling and Simulation in the year 2024 with Government support for advanced semiconductor technology, - Strong R&D infrastructure, And leading chip manufacturers. The area’s automotive, industrial automation, and AI applications-oriented focus also drives demand. The cooperation of university and industry partners also promotes innovation of simulation tools.
Latin America (LATAM) and Middle East & Africa (MEA) Semiconductor Modeling and Simulation Market Insights
The growth of the Semiconductor Modeling and Simulation market in Latin America (LATAM) is driven by growing semiconductor manufacturing and electronics penetrations in the American automotive market. Insufficient R&D facilities and slow technology uptakes too far behind developed part also restrain burgeoning. But government action and foreign investment are helping the market to develop slowly. There’s consistent growth as demand for advanced simulation tools in automotive, telecommunications and industrial applications rises.
Semiconductor Modeling and Simulation Market Competitive Landscape:
Synopsys Inc. is a global leader in electronic design automation (EDA) and semiconductor simulation, renowned for its comprehensive suite of tools that span the entire chip development lifecycle. Earlier this year the company has closed on its $35 billion acquisition of Ansys, combining EDA with multipsyhsics simulation, to provide a more unified platform for silicon-to-system design. This strategic acquisition will accelerate Synopsys' efforts to develop a complete flow tuned for AI and other demanding system-on-chip (SoC) applications including those in consumer electronics, automotive, and many other markets.
-
In July, 2025, Synopsys completed its $35 billion acquisition of Ansys, combining leaders in silicon design, IP, and simulation and analysis to enable customers to rapidly innovate AI-powered products. This acquisition positions Synopsys to lead in an expanded $31 billion total addressable market (TAM).
Cadence Design Systems Inc. Ltd., established in 2002, is a leading Chinese manufacturer specializing in low-voltage electrical and automation control products. It provides a wide variety of product solutions such as Mini Circuit Breakers (MCBs), Residual Current Circuit Breakers (RCCBs) and Photovoltaic (PV) fuses. Geya PV fuses are specifically developed for overcurrent protection in solar PV systems, ranges such as GYPV series available with DC voltage up to 1500V and AC current up to 630A, the products comply with relevant international standards including IEC 60629.1 and 60629.6, to ensure safety and reliability when installed in solar panels and inverted etc.
-
In August 2025, Cadence Design Systems Inc. unveiled its Palladium Dynamic Power Analysis (DPA) App, developed in collaboration with NVIDIA. This tool operates on the Palladium Z3 Enterprise Emulation Platform, enabling engineers to analyze the power consumption of billion-gate AI chip designs across billions of cycles within hours, achieving up to 97% accuracy. Traditional power analysis tools have struggled to scale beyond a few hundred thousand cycles without requiring extensive time.
Semiconductor Modeling and Simulation Market Key Players:
-
Synopsys Inc.
-
Cadence Design Systems Inc.
-
ANSYS Inc.
-
Mentor Graphics Corporation
-
Silvaco Inc.
-
Altair Engineering Inc.
-
Dassault Systèmes SE
-
Siemens PLM Software
-
Keysight Technologies Inc.
-
COMSOL Inc.
-
Aspen Technology Inc.
-
MathWorks Inc.
-
Lam Research Corporation
-
Applied Materials Inc.
-
GlobalFoundries Inc.
-
Intel Corporation
-
Samsung Electronics Co. Ltd.
-
Taiwan Semiconductor Manufacturing Company Limited (TSMC)
-
NVIDIA Corporation
-
Broadcom Inc.
Report Attributes | Details |
---|---|
Market Size in 2024 | USD 4.85 Billion |
Market Size by 2032 | USD 10.04 Billion |
CAGR | CAGR of 7.18% From 2025 to 2032 |
Base Year | 2024 |
Forecast Period | 2025-2032 |
Historical Data | 2021-2023 |
Report Scope & Coverage | Market Size, Segments Analysis, Competitive Landscape, Regional Analysis, DROC & SWOT Analysis, Forecast Outlook |
Key Segments | • By Component (Software, Hardware and Services) • By Application (Consumer Electronics, Automotive, Aerospace and Defense, Industrial, Healthcare, and Others) • By Deployment Mode (On-Premises and Cloud) • By End-User (BFSI, IT and Telecommunications, Manufacturing, and Others) |
Regional Analysis/Coverage | North America (US, Canada, Mexico), Europe (Germany, France, UK, Italy, Spain, Poland, Turkey, Rest of Europe), Asia Pacific (China, India, Japan, South Korea, Singapore, Australia, Taiwan, Rest of Asia Pacific), Middle East & Africa (UAE, Saudi Arabia, Qatar, South Africa, Rest of Middle East & Africa), Latin America (Brazil, Argentina, Rest of Latin America) |
Company Profiles | Synopsys Inc., Cadence Design Systems Inc., ANSYS Inc., Mentor Graphics Corporation, Silvaco Inc., Altair Engineering Inc.,Dassault Systèmes SE, Siemens PLM Software, Keysight Technologies Inc., COMSOL Inc., Aspen Technology Inc., MathWorks Inc., Lam Research Corporation, Applied Materials Inc., GlobalFoundries Inc., Intel Corporation, Samsung Electronics Co. Ltd., Taiwan Semiconductor Manufacturing Company Limited (TSMC), NVIDIA Corporation and Broadcom Inc. |
Table Of Contents
1. Introduction
1.1 Market Definition & Scope
1.2 Research Assumptions & Abbreviations
1.3 Research Methodology
2. Executive Summary
2.1 Market Snapshot
2.2 Market Absolute $ Opportunity Assessment & Y-o-Y Analysis, 2021–2032
2.3 Market Size & Forecast, By Segmentation, 2021–2032
2.3.1 Market Size By Component
2.3.2 Market Size By Application
2.3.3 Market Size By Deployment Mode
2.3.4 Market Size By End-User
2.4 Market Share & Bps Analysis By Region, 2024
2.5 Industry Growth Scenarios – Conservative, Likely & Optimistic
2.6 Industry CxO’s Perspective
3. Market Overview
3.1 Market Dynamics
3.1.1 Drivers
3.1.2 Restraints
3.1.3 Opportunities
3.1.4 Key Market Trends
3.2 Industry PESTLE Analysis
3.3 Key Industry Forces (Porter’s) Impacting Market Growth
3.4 Industry Supply Chain Analysis
3.4.1 Raw Material Suppliers
3.4.2 Manufacturers
3.4.3 Distributors/Suppliers
3.4.4 Customers/End-Users
3.5 Industry Life Cycle Assessment
3.6 Parent Market Overview
3.7 Market Risk Assessment
4. Statistical Insights & Trends Reporting
4.1 Design & Yield Statistics
4.1.1 Average first-pass silicon success rate (%) for advanced SoCs
4.1.2 Average respins per tape-out across process nodes
4.1.3 Percentage of design teams using automated vs. manual model calibration workflows
4.2 Application & Deployment Trends
4.2.1 Share of simulation workload by segment (Circuit/AMS vs. EM/Thermal vs. TCAD vs. 3D-IC)
4.2.2 Percentage of total simulation hours run on cloud vs. on-premises infrastructure
4.2.3 Growth rate (%) of GPU-accelerated and AI-assisted simulation adoption
4.3 Technology & Methodology Adoption Metrics
4.3.1 Percentage of advanced-node designs (≤5nm) using DTCO-integrated simulations
4.3.2 Adoption rate (%) of wide-bandgap (SiC/GaN) device simulations in power electronics
4.3.3 Penetration rate (%) of photonic/electro-optic co-simulation in design projects
4.4 Reliability & Performance Data
4.4.1 Mean correlation accuracy (%) of simulation results vs. silicon measurements
4.4.2 Average reduction (%) in thermal hotspot prediction error across industries
4.4.3 Failure rate (%) reduction achieved via pre-silicon reliability simulations
5. Semiconductor Modeling and Simulation Market Segmental Analysis & Forecast, By Component, 2021 – 2032, Value (USD Billion)
5.1 Introduction
5.2 Software
5.2.1 Key Trends
5.2.2 Market Size & Forecast, 2021 – 2032
5.3 Hardware
5.3.1 Key Trends
5.3.2 Market Size & Forecast, 2021 – 2032
5.4 Services
5.4.1 Key Trends
5.4.2 Market Size & Forecast, 2021 – 2032
6. Semiconductor Modeling and Simulation Market Segmental Analysis & Forecast, By Application, 2021 – 2032, Value (USD Billion)
6.1 Introduction
6.2 Consumer Electronics
6.2.1 Key Trends
6.2.2 Market Size & Forecast, 2021 – 2032
6.3 Automotive
6.3.1 Key Trends
6.3.2 Market Size & Forecast, 2021 – 2032
6.4 Aerospace and Defense
6.4.1 Key Trends
6.4.2 Market Size & Forecast, 2021 – 2032
6.5 Industrial
6.5.1 Key Trends
6.5.2 Market Size & Forecast, 2021 – 2032
6.6 Healthcare
6.6.1 Key Trends
6.6.2 Market Size & Forecast, 2021 – 2032
6.7 Others
6.7.1 Key Trends
6.7.2 Market Size & Forecast, 2021 – 2032
7. Semiconductor Modeling and Simulation Market Segmental Analysis & Forecast, By Deployment Mode, 2021 – 2032, Value (USD Billion)
7.1 Introduction
7.2 On-Premises
7.2.1 Key Trends
7.2.2 Market Size & Forecast, 2021 – 2032
7.3 Cloud
7.3.1 Key Trends
7.3.2 Market Size & Forecast, 2021 – 2032
8. Semiconductor Modeling and Simulation Market Segmental Analysis & Forecast, By End-User, 2021 – 2032, Value (USD Billion)
8.1 Introduction
8.2 BFSI
8.2.1 Key Trends
8.2.2 Market Size & Forecast, 2021 – 2032
8.3 IT and Telecommunications
8.3.1 Key Trends
8.3.2 Market Size & Forecast, 2021 – 2032
8.4 Manufacturing
8.4.1 Key Trends
8.4.2 Market Size & Forecast, 2021 – 2032
8.5 Others
8.5.1 Key Trends
8.5.2 Market Size & Forecast, 2021 – 2032
9. Semiconductor Modeling and Simulation Market Segmental Analysis & Forecast By Region, 2021 – 2025, Value (USD Billion)
9.1 Introduction
9.2 North America
9.2.1 Key Trends
9.2.2 Semiconductor Modeling and Simulation Market Size & Forecast, By Component, 2021 – 2032
9.2.3 Semiconductor Modeling and Simulation Market Size & Forecast, By Application, 2021 – 2032
9.2.4 Semiconductor Modeling and Simulation Market Size & Forecast, By Deployment Mode, 2021 – 2032
9.2.5 Semiconductor Modeling and Simulation Market Size & Forecast, By End-User, 2021 – 2032
9.2.6 Semiconductor Modeling and Simulation Market Size & Forecast, By Country, 2021 – 2032
9.2.6.1 USA
9.2.6.1.1 Semiconductor Modeling and Simulation Market Size & Forecast, By Component, 2021 – 2032
9.2.6.1.2 Semiconductor Modeling and Simulation Market Size & Forecast, By Application, 2021 – 2032
9.2.6.1.3 Semiconductor Modeling and Simulation Market Size & Forecast, By Deployment Mode, 2021 – 2032
9.2.6.1.4 Semiconductor Modeling and Simulation Market Size & Forecast, By End-User, 2021 – 2032
9.2.6.2 Canada
9.2.6.2.1 Semiconductor Modeling and Simulation Market Size & Forecast, By Component, 2021 – 2032
9.2.6.2.2 Semiconductor Modeling and Simulation Market Size & Forecast, By Application, 2021 – 2032
9.2.6.2.3 Semiconductor Modeling and Simulation Market Size & Forecast, By Deployment Mode, 2021 – 2032
9.2.6.2.4 Semiconductor Modeling and Simulation Market Size & Forecast, By End-User, 2021 – 2032
9.3 Europe
9.3.1 Key Trends
9.3.2 Semiconductor Modeling and Simulation Market Size & Forecast, By Component, 2021 – 2032
9.3.3 Semiconductor Modeling and Simulation Market Size & Forecast, By Application, 2021 – 2032
9.3.4 Semiconductor Modeling and Simulation Market Size & Forecast, By Deployment Mode, 2021 – 2032
9.3.5 Semiconductor Modeling and Simulation Market Size & Forecast, By End-User, 2021 – 2032
9.3.6 Semiconductor Modeling and Simulation Market Size & Forecast, By Country, 2021 – 2032
9.3.6.1 Germany
9.3.6.1.1 Semiconductor Modeling and Simulation Market Size & Forecast, By Component, 2021 – 2032
9.3.6.1.2 Semiconductor Modeling and Simulation Market Size & Forecast, By Application, 2021 – 2032
9.3.6.1.3 Semiconductor Modeling and Simulation Market Size & Forecast, By Deployment Mode, 2021 – 2032
9.3.6.1.4 Semiconductor Modeling and Simulation Market Size & Forecast, By End-User, 2021 – 2032
9.3.6.2 UK
9.3.6.2.1 Semiconductor Modeling and Simulation Market Size & Forecast, By Component, 2021 – 2032
9.3.6.2.2 Semiconductor Modeling and Simulation Market Size & Forecast, By Application, 2021 – 2032
9.3.6.2.3 Semiconductor Modeling and Simulation Market Size & Forecast, By Deployment Mode, 2021 – 2032
9.3.6.2.4 Semiconductor Modeling and Simulation Market Size & Forecast, By End-User, 2021 – 2032
9.3.6.3 France
9.3.6.3.1 Semiconductor Modeling and Simulation Market Size & Forecast, By Component, 2021 – 2032
9.3.6.3.2 Semiconductor Modeling and Simulation Market Size & Forecast, By Application, 2021 – 2032
9.3.6.3.3 Semiconductor Modeling and Simulation Market Size & Forecast, By Deployment Mode, 2021 – 2032
9.3.6.3.4 Semiconductor Modeling and Simulation Market Size & Forecast, By End-User, 2021 – 2032
9.3.6.4 Italy
9.3.6.4.1 Semiconductor Modeling and Simulation Market Size & Forecast, By Component, 2021 – 2032
9.3.6.4.2 Semiconductor Modeling and Simulation Market Size & Forecast, By Application, 2021 – 2032
9.3.6.4.3 Semiconductor Modeling and Simulation Market Size & Forecast, By Deployment Mode, 2021 – 2032
9.3.6.4.4 Semiconductor Modeling and Simulation Market Size & Forecast, By End-User, 2021 – 2032
9.3.6.5 Spain
9.3.6.5.1 Semiconductor Modeling and Simulation Market Size & Forecast, By Component, 2021 – 2032
9.3.6.5.2 Semiconductor Modeling and Simulation Market Size & Forecast, By Application, 2021 – 2032
9.3.6.5.3 Semiconductor Modeling and Simulation Market Size & Forecast, By Deployment Mode, 2021 – 2032
9.3.6.5.4 Semiconductor Modeling and Simulation Market Size & Forecast, By End-User, 2021 – 2032
9.3.6.6 Russia
9.3.6.6.1 Semiconductor Modeling and Simulation Market Size & Forecast, By Component, 2021 – 2032
9.3.6.6.2 Semiconductor Modeling and Simulation Market Size & Forecast, By Application, 2021 – 2032
9.3.6.6.3 Semiconductor Modeling and Simulation Market Size & Forecast, By Deployment Mode, 2021 – 2032
9.3.6.6.4 Semiconductor Modeling and Simulation Market Size & Forecast, By End-User, 2021 – 2032
9.3.6.7 Poland
9.3.6.7.1 Semiconductor Modeling and Simulation Market Size & Forecast, By Component, 2021 – 2032
9.3.6.7.2 Semiconductor Modeling and Simulation Market Size & Forecast, By Application, 2021 – 2032
9.3.6.7.3 Semiconductor Modeling and Simulation Market Size & Forecast, By Deployment Mode, 2021 – 2032
9.3.6.7.4 Semiconductor Modeling and Simulation Market Size & Forecast, By End-User, 2021 – 2032
9.3.6.8 Rest of Europe
9.3.6.8.1 Semiconductor Modeling and Simulation Market Size & Forecast, By Component, 2021 – 2032
9.3.6.8.2 Semiconductor Modeling and Simulation Market Size & Forecast, By Application, 2021 – 2032
9.3.6.8.3 Semiconductor Modeling and Simulation Market Size & Forecast, By Deployment Mode, 2021 – 2032
9.3.6.8.4 Semiconductor Modeling and Simulation Market Size & Forecast, By End-User, 2021 – 2032
9.4 Asia-Pacific
9.4.1 Key Trends
9.4.2 Semiconductor Modeling and Simulation Market Size & Forecast, By Component, 2021 – 2032
9.4.3 Semiconductor Modeling and Simulation Market Size & Forecast, By Application, 2021 – 2032
9.4.4 Semiconductor Modeling and Simulation Market Size & Forecast, By Deployment Mode, 2021 – 2032
9.4.5 Semiconductor Modeling and Simulation Market Size & Forecast, By End-User, 2021 – 2032
9.4.6 Semiconductor Modeling and Simulation Market Size & Forecast, By Country, 2021 – 2032
9.4.6.1 China
9.4.6.1.1 Semiconductor Modeling and Simulation Market Size & Forecast, By Component, 2021 – 2032
9.4.6.1.2 Semiconductor Modeling and Simulation Market Size & Forecast, By Application, 2021 – 2032
9.4.6.1.3 Semiconductor Modeling and Simulation Market Size & Forecast, By Deployment Mode, 2021 – 2032
9.4.6.1.4 Semiconductor Modeling and Simulation Market Size & Forecast, By End-User, 2021 – 2032
9.4.6.2 India
9.4.6.2.1 Semiconductor Modeling and Simulation Market Size & Forecast, By Component, 2021 – 2032
9.4.6.2.2 Semiconductor Modeling and Simulation Market Size & Forecast, By Application, 2021 – 2032
9.4.6.2.3 Semiconductor Modeling and Simulation Market Size & Forecast, By Deployment Mode, 2021 – 2032
9.4.6.2.4 Semiconductor Modeling and Simulation Market Size & Forecast, By End-User, 2021 – 2032
9.4.6.3 Japan
9.4.6.3.1 Semiconductor Modeling and Simulation Market Size & Forecast, By Component, 2021 – 2032
9.4.6.3.2 Semiconductor Modeling and Simulation Market Size & Forecast, By Application, 2021 – 2032
9.4.6.3.3 Semiconductor Modeling and Simulation Market Size & Forecast, By Deployment Mode, 2021 – 2032
9.4.6.3.4 Semiconductor Modeling and Simulation Market Size & Forecast, By End-User, 2021 – 2032
9.4.6.4 South Korea
9.4.6.4.1 Semiconductor Modeling and Simulation Market Size & Forecast, By Component, 2021 – 2032
9.4.6.4.2 Semiconductor Modeling and Simulation Market Size & Forecast, By Application, 2021 – 2032
9.4.6.4.3 Semiconductor Modeling and Simulation Market Size & Forecast, By Deployment Mode, 2021 – 2032
9.4.6.4.4 Semiconductor Modeling and Simulation Market Size & Forecast, By End-User, 2021 – 2032
9.4.6.5 Australia
9.4.6.5.1 Semiconductor Modeling and Simulation Market Size & Forecast, By Component, 2021 – 2032
9.4.6.5.2 Semiconductor Modeling and Simulation Market Size & Forecast, By Application, 2021 – 2032
9.4.6.5.3 Semiconductor Modeling and Simulation Market Size & Forecast, By Deployment Mode, 2021 – 2032
9.4.6.5.4 Semiconductor Modeling and Simulation Market Size & Forecast, By End-User, 2021 – 2032
9.4.6.6 ASEAN Countries
9.4.6.6.1 Semiconductor Modeling and Simulation Market Size & Forecast, By Component, 2021 – 2032
9.4.6.6.2 Semiconductor Modeling and Simulation Market Size & Forecast, By Application, 2021 – 2032
9.4.6.6.3 Semiconductor Modeling and Simulation Market Size & Forecast, By Deployment Mode, 2021 – 2032
9.4.6.6.4 Semiconductor Modeling and Simulation Market Size & Forecast, By End-User, 2021 – 2032
9.4.6.7 Rest of Asia-Pacific
9.4.6.7.1 Semiconductor Modeling and Simulation Market Size & Forecast, By Component, 2021 – 2032
9.4.6.7.2 Semiconductor Modeling and Simulation Market Size & Forecast, By Application, 2021 – 2032
9.4.6.7.3 Semiconductor Modeling and Simulation Market Size & Forecast, By Deployment Mode, 2021 – 2032
9.4.6.7.4 Semiconductor Modeling and Simulation Market Size & Forecast, By End-User, 2021 – 2032
9.5 Latin America
9.5.1 Key Trends
9.5.2 Semiconductor Modeling and Simulation Market Size & Forecast, By Component, 2021 – 2032
9.5.3 Semiconductor Modeling and Simulation Market Size & Forecast, By Application, 2021 – 2032
9.5.4 Semiconductor Modeling and Simulation Market Size & Forecast, By Deployment Mode, 2021 – 2032
9.5.5 Semiconductor Modeling and Simulation Market Size & Forecast, By End-User, 2021 – 2032
9.5.6 Semiconductor Modeling and Simulation Market Size & Forecast, By Country, 2021 – 2032
9.5.6.1 Brazil
9.5.6.1.1 Semiconductor Modeling and Simulation Market Size & Forecast, By Component, 2021 – 2032
9.5.6.1.2 Semiconductor Modeling and Simulation Market Size & Forecast, By Application, 2021 – 2032
9.5.6.1.3 Semiconductor Modeling and Simulation Market Size & Forecast, By Deployment Mode, 2021 – 2032
9.5.6.1.4 Semiconductor Modeling and Simulation Market Size & Forecast, By End-User, 2021 – 2032
9.5.6.2 Argentina
9.5.6.2.1 Semiconductor Modeling and Simulation Market Size & Forecast, By Component, 2021 – 2032
9.5.6.2.2 Semiconductor Modeling and Simulation Market Size & Forecast, By Application, 2021 – 2032
9.5.6.2.3 Semiconductor Modeling and Simulation Market Size & Forecast, By Deployment Mode, 2021 – 2032
9.5.6.2.4 Semiconductor Modeling and Simulation Market Size & Forecast, By End-User, 2021 – 2032
9.5.6.3 Mexico
9.5.6.3.1 Semiconductor Modeling and Simulation Market Size & Forecast, By Component, 2021 – 2032
9.5.6.3.2 Semiconductor Modeling and Simulation Market Size & Forecast, By Application, 2021 – 2032
9.5.6.3.3 Semiconductor Modeling and Simulation Market Size & Forecast, By Deployment Mode, 2021 – 2032
9.5.6.3.4 Semiconductor Modeling and Simulation Market Size & Forecast, By End-User, 2021 – 2032
9.5.6.4 Colombia
9.5.6.4.1 Semiconductor Modeling and Simulation Market Size & Forecast, By Component, 2021 – 2032
9.5.6.4.2 Semiconductor Modeling and Simulation Market Size & Forecast, By Application, 2021 – 2032
9.5.6.4.3 Semiconductor Modeling and Simulation Market Size & Forecast, By Deployment Mode, 2021 – 2032
9.5.6.4.4 Semiconductor Modeling and Simulation Market Size & Forecast, By End-User, 2021 – 2032
9.5.6.5 Rest of Latin America
9.5.6.5.1 Semiconductor Modeling and Simulation Market Size & Forecast, By Component, 2021 – 2032
9.5.6.5.2 Semiconductor Modeling and Simulation Market Size & Forecast, By Application, 2021 – 2032
9.5.6.5.3 Semiconductor Modeling and Simulation Market Size & Forecast, By Deployment Mode, 2021 – 2032
9.5.6.5.4 Semiconductor Modeling and Simulation Market Size & Forecast, By End-User, 2021 – 2032
9.6 Middle East & Africa
9.6.1 Key Trends
9.6.2 Semiconductor Modeling and Simulation Market Size & Forecast, By Component, 2021 – 2032
9.6.3 Semiconductor Modeling and Simulation Market Size & Forecast, By Application, 2021 – 2032
9.6.4 Semiconductor Modeling and Simulation Market Size & Forecast, By Deployment Mode, 2021 – 2032
9.6.5 Semiconductor Modeling and Simulation Market Size & Forecast, By End-User, 2021 – 2032
9.6.6 Semiconductor Modeling and Simulation Market Size & Forecast, By Country, 2021 – 2032
9.6.6.1 UAE
9.6.6.1.1 Semiconductor Modeling and Simulation Market Size & Forecast, By Component, 2021 – 2032
9.6.6.1.2 Semiconductor Modeling and Simulation Market Size & Forecast, By Application, 2021 – 2032
9.6.6.1.3 Semiconductor Modeling and Simulation Market Size & Forecast, By Deployment Mode, 2021 – 2032
9.6.6.1.4 Semiconductor Modeling and Simulation Market Size & Forecast, By End-User, 2021 – 2032
9.6.6.2 Saudi Arabia
9.6.6.2.1 Semiconductor Modeling and Simulation Market Size & Forecast, By Component, 2021 – 2032
9.6.6.2.2 Semiconductor Modeling and Simulation Market Size & Forecast, By Application, 2021 – 2032
9.6.6.2.3 Semiconductor Modeling and Simulation Market Size & Forecast, By Deployment Mode, 2021 – 2032
9.6.6.2.4 Semiconductor Modeling and Simulation Market Size & Forecast, By End-User, 2021 – 2032
9.6.6.3 Qatar
9.6.6.3.1 Semiconductor Modeling and Simulation Market Size & Forecast, By Component, 2021 – 2032
9.6.6.3.2 Semiconductor Modeling and Simulation Market Size & Forecast, By Application, 2021 – 2032
9.6.6.3.3 Semiconductor Modeling and Simulation Market Size & Forecast, By Deployment Mode, 2021 – 2032
9.6.6.3.4 Semiconductor Modeling and Simulation Market Size & Forecast, By End-User, 2021 – 2032
9.6.6.4 Egypt
9.6.6.4.1 Semiconductor Modeling and Simulation Market Size & Forecast, By Component, 2021 – 2032
9.6.6.4.2 Semiconductor Modeling and Simulation Market Size & Forecast, By Application, 2021 – 2032
9.6.6.4.3 Semiconductor Modeling and Simulation Market Size & Forecast, By Deployment Mode, 2021 – 2032
9.6.6.4.4 Semiconductor Modeling and Simulation Market Size & Forecast, By End-User, 2021 – 2032
9.6.6.5 South Africa
9.6.6.5.1 Semiconductor Modeling and Simulation Market Size & Forecast, By Component, 2021 – 2032
9.6.6.5.2 Semiconductor Modeling and Simulation Market Size & Forecast, By Application, 2021 – 2032
9.6.6.5.3 Semiconductor Modeling and Simulation Market Size & Forecast, By Deployment Mode, 2021 – 2032
9.6.6.5.4 Semiconductor Modeling and Simulation Market Size & Forecast, By End-User, 2021 – 2032
9.6.6.6 Rest of Middle East & Africa
9.6.6.6.1 Semiconductor Modeling and Simulation Market Size & Forecast, By Component, 2021 – 2032
9.6.6.6.2 Semiconductor Modeling and Simulation Market Size & Forecast, By Application, 2021 – 2032
9.6.6.6.3 Semiconductor Modeling and Simulation Market Size & Forecast, By Deployment Mode, 2021 – 2032
9.6.6.6.4 Semiconductor Modeling and Simulation Market Size & Forecast, By End-User, 2021 – 2032
10. Competitive Landscape
10.1 Key Players' Positioning
10.2 Competitive Developments
10.2.1 Key Strategies Adopted (%), By Key Players, 2024
10.2.2 Year-Wise Strategies & Development, 2021 – 2025
10.2.3 Number Of Strategies Adopted By Key Players, 2024
10.3 Market Share Analysis, 2024
10.4 Product/Service & Application Benchmarking
10.4.1 Product/Service Specifications & Features By Key Players
10.4.2 Product/Service Heatmap By Key Players
10.4.3 Application Heatmap By Key Players
10.5 Industry Start-Up & Innovation Landscape
10.6 Key Company Profiles
10.6.1 Synopsys Inc.
10.6.1.1 Company Overview & Snapshot
10.6.1.2 Product/Service Portfolio
10.6.1.3 Key Company Financials
10.6.1.4 SWOT Analysis
10.6.2 Cadence Design Systems Inc.
10.6.2.1 Company Overview & Snapshot
10.6.2.2 Product/Service Portfolio
10.6.2.3 Key Company Financials
10.6.2.4 SWOT Analysis
10.6.3 ANSYS Inc.
10.6.3.1 Company Overview & Snapshot
10.6.3.2 Product/Service Portfolio
10.6.3.3 Key Company Financials
10.6.3.4 SWOT Analysis
10.6.4 Mentor Graphics Corporation
10.6.4.1 Company Overview & Snapshot
10.6.4.2 Product/Service Portfolio
10.6.4.3 Key Company Financials
10.6.4.4 SWOT Analysis
10.6.5 Silvaco Inc.
10.6.5.1 Company Overview & Snapshot
10.6.5.2 Product/Service Portfolio
10.6.5.3 Key Company Financials
10.6.5.4 SWOT Analysis
10.6.6 Altair Engineering Inc.
10.6.6.1 Company Overview & Snapshot
10.6.6.2 Product/Service Portfolio
10.6.6.3 Key Company Financials
10.6.6.4 SWOT Analysis
10.6.7 Dassault Systèmes SE
10.6.7.1 Company Overview & Snapshot
10.6.7.2 Product/Service Portfolio
10.6.7.3 Key Company Financials
10.6.7.4 SWOT Analysis
10.6.8 Siemens PLM Software
10.6.8.1 Company Overview & Snapshot
10.6.8.2 Product/Service Portfolio
10.6.8.3 Key Company Financials
10.6.8.4 SWOT Analysis
10.6.9 Keysight Technologies Inc.
10.6.9.1 Company Overview & Snapshot
10.6.9.2 Product/Service Portfolio
10.6.9.3 Key Company Financials
10.6.9.4 SWOT Analysis
10.6.10 COMSOL Inc.
10.6.10.1 Company Overview & Snapshot
10.6.10.2 Product/Service Portfolio
10.6.10.3 Key Company Financials
10.6.10.4 SWOT Analysis
10.6.11 Aspen Technology Inc.
10.6.11.1 Company Overview & Snapshot
10.6.11.2 Product/Service Portfolio
10.6.11.3 Key Company Financials
10.6.11.4 SWOT Analysis
10.6.12 MathWorks Inc.
10.6.12.1 Company Overview & Snapshot
10.6.12.2 Product/Service Portfolio
10.6.12.3 Key Company Financials
10.6.12.4 SWOT Analysis
10.6.13 Lam Research Corporation
10.6.13.1 Company Overview & Snapshot
10.6.13.2 Product/Service Portfolio
10.6.13.3 Key Company Financials
10.6.13.4 SWOT Analysis
10.6.14 Applied Materials Inc.
10.6.14.1 Company Overview & Snapshot
10.6.14.2 Product/Service Portfolio
10.6.14.3 Key Company Financials
10.6.14.4 SWOT Analysis
10.6.15 GlobalFoundries Inc.
10.6.15.1 Company Overview & Snapshot
10.6.15.2 Product/Service Portfolio
10.6.15.3 Key Company Financials
10.6.15.4 SWOT Analysis
10.6.16 Intel Corporation
10.6.16.1 Company Overview & Snapshot
10.6.16.2 Product/Service Portfolio
10.6.16.3 Key Company Financials
10.6.16.4 SWOT Analysis
10.6.17 Samsung Electronics Co. Ltd.
10.6.17.1 Company Overview & Snapshot
10.6.17.2 Product/Service Portfolio
10.6.17.3 Key Company Financials
10.6.17.4 SWOT Analysis
10.6.18 Taiwan Semiconductor Manufacturing Company Limited (TSMC)
10.6.18.1 Company Overview & Snapshot
10.6.18.2 Product/Service Portfolio
10.6.18.3 Key Company Financials
10.6.18.4 SWOT Analysis
10.6.19 NVIDIA Corporation
10.6.19.1 Company Overview & Snapshot
10.6.19.2 Product/Service Portfolio
10.6.19.3 Key Company Financials
10.6.19.4 SWOT Analysis
10.6.20 Broadcom Inc.
10.6.20.1 Company Overview & Snapshot
10.6.20.2 Product/Service Portfolio
10.6.20.3 Key Company Financials
10.6.20.4 SWOT Analysis
11. Analyst Recommendations
11.1 SNS Insider Opportunity Map
11.2 Industry Low-Hanging Fruit Assessment
11.3 Market Entry & Growth Strategy
11.4 Analyst Viewpoint & Suggestions On Market Growth
12. Assumptions
13. Disclaimer
14. Appendix
14.1 List Of Tables
14.2 List Of Figures
Key Segmentation
By Component
-
Software
-
Hardware
-
Services
By Application
-
Consumer Electronics
-
Automotive
-
Aerospace and Defense
-
Industrial
-
Healthcare
-
Others
By Deployment Mode
-
On-Premises
-
Cloud
By End-User
-
BFSI
-
IT and Telecommunications
-
Manufacturing
-
Others
Request for Segment Customization as per your Business Requirement: Segment Customization Request
Regional Coverage:
North America
-
US
-
Canada
Europe
-
Germany
-
UK
-
France
-
Italy
-
Spain
-
Russia
-
Poland
-
Rest of Europe
Asia Pacific
-
China
-
India
-
Japan
-
South Korea
-
Australia
-
ASEAN Countries
-
Rest of Asia Pacific
Middle East & Africa
-
UAE
-
Saudi Arabia
-
Qatar
-
South Africa
-
Rest of Middle East & Africa
Latin America
-
Brazil
-
Argentina
-
Mexico
-
Colombia
-
Rest of Latin America
Request for Country Level Research Report: Country Level Customization Request
Available Customization
With the given market data, SNS Insider offers customization as per the company’s specific needs. The following customization options are available for the report:
-
Detailed Volume Analysis
-
Criss-Cross segment analysis (e.g. Product X Application)
-
Competitive Product Benchmarking
-
Geographic Analysis
-
Additional countries in any of the regions
-
Customized Data Representation
-
Detailed analysis and profiling of additional market player
An accurate research report requires proper strategizing as well as implementation. There are multiple factors involved in the completion of good and accurate research report and selecting the best methodology to compete the research is the toughest part. Since the research reports we provide play a crucial role in any company’s decision-making process, therefore we at SNS Insider always believe that we should choose the best method which gives us results closer to reality. This allows us to reach at a stage wherein we can provide our clients best and accurate investment to output ratio.
Each report that we prepare takes a timeframe of 350-400 business hours for production. Starting from the selection of titles through a couple of in-depth brain storming session to the final QC process before uploading our titles on our website we dedicate around 350 working hours. The titles are selected based on their current market cap and the foreseen CAGR and growth.
The 5 steps process:
Step 1: Secondary Research:
Secondary Research or Desk Research is as the name suggests is a research process wherein, we collect data through the readily available information. In this process we use various paid and unpaid databases which our team has access to and gather data through the same. This includes examining of listed companies’ annual reports, Journals, SEC filling etc. Apart from this our team has access to various associations across the globe across different industries. Lastly, we have exchange relationships with various university as well as individual libraries.

Step 2: Primary Research
When we talk about primary research, it is a type of study in which the researchers collect relevant data samples directly, rather than relying on previously collected data. This type of research is focused on gaining content specific facts that can be sued to solve specific problems. Since the collected data is fresh and first hand therefore it makes the study more accurate and genuine.
We at SNS Insider have divided Primary Research into 2 parts.
Part 1 wherein we interview the KOLs of major players as well as the upcoming ones across various geographic regions. This allows us to have their view over the market scenario and acts as an important tool to come closer to the accurate market numbers. As many as 45 paid and unpaid primary interviews are taken from both the demand and supply side of the industry to make sure we land at an accurate judgement and analysis of the market.
This step involves the triangulation of data wherein our team analyses the interview transcripts, online survey responses and observation of on filed participants. The below mentioned chart should give a better understanding of the part 1 of the primary interview.

Part 2: In this part of primary research the data collected via secondary research and the part 1 of the primary research is validated with the interviews from individual consultants and subject matter experts.
Consultants are those set of people who have at least 12 years of experience and expertise within the industry whereas Subject Matter Experts are those with at least 15 years of experience behind their back within the same space. The data with the help of two main processes i.e., FGDs (Focused Group Discussions) and IDs (Individual Discussions). This gives us a 3rd party nonbiased primary view of the market scenario making it a more dependable one while collation of the data pointers.
Step 3: Data Bank Validation
Once all the information is collected via primary and secondary sources, we run that information for data validation. At our intelligence centre our research heads track a lot of information related to the market which includes the quarterly reports, the daily stock prices, and other relevant information. Our data bank server gets updated every fortnight and that is how the information which we collected using our primary and secondary information is revalidated in real time.

Step 4: QA/QC Process
After all the data collection and validation our team does a final level of quality check and quality assurance to get rid of any unwanted or undesired mistakes. This might include but not limited to getting rid of the any typos, duplication of numbers or missing of any important information. The people involved in this process include technical content writers, research heads and graphics people. Once this process is completed the title gets uploader on our platform for our clients to read it.
Step 5: Final QC/QA Process:
This is the last process and comes when the client has ordered the study. In this process a final QA/QC is done before the study is emailed to the client. Since we believe in giving our clients a good experience of our research studies, therefore, to make sure that we do not lack at our end in any way humanly possible we do a final round of quality check and then dispatch the study to the client.