Ship-to-Shore (STS) Cranes Market Report Scope & Overview:
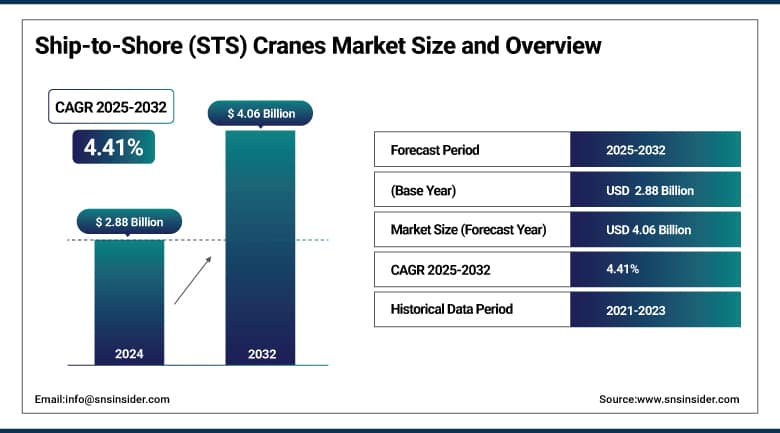
The Ship-to-Shore (STS) Cranes Market size was valued at USD 2.88 billion in 2024 and is expected to reach USD 4.06 billion by 2032, growing at a CAGR of 4.41% over the forecast period of 2025-2032.
The Ship-to-Shore (STS) Cranes Market, also known as the Container Crane Market, is a vital segment of the Port Terminal Handling Equipment industry, enabling the transfer of containers between vessels and terminals with high speed and precision. As global shipping volumes continue to rise, the demand for efficient, high-capacity STS cranes has grown significantly. The market is being shaped by technological advancements, such as automation, remote operation, and AI-based monitoring systems, which are enhancing crane productivity and reducing downtime.
Key Ship-to-Shore (STS) Cranes Market trends include the integration of energy-efficient systems, electrification, and the adoption of smart diagnostics for predictive maintenance. The shift toward eco-friendly and low-emission port equipment is also influencing new crane designs and retrofitting projects. Driven by the need to boost port throughput and reduce operational costs, terminal operators are increasingly investing in next-generation STS cranes. Strong Ship-to- Shore (STS) Crane Market expansion driven by these innovations helps to establish the segment as pillar of modern container logistics. The STS cranes sector is expected to be a vital part in the development of smart and intelligent port operations given constant innovation and growing trade pressures globally.
In January 2025, Contract talks resumed between the U.S. port workers and employers, centering on automation at East and Gulf Coast ports. The ILA seeks to reverse earlier allowances for semi-automated cranes, citing job losses, while the USMX defends automation as key to port competitiveness. With a January 15 deadline, a strike could disrupt over half of the U.S. container imports.
In June 2025, in an interview with WorldCargo News, Robert Taylor, President of Taylor Group, emphasized the growing push for zero-emission equipment and strengthening the U.S.-based manufacturing in the port sector. He discussed the successful deployment of a Taylor electric top handler at Yusen Terminals in Los Angeles. Taylor highlighted the environmental benefits of such innovations and stressed the need for policy support, including tariff considerations, to boost domestic production and competitiveness.
To Get More Information On Ship-to-Shore (STS) Cranes Market - Request Free Sample Report
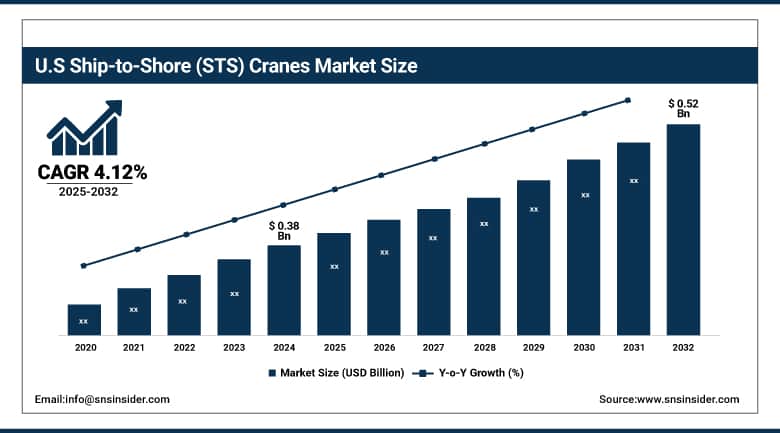
The U.S. Dominates the North American STS Cranes Market with a value of USD 0.38 billion in 2024, expected to reach USD 0.52 billion by 2032 at a CAGR of 4.12%. Port modernization plans, adoption of automation, and investment in infrastructure are some of the key factors driving growth. Its position is further solidified by strong cargo volumes and supportive policy.
Ship-to-Shore Cranes Market Dynamics:
Drivers:
-
Automation and AI-Driven Innovation Revolutionize Ship-to-Shore Cranes, Enhancing Port Efficiency and Sustainability
The Ship-to-Shore (STS) Cranes Market is being influenced by technological innovation and automation. The semi-and fully automated cranes, with their AI-enabled-technology and remote-control tech, are changing port operations to be faster, safer and more precise. Such systems enable predictive maintenance to aid reduce equipment downtime and ensure minimum performance. In addition, automation leads to reduced reliance on manpower and streamlines energy consumption, which lowers operational costs. Real-time data analytics also come into play with ports adopting smart STS cranes, allowing for smarter decisions and improved efficiency overall. These innovations can be right on course with the sustainability goals of the rest of the world, with electric versions and hybrid models offering even lower emissions. Automation is quickly becoming a crucial element for the world maritime logistics chain, especially when ports are modernized either to increase the productivity or the global competitiveness of the port installations.
Restraints:
-
High Capital and Maintenance Costs Hinder STS Crane Adoption due to Expensive Technology and Skilled Labor Requirements
Ship-to-Shore (STS) cranes are high-cost equipment, not just in purchase, but also in maintenance, and these high capital investment and maintenance costs do restrain the Ship-to-Shore (STS) cranes market. The procurement of the advanced, automated cranes is a large capital expenditure, forcing port authorities to reallocate budgets and, in some cases, suspend operations as they install or upgrade. This can lead to disruption of port schedules and lowered short-term profitability.
Furthermore, the advanced STS cranes have complicated machines in order to use modern technology, and have made significant leaps and bounds by using Robotics, artificial intelligence, and remote access. These systems require specialized tools and highly skilled technicians to maintain them, thus increasing operational costs. This total cost of ownership is further compounded by the need to constantly train and maintain support infrastructure at ports. Specifically for ports in developing regions with constrained budgets, these financial and technical burdens may slow adoption efforts at scale.
Ship-to-Shore Cranes Market Segmentation Outlook:
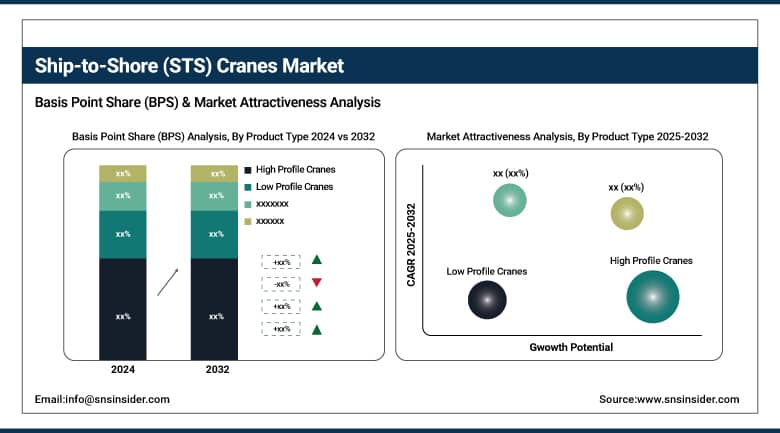
By Product Type
The High-profile STS cranes segment dominated the market and accounted for 66% of the Ship-to-Shore (STS) Cranes Market share. A vital aspect of this dominance comes from their wide use in deep-water ports and terminals that see heavy container ship traffic. Accommodating bigger vessels, such as Ultra Large Container Vessels (ULCVs), these cranes ensure maximum clearance and find their place in global trade hubs. These high-profile models are fast gaining favor for scalability, efficient working profile, and extended operational reach, and are being adopted at ports with capacity expansions and upgrades, especially in major ports in the Asia Pacific, Europe, and North America.
Low-profile STS cranes are the fastest-growing segment due to their rising adoption in airports and terminals near airfields, where height restrictions apply. These cranes provide comparable container-handling capabilities without violating aviation safety regulations. Smaller ports adding infrastructure that enables increased container throughput without major redesign-assisted restructuring also undergirds their growth. In addition, the advancements in low-profile crane designs and investments in space-constrained terminals in land and coastal locations make low-profile cranes gain traction.
By Power Supply
The electric segment dominated with a market share of over 58% of the total. The ascendancy of this is mainly in response to the global sustainable port operation and emission reduction efforts. By reducing dependency on fumy fossil fuels, lowering maintenance costs, and meeting stricter regulations in places where EVs are a soft requirement on local and state levels, electrification offers numerous benefits. The majority of these most developed ports in the EU, East Asia, and North America are already shifting from diesel-based cranes to electric ones as part of their going green port campaign and carbon neutrality target.
Despite the dominance of electric models, diesel STS cranes are the fastest-growing segment, particularly in developing regions with limited access to high-voltage shore power infrastructure. The operational flexibility, along with low capital expenditure on installation, offered by diesel cranes makes them an attractive choice for small and mid-sized ports. Short of full electrification, improvements in fuel economy and hybrid engine designs also make them relevant in markets where we may not see full electrification for either financial or technical reasons in the time to come.
By Outreach
The 40m to 49m outreach segment led the STS crane market in 2024 with a 64% share. This range provides a good transformational balance for most of the widely used Panamax and Post-Panamax ships. This is preferred by terminals targeting medium-capacity operations, as this comes with lower investment and maintenance costs than larger outreach models. These cranes provide ample amount of horizontal reach, considering complexity and energy consumption to operate, which makes them emerge as popular across both emerging as well standard ports.
STS cranes with 50m to 60m outreach are witnessing the fastest growth as global trade increasingly shifts toward handling larger vessels including the New Panamax and ULCVs. Hence, mega ports and transshipment hubs are quickly upgrading all their infrastructure for bigger TEU sizes. This demand is being driven in the high-density trade corridors, such as the Asia-Europe and Asia-North America routes, by the necessity for broadened outreach to accommodate the larger vessels without repositioning.
By Lifting Capacity
Super-Post Panamax cranes dominated the lifting capacity segment in 2024, with a 48% market share. This makes them indispensable at modern ports, where they are able to handle the largest container ships with high stacking heights and wide beams. These cranes are favored by global terminals for their ability to load/unload multiple containers in one cycle, thereby increasing turnaround and operational efficiency. This supremacy is further strengthened by the extension of port infrastructure throughout China, the UAE, and Europe.
Panamax STS cranes are the fastest-growing segment, primarily driven by port upgrades in Latin America, Southeast Asia, and Africa. They are well-suited to ports that handle midsized ships, but are still important in regional trade. With governments and private operators pouring money into low-cost modernization to boost throughput, Panamax cranes provide an attractive capacity-to-cost ratio. The rising adoption of these options within second-tier ports indicates a movement to distributed cargo flow and the safe decongesting of mega-hubs.
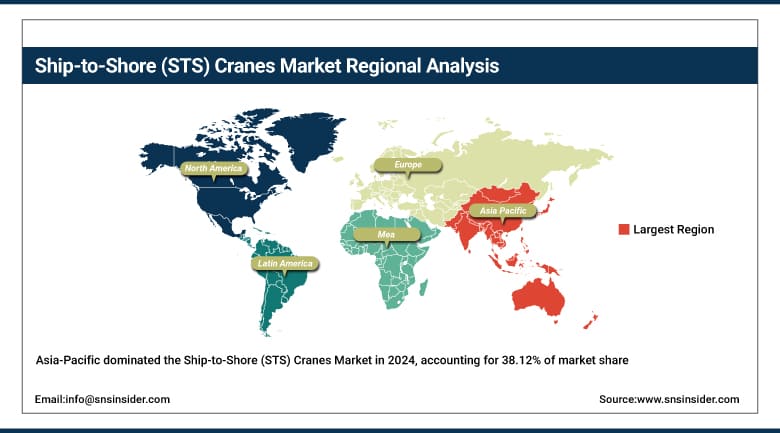
Ship-to-Shore Cranes Market Regional Analysis:
In 2024, the Asia-Pacific region dominated the global Ship-to-Shore (STS) cranes market with a market share of 38.12%, driven by ongoing container port expansion, growing seaborne trade, and infrastructure upgrades primarily in China, India, Japan, and Southeast Asia. Due to growing government funding towards port modernization & automation, the region also stands as the fastest-growing, especially in high-traffic ports such as Singapore, Busan & Shanghai. With rapidly growing demand for automated container handling solutions and also the presence of a strong domestic manufacturing base, Asia-Pacific not only maintained its position as the leading market, but also emerged as the fastest-growing region during the forecast period.
China is the dominant and fastest-growing country within the Asia-Pacific STS cranes market. This leadership is a result of its enormous cargo handling capacities at ports including Shanghai, Ningbo-Zhoushan, and Shenzhen, supported by significant domestic manufacturing, such as ZPMC companies. Demand for STS cranes remains from the Chinese Belt and Road Initiative, high export volume, and port infrastructure investments led by the government.
Get Customized Report as Per Your Business Requirement - Enquiry Now
North America holds a significant share in the global STS cranes market, supported by technological advancements, a high rate of port automation, and strong trade volumes at ports such as Los Angeles, Long Beach, and New York. Due to strict environmental regulations in the region, energy-efficient and zero-emission crane systems are in focus. In addition, the U.S. enjoys domestic manufacturing backing and ongoing modernization initiatives. But market growth is weak relative to that in Asia-Pacific because of a power infrastructure clearing the way. Still, massive capital investments to upgrade legacy systems remain a true ticket to a steady, substantial market share for North America, and a reliable seat holder at the top of the global marketplace.
Ship-to-Shore (STS) Cranes Companies are:
-
Cargotec
-
ANUPAM-MHI Industries Limited
-
Shanghai Zhenhua Heavy Industries Co., Ltd.
-
PACECO CORP.
-
Liebherr-International AG
-
Konecranes
-
Sany Group
-
Hyundai Samho Heavy Industries Co., Ltd.
Recent Developments:
- In October 2024 - Henan Weihua Heavy Machinery Co., LTD. - was recognized as one of the key STS crane manufacturers in global market summaries, highlighting its role as a major producer in Asia. However, no official news releases or project-specific announcements were reported during that time.
| Report Attributes | Details |
|---|---|
| Market Size in 2024 | USD 2.88 Billion |
| Market Size by 2032 | USD 4.06 Billion |
| CAGR | CAGR of 4.41% From 2025 to 2032 |
| Base Year | 2024 |
| Forecast Period | 2025-2032 |
| Historical Data | 2021-2023 |
| Report Scope & Coverage | Market Size, Segments Analysis, Competitive Landscape, Regional Analysis, DROC & SWOT Analysis, Forecast Outlook |
| Key Segments | • By Product Type (High Profile Cranes, Low Profile Cranes) • By Power Supply (Diesel, Electric, Hybrid) • By Outreach (Up to 40m, 40m to 49m, 50m to 60m, Greater than 60m) • By Lifting Capacity (Panamax STS Cranes, Post Panamax STS Cranes, Super-Post Panamax STS Cranes) |
| Regional Analysis/Coverage | North America (US, Canada, Mexico), Europe (Germany, France, UK, Italy, Spain, Poland, Turkey, Rest of Europe), Asia Pacific (China, India, Japan, South Korea, Singapore, Australia, Rest of Asia Pacific), Middle East & Africa (UAE, Saudi Arabia, Qatar, South Africa, Rest of Middle East & Africa), Latin America (Brazil, Argentina, Rest of Latin America) |
| Company Profiles | Doosan Corporation (South Korea), Cargotec (Kalmar) (Finland), ANUPAM-MHI Industries Limited (India), Shanghai Zhenhua Heavy Industries Co., Ltd. (ZPMC) (China), PACECO CORP. (U.S.), Liebherr-International AG (Switzerland), Konecranes (Finland), Sany Group (China), Henan Weihua Heavy Machinery Co., LTD., HYUNDAI SAMHO HEAVY INDUSTRIES CO., LTD. |
Frequently Asked Questions
Ans: The Asia-Pacific region dominated the Ship-to-Shore (STS) Cranes Market in 2024.
Ans: The “High-profile” segment dominated the Ship-to-Shore (STS) Cranes Market.
Ans: Automation and AI-Driven Innovation Revolutionize Ship-to-Shore Cranes, Enhancing Port Efficiency and Sustainability
Ans: The Ship-to-Shore (STS) Cranes Market was USD 2.88 billion in 2024 and is expected to reach USD 4.06 billion by 2032.
Ans: The Ship-to-Shore (STS) Cranes Market is expected to grow at a CAGR of 4.41% from 2025 to 2032.
Get in Touch
