Team Collaboration Software Market Size & Overview:
Get more infromation on Team Collaboration Software Market - Request Sample Report
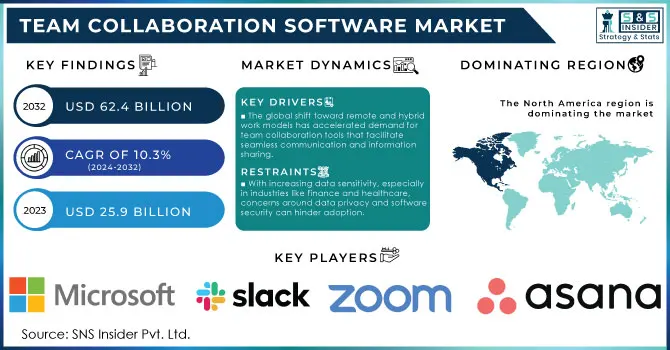
Team Collaboration Software Market Size was valued at USD 25.9 Billion in 2023 and is expected to reach USD 62.4 Billion by 2032 and grow at a CAGR of 10.3% over 2024-2032
The global team collaboration software market has seen robust growth, largely fueled by the ongoing shift to digital workspaces and increasing reliance on remote collaboration solutions. With governments around the world driving sectors to transform digitally, work from home has led us to an increase in the use of collaboration software. As an example, a report from the U.S. Department of Commerce noted that in 2023 alone remote work in public and private sectors rose by 36% which drastically increased the need for team collaboration solutions. Additionally, the European Union’s “Digital Europe Programme” allocated €7.5 billion (2021-2027) for advancing digital skills and technologies, including tools for secure, efficient collaboration. The rise of stringent cybersecurity standards and government mandates regarding data security has supported the growth of secure collaboration solutions in the market. Additionally, increasing internet penetration and the use of mobile devices have contributed to its proliferation across the globe, with the International Telecommunications Union (ITU) reporting that over 66% of the global population was online by 2023, creating new opportunities for team collaboration software.
Advanced technologies are essential for fostering a creative, goal-oriented workplace that drives lasting economic value. Digital transformation is creating new opportunities for product and service innovation, driving revenue growth, and ultimately enhancing performance that can lower costs. High impact and dynamic collaboration as a pillar of productivity next-gen collaboration productivity tools are pivotal to establishing effective communication channels, co-creation with real-time, and richer team interactions & document sharing. Machine Learning (ML) is one such technology that allows proper communication management and collaboration of teams. This is why big players are rolling out enhanced work environments. Asana originally launched Asana Flow in Feb. 2022, as part of a suite to help businesses accelerate and optimize their workflows. Business Collaboration Tools that encompass email, calendars, video conferencing, and so on enhance team connectivity and productivity, with usage expected to grow rapidly in the coming years.
Team Collaboration Software Market dynamics
Drivers
-
The global shift toward remote and hybrid work models has accelerated demand for team collaboration tools that facilitate seamless communication and information sharing.
-
Cloud-based collaboration software is increasingly popular due to its scalability, lower costs, and easy accessibility, which are ideal for diverse work settings.
-
Real-time messaging, video conferencing, and file-sharing capabilities are in high demand as businesses aim to streamline communication.
The growing adoption of remote and hybrid working modes drives the team collaboration software market. As the world settles into a post-pandemic flexible workforce, collaboration tools will be vital to ensure connectivity and productivity so that teams can thrive. For instance, a recent report indicated that in 2023, 59% of U.S. workers preferred hybrid work arrangements, and 35% of employees favored full-time remote work. As a reaction, the requirement for equipment that allows seamless communications with teamwork regardless of exact location grew to become even more significant.
The adoption of collaboration software like Microsoft Teams or Zoom and Slack Slack has seen rapid adoption. For example, Microsoft Teams reported over 300 million monthly active users in 2023, an increase driven by the integration of video conferencing, document sharing, and real-time messaging. The platform used in this manner spans several sectors, including education, healthcare, and finance; enabling geographically dispersed project teams to work together effectively. Another popular tool, Slack, is favored by companies with remote teams due to its intuitive, organized channel system and integrations with various productivity tools. Mercer predicted no slowing down in the Asia-Pacific region, either, as firms across nations such as India and Japan embrace digital tools to facilitate working from home. This trend highlights the importance of collaboration software as businesses adapt to a modern, agile working environment.
Restraints:
-
Implementing advanced collaboration platforms, especially for small and medium enterprises, can be cost-prohibitive due to software costs and infrastructure requirements.
-
With increasing data sensitivity, especially in industries like finance and healthcare, concerns around data privacy and software security can hinder adoption.
Security and privacy concerns is a key factor restraining the growth of the global team collaboration software market. With organizations utilizing digital solutions for their communications and information exchanges, they become targets of data leakages, unauthorized access, and legal violations with regard to data regulations. Since online collaboration software typically requires users to share sensitive information, they are appealing targets for cyberattacks. For data-sensitive industries, like finance, healthcare, and the legal sector, these concerns are particularly pertinent. Moreover, regulatory rules such as the GDPR in Europe set high standards for processing, storing and sharing information concerning users. It is also essential for companies to make sure that all their collaboration tools are loaded with strong security protocols, including encrypted services and multi-factor authentication for better data integrity and user privacy. However, implementing these features can increase costs and complexity, slowing adoption rates for businesses wary of these risks.
Team Collaboration Software Market Segment analysis
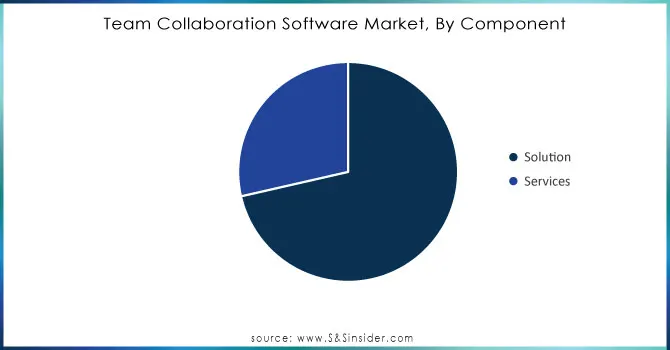
By Component
The market was dominated by the solution segment in 2023, with about 61% of the global revenue share. This trend can be attributed to the expanding capabilities of software solutions that integrate messaging, video conferencing, project management, and file-sharing features. Demand for such all-in-one solutions has been spurred by a government push to drive productivity and operational efficiencies within the digital workplace through tools. Data from the European Commission reveals that more than 45% of firms in Europe used cloud-based team collaboration solutions in 2023, thanks to regulatory support for digitalization. Technological advancements in Artificial Intelligence (AI) and Machine Learning (ML), which were integrated into the marketing automation solution segment such as automated transcription, predictive messaging, and data analytics to improve team productivity when used by an organization are further driving the growth of this market segment. Moreover, governments prioritizing cybersecurity has triggered software providers to integrate strong security functionalities and vice versa-specific industry verticals like Healthcare and Finance that demand high-security infrastructure.
Need any customization research on Team Collaboration Software Market - Enquiry Now
By Enterprise Size
In 2023 the large enterprises segment dominated the market and held 68% share of revenue. The demand is being fueled by the needs of large corporations with complex operations and substantial budgets to implement sophisticated software solutions. Numerous government initiatives support and compel large enterprises to digitize workflows, particularly for cross-border cooperation and project collaboration. For example, the U.S. Department of Labor reported that large enterprise collaboration software purchasing increased 25% year on year due to remote working policies. In addition, the regulations by the European Union regarding cross-border data-sharing call for secure and trustworthy collaboration solutions for multinational enterprises. This segment is expected to be responsible for a considerable portion of revenue over the foreseeable future, as large organizations are more inclined towards adopting customizable and secure team collaboration solutions with specific requirements, including integrated security, compliance features, and scalability.
By End-User
The team collaboration software market was led by the IT and telecommunications sector in 2023, owing to the frequent and seamless communication requirements of this sector. As the need for remote and hybrid work models flourished, the sector has been at the forefront of adopting team collaboration solutions. This vertical has also witnessed growth due to government incentives towards digital infrastructure expansion. The latest report from the International Telecommunications Union (ITU) found that this year, software adoption rates across telecommunications sectors rose by 32% as firms shifted to digital collaboration tools to optimize processes and improve customer experience. Secondly, sophisticated collaboration platforms have also become requisite due to IT and telecommunications companies pushing regulatory compliance in data security and privacy.
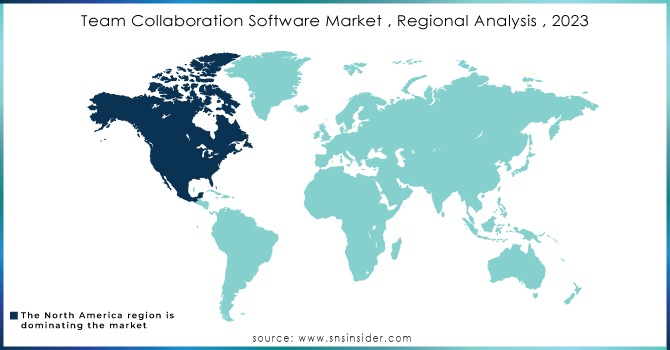
Team Collaboration Software Market Regional Analysis
North America held the largest share of the team collaboration software market in 2023, due to high adoption levels in the U.S. and Canada owing to early investments in digital transformation activities. The North American digitally-enabled workplace market is leading the overall digitally-enabled workplace with over 34% share of the total global market due in part to high internet penetration and supported government matters related to digital workspace tool adoption have been expected to boost industry growth. The plethora of large enterprises in the region, along with the presence of most major tech companies, are the biggest contributors to market growth as these firms continue innovating and rolling out collaborative solutions.
In contrast, Asia-Pacific (APAC) is the fastest-growing region with a significant compound annual growth rate (CAGR), bolstered by government initiatives aimed at developing digital infrastructure. A good example is India pursuing its Digital India program and Japan driving forward with its Society 5.0 programme laying down the requirements for strong digital capabilities across domains. In 2023, the APAC region accounted significant market share with a robust potential for growth as enterprises invest in agile collaboration tools to accommodate remote and in-office workers.
Recent Developments in the Team Collaboration Software Market
-
In August 2024, Microsoft revealed that its Teams surface would see the incorporation of AI-driven functionalities including automatic transcriptions and translations, along with enhanced predictive analytics for business users.
-
Atlassian Corporation announces plans to acquire Loom, a video messaging platform that allows users to easily incorporate video messages into workflows on Jira and Confluence In October 2023
-
In May 2023, TeamViewer further strengthened its presence in the Asia-Pacific by launching a new office in Mumbai, reaffirming its commitment to India and growing with the region.
Key Players
Key Service Providers/Manufacturers:
-
Microsoft Corporation (Microsoft Teams, SharePoint)
-
Slack Technologies, LLC (Slack, Workflow Builder)
-
Zoom Video Communications, Inc. (Zoom Meetings, Zoom Chat)
-
Cisco Systems, Inc. (Webex, Jabber)
-
Asana, Inc. (Asana, Asana Flow)
-
Google LLC (Google Workspace, Google Meet)
-
Adobe Inc. (Adobe Connect, Acrobat)
-
Salesforce.com, Inc. (Slack, Quip)
-
Atlassian Corporation Plc (Trello, Confluence)
-
Zoho Corporation (Zoho Projects, Zoho Cliq)
Key Users of Team Collaboration Software Products:
-
Amazon
-
Walmart Inc.
-
Ford Motor Company
-
Procter & Gamble Co.
-
Johnson & Johnson
-
Unilever
-
Goldman Sachs Group, Inc.
-
Pfizer Inc.
-
Deutsche Bank AG
-
Nestlé S.A.
| Report Attributes | Details |
| Market Size in 2023 | US$ 25.9 Bn |
| Market Size by 2032 | US$ 62.4 Bn |
| CAGR | CAGR of 10.3% From 2024 to 2032 |
| Base Year | 2023 |
| Forecast Period | 2024-2032 |
| Historical Data | 2020-2022 |
| Report Scope & Coverage | Market Size, Segments Analysis, Competitive Landscape, Regional Analysis, DROC & SWOT Analysis, Forecast Outlook |
| Key Segments | • By Component (Solution, Services) • By Enterprise Size (Small & Medium-sized Enterprises, Large Enterprises) • By Deployment (Cloud, On-premise) • By Software Type (Conferencing Software, Communication & Coordination Software) • By End-User (Banking, Financial Services and Insurance, IT and Telecommunications, Manufacturing, Retail and Consumer Goods, Healthcare, Transportation and Logistics, Education, Others) |
| Regional Analysis/Coverage | North America (US, Canada, Mexico), Europe (Eastern Europe [Poland, Romania, Hungary, Turkey, Rest of Eastern Europe] Western Europe] Germany, France, UK, Italy, Spain, Netherlands, Switzerland, Austria, Rest of Western Europe]), Asia Pacific (China, India, Japan, South Korea, Vietnam, Singapore, Australia, Rest of Asia Pacific), Middle East & Africa (Middle East [UAE, Egypt, Saudi Arabia, Qatar, Rest of Middle East], Africa [Nigeria, South Africa, Rest of Africa], Latin America (Brazil, Argentina, Colombia, Rest of Latin America) |
| Company Profiles | Microsoft Corporation, Slack Technologies, LLC, Zoom Video Communications, Inc., Cisco Systems, Inc., Asana, Inc., Google LLC, Adobe Inc., Salesforce.com, Inc., Atlassian Corporation Plc., Zoho Corporation |
| Key Drivers | • The global shift toward remote and hybrid work models has accelerated demand for team collaboration tools that facilitate seamless communication and information sharing. • Cloud-based collaboration software is increasingly popular due to its scalability, lower costs, and easy accessibility, which are ideal for diverse work settings. • Real-time messaging, video conferencing, and file-sharing capabilities are in high demand as businesses aim to streamline communication. |
| Market Restraints | • Implementing advanced collaboration platforms, especially for small and medium enterprises, can be cost-prohibitive due to software costs and infrastructure requirements. • With increasing data sensitivity, especially in industries like finance and healthcare, concerns around data privacy and software security can hinder adoption. |
Frequently Asked Questions
Ans: The Team Collaboration Software Market is projected to reach USD 62.4 billion by 2032.
Ans: The Team Collaboration Software is estimated to grow at a CAGR of 10.3% over the forecast period of 2024-2032.
Ans: The North American region dominated the Team Collaboration Software Market in 2023.
Ans: The solutions component segment dominated the Team Collaboration Software Market.
Ans: The Team Collaboration Software Market is propelled by the following factors:
-
The global shift toward remote and hybrid work models has accelerated demand for team collaboration tools that facilitate seamless communication and information sharing.
-
Cloud-based collaboration software is increasingly popular due to its scalability, lower costs, and easy accessibility, which are ideal for diverse work settings.
-
Real-time messaging, video conferencing, and file-sharing capabilities are in high demand as businesses aim to streamline communication.
Get in Touch
