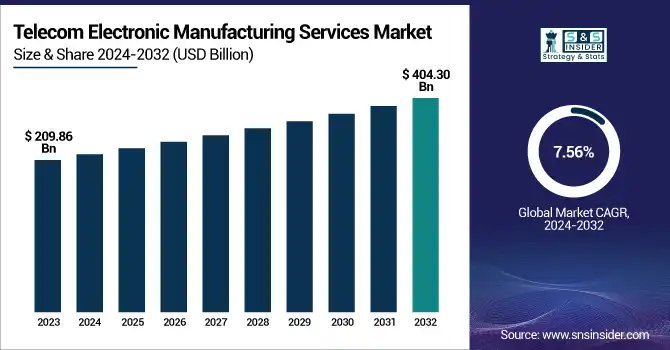
The Telecom Electronic Manufacturing Services Market was valued at 209.86 Billion in 2023 and is projected to reach USD 404.30 Billion by 2032, growing at a CAGR of 7.56% from 2024 to 2032. This growth is primarily driven by the rapid deployment of 5G networks, increasing demand for advanced telecom infrastructure, and the growing trend of outsourcing complex manufacturing tasks to specialized EMS providers. Additionally, the integration of cutting-edge technologies such as AI-driven testing, IoT, and cloud-connected systems into telecom hardware has significantly increased the need for agile and high-precision manufacturing capabilities. In the United States, the market stood at USD 36.95 billion in 2023 and is expected to reach USD 72.62 billion by 2032, registering a CAGR of 7.78% during the forecast period. Key statistical trends reshaping the market include rising technology adoption rates, a growing focus on sustainability and ESG compliance, increasing volatility in the Bill of Materials (BOM) due to global supply chain shifts, and a surge in co-development engagement frequency between EMS providers and telecom OEMs to accelerate innovation, customization, and time-to-market delivery.
The Impact of US Tariffs on the Electronics Manufacturing Services (EMS) Market
US tariffs on electronics have significantly disrupted the global Electronics Manufacturing Services (EMS) sector, offering both challenges and opportunities. The tariffs, including up to 145% on Chinese imports and a global 10% tariff, have raised production costs and altered supply chains. India, benefiting from the government’s "Make in India" initiative, is becoming an attractive manufacturing hub as foreign companies look to relocate production. Despite the imposition of a 26% tariff on Indian goods, India’s electronics sector is seen as more favorable than competitors such as Vietnam, China, and Taiwan, which face higher tariffs. The US remains a crucial market for India’s electronics industry, with mobile phones being a significant export. However, the US's desire to reshore semiconductor and tech manufacturing for national security concerns could impact India’s competitiveness, particularly as countries like Vietnam gain advantages from zero tariffs on smartphones.
Drivers:
Rapid expansion of 5G and fiber-optic networks is fueling demand for telecom hardware, driving Telecom EMS market growth.
The rapid deployment of 5G networks and large-scale fiber-optic expansion are accelerating the demand for high-performance telecom hardware, significantly boosting the Telecom Electronic Manufacturing Services (EMS) market. Major telecom players like AT&T are heavily investing in 5G and fiber rollouts, anticipating strong growth in free cash flow. Similarly, Bharti Airtel’s multi-billion-dollar partnership with Ericsson to enhance 4G and 5G coverage highlights a global shift toward advanced telecom infrastructure. The complexity and density of 5G networks require robust, fiber-rich backbones to meet low latency and high-speed data needs, fueling demand for precision-engineered hardware. This trend is further supported by proactive government initiatives and public-private partnerships aimed at improving digital connectivity. As a result, EMS providers are witnessing increased demand for telecom-grade electronic components, positioning them at the core of this next-gen network transformation.
Restraints:
Technology obsolescence in the Telecom EMS market drives the need for continuous innovation and substantial R&D investment to stay competitive.
Technology obsolescence is a significant challenge for the Telecom Electronic Manufacturing Services (EMS) market, driven by rapid advancements in telecom technologies. As networks evolve with the emergence of technologies such as 5G, fiber optics, and next-generation telecom hardware, existing products can become obsolete in a short period of time. EMS providers need to keep investing in R&D in order to provide innovative solutions for telecom infrastructure and better respond to more complex customer demands. Because of this demand for innovation, there are higher costs and resources used, and the pressure on companies to keep up with technological changes. Furthermore, not adapting quickly enough risks losing market share to more nimble competitors with cutting-edge and future-proofed offerings. As the telecom landscape evolves at a rapid pace, companies must embrace technological upgrades or risk being left behind in a highly competitive industry.
Opportunities:
Telecom EMS providers can thrive by capitalizing on the growing demand for high-quality hardware driven by the expansion of fiber-optic networks.
The expansion of fiber-optic infrastructure by telecom operators presents a significant opportunity for Telecom Electronic Manufacturing Services (EMS) providers. The demand for high-speed, reliable connectivity continues to skyrocket and as telecom companies build and upgrade their networks, the demand for inherently advanced yet sturdy hardware, components and other infrastructure grows. EMS providers can leverage this trend by providing customized solutions that can ensure reliable data transfer, be scalable, and reliable. As fiber-optic technology also becomes more of a necessity in the delivery of next-generation services including 5G and IoT, EMS companies will be positioned to provide the components needed, including fiber-optic cables, network routers and signal processors. This increasing need for advanced telecom hardware creates an opportunity for EMS providers to innovate and expand their offerings in the dynamic telecom industry, helping to establish a resilient, future-proof communication network.
Challenges:
Navigating complex and evolving regulatory compliance across regions presents significant operational challenges for Telecom Electronic Manufacturing Services (EMS) providers.
Regulatory compliance remains a significant challenge for Telecom Electronic Manufacturing Services (EMS) providers due to the ever-changing landscape of regulations across different regions. EMS firms have to deal with a wide array of local, national, and global regulations when it comes to product safety, environmental effects, and data privacy. These regulations often require a significant effort to monitor, adapt, and ensure that all products meet strict requirements. Noncompliance with regulatory guidelines can lead to expensive fines, damage to reputation or product-launch slowdowns. Moreover, the diverse nature of these regulations further complicates global operations, compelling EMS providers to adjust manufacturing processes to meet varying regional needs. The challenge will continue, needing ongoing investment in relevant compliance management and legal resources to prevent disruption and to maintain competitive position.
By Services
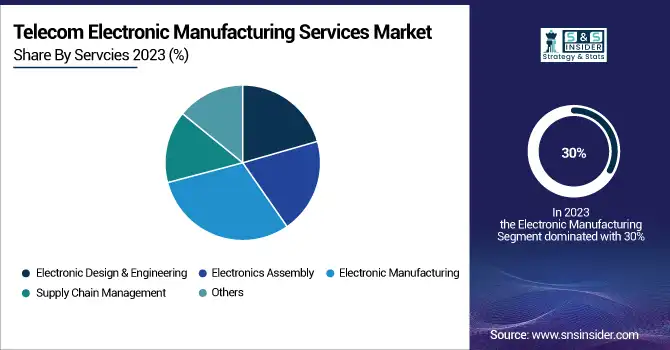
The Electronic Manufacturing Services (EMS) segment holds a dominant position in the market, contributing a significant share of revenue, estimated at approximately 30% in 2023. This dominance is driven by the increasing demand for high-quality, reliable electronic components across various industries, including telecommunications, consumer electronics, and automotive. EMS providers are essential for the efficient production of these components, offering services such as assembly, testing, and logistics. As technology continues to advance, EMS companies play a crucial role in meeting the needs of manufacturers by ensuring timely delivery, cost-efficiency, and adherence to stringent quality standards. The growth of sectors like 5G networks, smart devices, and automotive electronics further strengthens the EMS sector’s leadership in the global market.
The Electronic Design & Engineering segment is expected to experience the fastest growth over the forecast period from 2024 to 2032. This growth is driven by increasing demand for customized, cutting-edge electronic solutions across industries like telecommunications, consumer electronics, and automotive. As companies prioritize innovation and product differentiation, the need for advanced design and engineering services to develop complex, high-performance electronics is rising. Additionally, the integration of emerging technologies such as artificial intelligence, IoT, and 5G networks accelerates the demand for specialized design services. As a result, Electronic Design & Engineering is poised to become a key driver of market expansion, with companies investing heavily in R&D to meet evolving consumer needs.
In 2023, the Asia-Pacific region dominated the Telecom Electronic Manufacturing Services (EMS) market, securing 45% of the global market share, driven by technological advancements and increasing telecom infrastructure demand in countries like China, Japan, India, and South Korea. China, as the key player, significantly contributes to the EMS market due to its advanced manufacturing capabilities and robust telecom industry. The country’s rapid 5G infrastructure expansion, with over 4.19 million 5G base stations by the end of 2024, outpaces the U.S., positioning it as a global leader. Additionally, China's telecom giants, such as China Mobile, China Telecom, and China Unicom, boast hundreds of millions of 5G customers. This growth, fueled by government initiatives like “Made in China 2025,” underpins the demand for telecom hardware and EMS solutions, further driving market growth in the region.
North America is expected to witness significant growth in the Telecom Electronic Manufacturing Services (EMS) market from 2024 to 2032, driven by the ongoing expansion of 5G networks and increased telecom infrastructure investments. The U.S., as a major player, continues to enhance its telecom capabilities through large-scale deployments of 5G technologies, creating substantial demand for advanced telecom hardware. The region benefits from the high adoption rate of cutting-edge technologies and significant investments from telecom giants like AT&T, Verizon, and T-Mobile. Additionally, North American government initiatives, such as the Infrastructure Investment and Jobs Act, are driving infrastructure development, further boosting the demand for EMS. As the region progresses towards full 5G deployment, the market for telecom hardware and services is set to experience robust growth, positioning North America as a key contributor to the global EMS landscape.
Telecom Electronic Manufacturing Services Market Key Players:
Some of the Major Players in Telecom Electronic Manufacturing Services Market along with their Products:
FLEX LTD. (Singapore) – Telecom infrastructure components, 5G network devices, and communications equipment.
Jabil Inc. (USA) – Telecom hardware, network equipment, and communication devices.
Plexus Corp. (USA) – Telecom network equipment, base stations, and signal processing components.
Benchmark Electronics, Inc. (USA) – Telecom equipment, signal processors, and communication network components.
Celestica Inc. (Canada) – Telecom network infrastructure, 5G base stations, and communication components.
COMPAL Inc. (Taiwan) – Communication devices, base stations, and telecom equipment.
Creation Technologies LP (Canada) – Telecom equipment, signal processing devices, and communication infrastructure.
Fabrinet (Thailand) – Optical communication devices, fiber-optic components, and telecom network hardware.
Foxconn Technology (Taiwan) – Telecom components, 5G infrastructure devices, and communication electronics.
Sanmina Corporation (USA) – Telecom base stations, communication modules, and network components.
Venture Corporation Limited (Singapore) – Telecom network hardware, communication devices, and 5G infrastructure solutions.
Kimball Electronics, Inc. (USA) – Telecom devices, network infrastructure, and communication hardware.
Wistron Corporation (Taiwan) – Telecom network components, base stations, and communication devices.
Universal Scientific Industrial Co., Ltd. (USI) (Taiwan) – Telecom infrastructure hardware, 5G equipment, and communication components.
Zollner Elektronik AG (Germany) – Telecom infrastructure devices, signal processing equipment, and communication hardware.
SIIX Corporation (Japan) – Telecom infrastructure, communication devices, and network equipment.
Elcoteq SE (Finland) – Telecom network devices, communication components, and infrastructure equipment.
SMTC Corporation (Canada) – Telecom communication equipment, base stations, and network components.
List of key suppliers for raw materials and components in the Telecom Electronic Manufacturing Services (EMS) market:
Dow Inc.
3M Company
DuPont
LG Chem
Samsung SDI
Mitsubishi Materials Corporation
Nitto Denko Corporation
Henkel AG & Co.
Taiwan Semiconductor Manufacturing Company (TSMC)
TE Connectivity
Sumitomo Electric Industries
Corning Incorporated
Kyocera Corporation
Avago Technologies
Panasonic Corporation
April 9, 2025, India’s USD 2.7 billion PLI scheme for electronic components, announced in March 2025, aims to reduce import reliance and boost local manufacturing. With investments of USD 7 billion, it targets creating 92,000 jobs and driving innovation in key sectors like PCBs, displays, and semiconductors.
Apr 9, 2025, Dixon Technologies has announced the establishment of a Rs 1,000-crore facility in Oragadam, near Chennai, creating 5,000 jobs. The new factory will produce laptops, all-in-one PCs, and offer EMS services, marking a significant investment in the region.
Report Attributes | Details |
Market Size in 2023 | USD 209.86 Billion |
Market Size by 2032 | USD 404.30 Billion |
CAGR | CAGR of 7.56% From 2024 to 2032 |
Base Year | 2023 |
Forecast Period | 2024-2032 |
Historical Data | 2020-2022 |
Report Scope & Coverage | Market Size, Segments Analysis, Competitive Landscape, Regional Analysis, DROC & SWOT Analysis, Forecast Outlook |
Key Segments | • By Services (Electronic Design & Engineering, Electronics Assembly, Electronic Manufacturing, Supply Chain Management, Others) |
Regional Analysis/Coverage | North America (US, Canada, Mexico), Europe (Eastern Europe [Poland, Romania, Hungary, Turkey, Rest of Eastern Europe] Western Europe] Germany, France, UK, Italy, Spain, Netherlands, Switzerland, Austria, Rest of Western Europe]), Asia-Pacific (China, India, Japan, South Korea, Vietnam, Singapore, Australia, Rest of Asia-Pacific), Middle East & Africa (Middle East [UAE, Egypt, Saudi Arabia, Qatar, Rest of Middle East], Africa [Nigeria, South Africa, Rest of Africa], Latin America (Brazil, Argentina, Colombia, Rest of Latin America) |
Company Profiles | FLEX LTD. (Singapore), Jabil Inc. (USA), Plexus Corp. (USA), Benchmark Electronics, Inc. (USA), Celestica Inc. (Canada), COMPAL Inc. (Taiwan), Creation Technologies LP (Canada), Fabrinet (Thailand), Foxconn Technology (Taiwan), Sanmina Corporation (USA), Venture Corporation Limited (Singapore), Kimball Electronics, Inc. (USA), Wistron Corporation (Taiwan), Universal Scientific Industrial Co., Ltd. (USI) (Taiwan), Zollner Elektronik AG (Germany), SIIX Corporation (Japan), Elcoteq SE (Finland), SMTC Corporation (Canada). |
Ans: The Telecom Electronic Manufacturing Services Market is expected to grow at a CAGR of 7.56% during 2024-2032.
Ans: The Telecom Electronic Manufacturing Services Market was USD 209.86 Billion in 2023 and is expected to Reach USD 404.30 Billion by 2032.
Ans: Include the growing demand for advanced telecom infrastructure, 5G rollout, and the increasing need for cost-efficient, high-quality manufacturing solutions.
Ans: The “Electronic Manufacturing” segment dominated the Telecom Electronic Manufacturing Services Market.
Ans: Asia-Pacific dominated the Telecom Electronic Manufacturing Services Market in 2023.
Table of Content
1. Introduction
1.1 Market Definition
1.2 Scope (Inclusion and Exclusions)
1.3 Research Assumptions
2. Executive Summary
2.1 Market Overview
2.2 Regional Synopsis
2.3 Competitive Summary
3. Research Methodology
3.1 Top-Down Approach
3.2 Bottom-up Approach
3.3. Data Validation
3.4 Primary Interviews
4. Market Dynamics Impact Analysis
4.1 Market Driving Factors Analysis
4.1.1 Drivers
4.1.2 Restraints
4.1.3 Opportunities
4.1.4 Challenges
4.2 PESTLE Analysis
4.3 Porter’s Five Forces Model
5. Statistical Insights and Trends Reporting
5.1 Technology Adoption Rates
5.2 Sustainability & ESG Compliance
5.3 BOM (Bill of Materials) Volatility Index
5.4 Co-Development Engagement Frequency
6. Competitive Landscape
6.1 List of Major Companies, By Region
6.2 Market Share Analysis, By Region
6.3 Product Benchmarking
6.3.1 Product specifications and features
6.3.2 Pricing
6.4 Strategic Initiatives
6.4.1 Marketing and promotional activities
6.4.2 Distribution and supply chain strategies
6.4.3 Expansion plans and new product launches
6.4.4 Strategic partnerships and collaborations
6.5 Technological Advancements
6.6 Market Positioning and Branding
7. Telecom Electronic Manufacturing Services Market Segmentation, By Services
7.1 Chapter Overview
7.2 Electronic Design & Engineering
7.2.1 Electronic Design & Engineering Market Trends Analysis (2020-2032)
7.2.2 Electronic Design & Engineering Market Size Estimates and Forecasts to 2032 (USD Billion)
7.3 Electronics Assembly
7.3.1 Electronics Assembly Market Trends Analysis (2020-2032)
7.3.2 Electronics Assembly Market Size Estimates and Forecasts to 2032 (USD Billion)
7.4 Electronic Manufacturing
7.4.1 Electronic Manufacturing Market Trends Analysis (2020-2032)
7.4.2 Electronic Manufacturing Market Size Estimates and Forecasts to 2032 (USD Billion)
7.5 Supply Chain Management
7.5.1 Supply Chain Management Market Trends Analysis (2020-2032)
7.5.2 Supply Chain Management Market Size Estimates and Forecasts to 2032 (USD Billion)
7.6 Others
7.6.1 Others Market Trends Analysis (2020-2032)
7.6.2 Others Market Size Estimates and Forecasts to 2032 (USD Billion)
8. Regional Analysis
8.1 Chapter Overview
8.2 North America
8.2.1 Trends Analysis
8.2.2 North America Telecom Electronic Manufacturing Services Market Estimates and Forecasts, by Country (2020-2032) (USD Billion)
8.2.3 North America Telecom Electronic Manufacturing Services Market Estimates and Forecasts, by Services (2020-2032) (USD Billion)
8.2.2 USA
8.2.2.1 USA Telecom Electronic Manufacturing Services Market Estimates and Forecasts, by Services (2020-2032) (USD Billion)
8.2.3 Canada
8.2.3.1 Canada Telecom Electronic Manufacturing Services Market Estimates and Forecasts, by Services (2020-2032) (USD Billion)
8.2.4 Mexico
8.2.4.1 Mexico Telecom Electronic Manufacturing Services Market Estimates and Forecasts, by Services (2020-2032) (USD Billion)
8.3 Europe
8.3.1 Eastern Europe
8.3.1.1 Trends Analysis
8.3.1.2 Eastern Europe Telecom Electronic Manufacturing Services Market Estimates and Forecasts, by Country (2020-2032) (USD Billion)
8.3.1.3 Eastern Europe Telecom Electronic Manufacturing Services Market Estimates and Forecasts, by Services (2020-2032) (USD Billion)
8.3.1.4 Poland
8.3.1.4.1 Poland Telecom Electronic Manufacturing Services Market Estimates and Forecasts, by Services (2020-2032) (USD Billion)
8.3.1.5 Romania
8.3.1.5.1 Romania Telecom Electronic Manufacturing Services Market Estimates and Forecasts, by Services (2020-2032) (USD Billion)
8.3.1.6 Hungary
10.3.1.8.1 Hungary Telecom Electronic Manufacturing Services Market Estimates and Forecasts, by Services (2020-2032) (USD Billion)
8.3.1.7 Turkey
8.3.1.7.1 Turkey Telecom Electronic Manufacturing Services Market Estimates and Forecasts, by Services (2020-2032) (USD Billion)
8.3.1.8 Rest of Eastern Europe
8.3.1.8.1 Rest of Eastern Europe Telecom Electronic Manufacturing Services Market Estimates and Forecasts, by Services (2020-2032) (USD Billion)
8.3.2 Western Europe
8.3.2.1 Trends Analysis
8.3.2.2 Western Europe Telecom Electronic Manufacturing Services Market Estimates and Forecasts, by Country (2020-2032) (USD Billion)
8.3.2.3 Western Europe Telecom Electronic Manufacturing Services Market Estimates and Forecasts, by Services (2020-2032) (USD Billion)
8.3.2.4 Germany
8.3.2.4.1 Germany Telecom Electronic Manufacturing Services Market Estimates and Forecasts, by Services (2020-2032) (USD Billion)
8.3.2.5 France
8.3.2.5.1 France Telecom Electronic Manufacturing Services Market Estimates and Forecasts, by Services (2020-2032) (USD Billion)
8.3.2.6 UK
8.3.2.6.1 UK Telecom Electronic Manufacturing Services Market Estimates and Forecasts, by Services (2020-2032) (USD Billion)
8.3.2.7 Italy
8.3.2.7.1 Italy Telecom Electronic Manufacturing Services Market Estimates and Forecasts, by Services (2020-2032) (USD Billion)
8.3.2.8 Spain
8.3.2.8.1 Spain Telecom Electronic Manufacturing Services Market Estimates and Forecasts, by Services (2020-2032) (USD Billion)
8.3.2.9 Netherlands
8.3.2.9.1 Netherlands Telecom Electronic Manufacturing Services Market Estimates and Forecasts, by Services (2020-2032) (USD Billion)
8.3.2.10 Switzerland
8.3.2.10.1 Switzerland Telecom Electronic Manufacturing Services Market Estimates and Forecasts, by Services (2020-2032) (USD Billion)
8.3.2.11 Austria
8.3.2.11.1 Austria Telecom Electronic Manufacturing Services Market Estimates and Forecasts, by Services (2020-2032) (USD Billion)
8.3.2.12 Rest of Western Europe
8.3.2.12.1 Rest of Western Europe Telecom Electronic Manufacturing Services Market Estimates and Forecasts, by Services (2020-2032) (USD Billion)
8.4 Asia-Pacific
8.4.1 Trends Analysis
8.4.2 Asia-Pacific Telecom Electronic Manufacturing Services Market Estimates and Forecasts, by Country (2020-2032) (USD Billion)
8.4.3 Asia-Pacific Telecom Electronic Manufacturing Services Market Estimates and Forecasts, by Services (2020-2032) (USD Billion)
8.4.4 China
8.4.4.1 China Telecom Electronic Manufacturing Services Market Estimates and Forecasts, by Services (2020-2032) (USD Billion)
8.4.5 India
8.4.5.1 India Telecom Electronic Manufacturing Services Market Estimates and Forecasts, by Services (2020-2032) (USD Billion)
8.4.6 Japan
8.4.6.1 Japan Telecom Electronic Manufacturing Services Market Estimates and Forecasts, by Services (2020-2032) (USD Billion)
8.4.7 South Korea
8.4.7.1 South Korea Telecom Electronic Manufacturing Services Market Estimates and Forecasts, by Services (2020-2032) (USD Billion)
8.4.8 Vietnam
8.4.8.1 Vietnam Telecom Electronic Manufacturing Services Market Estimates and Forecasts, by Services (2020-2032) (USD Billion)
8.4.9 Singapore
8.4.9.1 Singapore Telecom Electronic Manufacturing Services Market Estimates and Forecasts, by Services (2020-2032) (USD Billion)
8.4.10 Australia
8.4.10.1 Australia Telecom Electronic Manufacturing Services Market Estimates and Forecasts, by Services (2020-2032) (USD Billion)
8.4.11 Rest of Asia-Pacific
8.4.11.1 Rest of Asia-Pacific Telecom Electronic Manufacturing Services Market Estimates and Forecasts, by Services (2020-2032) (USD Billion)
8.5 Middle East and Africa
8.5.1 Middle East
8.5.1.1 Trends Analysis
8.5.1.2 Middle East Telecom Electronic Manufacturing Services Market Estimates and Forecasts, by Country (2020-2032) (USD Billion)
10.5.1.3 Middle East Telecom Electronic Manufacturing Services Market Estimates and Forecasts, by Services (2020-2032) (USD Billion)
8.5.1.4 UAE
8.5.1.4.1 UAE Telecom Electronic Manufacturing Services Market Estimates and Forecasts, by Services (2020-2032) (USD Billion)
8.5.1.5 Egypt
8.5.1.5.1 Egypt Telecom Electronic Manufacturing Services Market Estimates and Forecasts, by Services (2020-2032) (USD Billion)
8.5.1.6 Saudi Arabia
8.5.1.6.1 Saudi Arabia Telecom Electronic Manufacturing Services Market Estimates and Forecasts, by Services (2020-2032) (USD Billion)
8.5.1.7 Qatar
8.5.1.7.1 Qatar Telecom Electronic Manufacturing Services Market Estimates and Forecasts, by Services (2020-2032) (USD Billion)
8.5.1.8 Rest of Middle East
8.5.1.8.1 Rest of Middle East Telecom Electronic Manufacturing Services Market Estimates and Forecasts, by Services (2020-2032) (USD Billion)
8.5.2 Africa
8.5.2.1 Trends Analysis
8.5.2.2 Africa Telecom Electronic Manufacturing Services Market Estimates and Forecasts, by Country (2020-2032) (USD Billion)
8.5.2.3 Africa Telecom Electronic Manufacturing Services Market Estimates and Forecasts, by Services (2020-2032) (USD Billion)
8.5.2.4 South Africa
8.5.2.4.1 South Africa Telecom Electronic Manufacturing Services Market Estimates and Forecasts, by Services (2020-2032) (USD Billion)
8.5.2.5 Nigeria
8.5.2.5.1 Nigeria Telecom Electronic Manufacturing Services Market Estimates and Forecasts, by Services (2020-2032) (USD Billion)
8.5.2.6 Rest of Africa
8.5.2.6.1 Rest of Africa Telecom Electronic Manufacturing Services Market Estimates and Forecasts, by Services (2020-2032) (USD Billion)
8.6 Latin America
8.6.1 Trends Analysis
8.6.2 Latin America Telecom Electronic Manufacturing Services Market Estimates and Forecasts, by Country (2020-2032) (USD Billion)
8.6.3 Latin America Telecom Electronic Manufacturing Services Market Estimates and Forecasts, by Services (2020-2032) (USD Billion)
8.6.4 Brazil
8.6.4.1 Brazil Telecom Electronic Manufacturing Services Market Estimates and Forecasts, by Services (2020-2032) (USD Billion)
8.6.5 Argentina
8.6.5.1 Argentina Telecom Electronic Manufacturing Services Market Estimates and Forecasts, by Services (2020-2032) (USD Billion)
8.6.6 Colombia
8.6.6.1 Colombia Telecom Electronic Manufacturing Services Market Estimates and Forecasts, by Services (2020-2032) (USD Billion)
8.6.7 Rest of Latin America
8.6.7.1 Rest of Latin America Telecom Electronic Manufacturing Services Market Estimates and Forecasts, by Services (2020-2032) (USD Billion)
9. Company Profiles
9.1 FLEX LTD.
9.1.1 Company Overview
9.1.2 Financial
9.1.3 Products/ Services Offered
9.1.4 SWOT Analysis
9.2 Jabil Inc.
9.2.1 Company Overview
9.2.2 Financial
9.2.3 Products/ Services Offered
9.2.4 SWOT Analysis
9.3 Benchmark Electronics, Inc.
9.3.1 Company Overview
9.3.2 Financial
9.3.3 Products/ Services Offered
9.3.4 SWOT Analysis
9.4 Celestica Inc.
9.4.1 Company Overview
9.4.2 Financial
9.4.3 Products/ Services Offered
9.4.4 SWOT Analysis
9.5 COMPAL Inc.
9.5.1 Company Overview
9.5.2 Financial
9.5.3 Products/ Services Offered
9.5.4 SWOT Analysis
9.6 Creation Technologies LP
9.6.1 Company Overview
9.6.2 Financial
9.6.3 Products/ Services Offered
9.6.4 SWOT Analysis
9.7 Fabrinet
9.7.1 Company Overview
9.7.2 Financial
9.7.3 Products/ Services Offered
9.7.4 SWOT Analysis
9.8 Foxconn Technology
9.8.1 Company Overview
9.8.2 Financial
9.8.3 Products/ Services Offered
9.8.4 SWOT Analysis
9.9 Sanmina Corporation
9.9.1 Company Overview
9.9.2 Financial
9.9.3 Products/ Services Offered
9.9.4 SWOT Analysis
9.10 Venture Corporation Limited
9.10.1 Company Overview
9.10.2 Financial
9.10.3 Products/ Services Offered
9.10.4 SWOT Analysis
10. Use Cases and Best Practices
11. Conclusion
An accurate research report requires proper strategizing as well as implementation. There are multiple factors involved in the completion of good and accurate research report and selecting the best methodology to compete the research is the toughest part. Since the research reports we provide play a crucial role in any company’s decision-making process, therefore we at SNS Insider always believe that we should choose the best method which gives us results closer to reality. This allows us to reach at a stage wherein we can provide our clients best and accurate investment to output ratio.
Each report that we prepare takes a timeframe of 350-400 business hours for production. Starting from the selection of titles through a couple of in-depth brain storming session to the final QC process before uploading our titles on our website we dedicate around 350 working hours. The titles are selected based on their current market cap and the foreseen CAGR and growth.
The 5 steps process:
Step 1: Secondary Research:
Secondary Research or Desk Research is as the name suggests is a research process wherein, we collect data through the readily available information. In this process we use various paid and unpaid databases which our team has access to and gather data through the same. This includes examining of listed companies’ annual reports, Journals, SEC filling etc. Apart from this our team has access to various associations across the globe across different industries. Lastly, we have exchange relationships with various university as well as individual libraries.
Step 2: Primary Research
When we talk about primary research, it is a type of study in which the researchers collect relevant data samples directly, rather than relying on previously collected data. This type of research is focused on gaining content specific facts that can be sued to solve specific problems. Since the collected data is fresh and first hand therefore it makes the study more accurate and genuine.
We at SNS Insider have divided Primary Research into 2 parts.
Part 1 wherein we interview the KOLs of major players as well as the upcoming ones across various geographic regions. This allows us to have their view over the market scenario and acts as an important tool to come closer to the accurate market numbers. As many as 45 paid and unpaid primary interviews are taken from both the demand and supply side of the industry to make sure we land at an accurate judgement and analysis of the market.
This step involves the triangulation of data wherein our team analyses the interview transcripts, online survey responses and observation of on filed participants. The below mentioned chart should give a better understanding of the part 1 of the primary interview.
Part 2: In this part of primary research the data collected via secondary research and the part 1 of the primary research is validated with the interviews from individual consultants and subject matter experts.
Consultants are those set of people who have at least 12 years of experience and expertise within the industry whereas Subject Matter Experts are those with at least 15 years of experience behind their back within the same space. The data with the help of two main processes i.e., FGDs (Focused Group Discussions) and IDs (Individual Discussions). This gives us a 3rd party nonbiased primary view of the market scenario making it a more dependable one while collation of the data pointers.
Step 3: Data Bank Validation
Once all the information is collected via primary and secondary sources, we run that information for data validation. At our intelligence centre our research heads track a lot of information related to the market which includes the quarterly reports, the daily stock prices, and other relevant information. Our data bank server gets updated every fortnight and that is how the information which we collected using our primary and secondary information is revalidated in real time.
Step 4: QA/QC Process
After all the data collection and validation our team does a final level of quality check and quality assurance to get rid of any unwanted or undesired mistakes. This might include but not limited to getting rid of the any typos, duplication of numbers or missing of any important information. The people involved in this process include technical content writers, research heads and graphics people. Once this process is completed the title gets uploader on our platform for our clients to read it.
Step 5: Final QC/QA Process:
This is the last process and comes when the client has ordered the study. In this process a final QA/QC is done before the study is emailed to the client. Since we believe in giving our clients a good experience of our research studies, therefore, to make sure that we do not lack at our end in any way humanly possible we do a final round of quality check and then dispatch the study to the client.
Key Segments:
By Services
Electronic Design & Engineering
Electronics Assembly
Electronic Manufacturing
Supply Chain Management
Others
Request for Segment Customization as per your Business Requirement: Segment Customization Request
Regional Coverage:
North America
US
Canada
Mexico
Europe
Eastern Europe
Poland
Romania
Hungary
Turkey
Rest of Eastern Europe
Western Europe
Germany
France
UK
Italy
Spain
Netherlands
Switzerland
Austria
Rest of Western Europe
Asia Pacific
China
India
Japan
South Korea
Vietnam
Singapore
Australia
Rest of Asia Pacific
Middle East & Africa
Middle East
UAE
Egypt
Saudi Arabia
Qatar
Rest of Middle East
Africa
Nigeria
South Africa
Rest of Africa
Latin America
Brazil
Argentina
Colombia
Rest of Latin America
Request for Country Level Research Report: Country Level Customization Request
Available Customization
With the given market data, SNS Insider offers customization as per the company’s specific needs. The following customization options are available for the report:
Detailed Volume Analysis
Criss-Cross segment analysis (e.g. Product X Application)
Competitive Product Benchmarking
Geographic Analysis
Additional countries in any of the regions
Customized Data Representation
Detailed analysis and profiling of additional market players
The Data Converter Market size was valued at 5.80 billion in 2024 and is projected to reach USD 9.40 Billion by 2032, growing at a CAGR of 6.23% from 2025 to 2032.
Data Center Interconnect Market Size was valued at USD 11.45 billion in 2023 and is expected to reach USD 37.53 billion by 2032 and grow at a CAGR of 14.1% over the forecast period 2024-2032.
The Smart Glass Market Size was valued at USD 6 Billion in 2023 and is expected to reach USD 13.83 Billion by 2032, at a CAGR of 9.76% During 2024-2032
The Arbitrary Waveform Generator Market Size was valued at USD 444.98 Million in 2023 and is expected to grow at a CAGR of 8.79% During 2024-2032.
The 3D Sensor Market size was valued at USD 4.10 billion in 2023and expected to reach USD 22.48 billion by 2032 and grow at a CAGR of 20.81% over the forecast period of 2024-2032.
The Street Lighting Market Size was valued at USD 10.93 Billion in 2023 and is expected to grow at a CAGR of 4.70% to reach USD 16.52 Billion by 2032.
Hi! Click one of our member below to chat on Phone