5G Equipment Market Size & Trends:
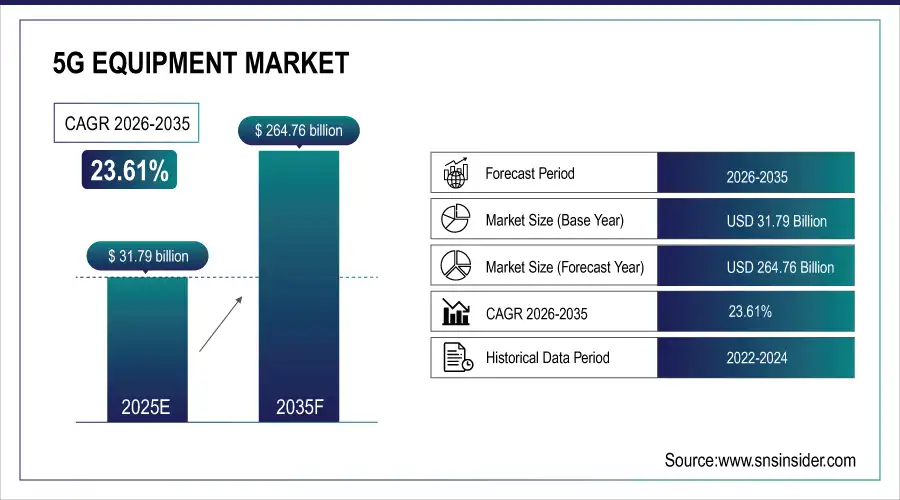
The 5G Equipment Market size was valued at USD 31.79 billion in 2025 and is expected to grow at a CAGR of 23.61% to reach USD 264.76 billion by 2035.
5G Equipment Market trends are driven by the growing adoption of small cells, massive MIMO, and mmWave solutions. The rising demand for private 5G networks and AI-driven network optimization in the enterprise segment is also contributing to the growth. The market for 5G Equipment is growing at a tremendous pace because of the increasing need for fast and low-latency communication networks to support the development of new technologies such as IoT, autonomous vehicles, smart cities, and Industry 4.0. The focus of telecom service providers on 5G networks has also helped the market grow at a rapid pace along with the increasing need for mobile data traffic. The need for cloud-native and software-defined networking solutions is also adding flexibility to make 5G networks more efficient and economical.
U.S. telecom operators collectively invested over USD 35 billion in 5G infrastructure in 2024, including spectrum acquisition, core network upgrades, and small cell expansion.
5G Equipment Market Size and Growth Forecast:
-
Market Size in 2025 USD 31.79 Billion
-
Market Size by 2035 USD 264.76 Billion
-
CAGR of 23.61% From 2026 to 2035
-
Base Year 2025
-
Forecast Period 2026-2035
-
Historical Data 2022-2024
To Get more information on 5G Equipment Market - Request Free Sample Report
5G Equipment Market Trends:
-
Rapid expansion of 5G infrastructure driven by rising data consumption, low-latency requirements, and growing user expectations.
-
Increasing adoption of emerging technologies such as IoT, AR, autonomous vehicles, and smart city solutions enabled by 5G networks.
-
Strong government support through spectrum auctions, R&D funding, and national digital transformation initiatives.
-
Growing shift toward software-defined networking and network virtualization, enabling flexible and efficient 5G deployment.
-
Rising deployment of private 5G networks across enterprises for secure, high-performance connectivity in manufacturing, logistics, ports, and healthcare.
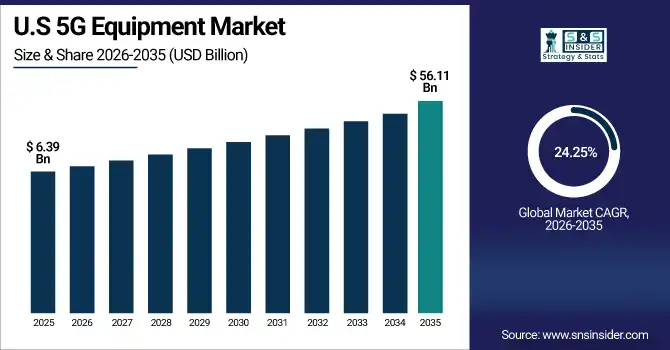
U.S. 5G Equipment Market Size Outlook:
The U.S. 5G Equipment Market size was valued at USD 6.39 billion in 2024 and is expected to reach USD 56.11 billion by 2035, growing at a CAGR of 24.25% over the forecast period of 2026-2035. The U.S. 5G Equipment Market is growing due to increased investments by telecom giants, rising demand for high-speed connectivity, private 5G adoption, and expansion of smart infrastructure and autonomous technologies.
5G Equipment Market Growth Drivers:
-
Rising Tech Adoption and Government Support Accelerate Global 5G Equipment Demand and Infrastructure Evolution
Demand for high-speed, low-latency communication is on the rise to facilitate the use of emerging technologies including IoT, augmented reality (AR), autonomous vehicles, and smart cities, which is a major driver of the global 5G Equipment market. Telecom operator is updating the infrastructure quickly with growing demand for data consumption and user expectations. Additionally, the growth of 5G is also driven by supportive government actions in the shape of spectrum auctions, R&D funding, and digital transformation programs. Moreover, the evolution toward software-defined networking and virtualization is facilitating more flexible, cost-effective 5G deployment.
Verizon and AT&T expanded 5G Ultra-Wideband coverage to over 100 million people in the U.S. by early 2025, with thousands of new small cell installations.
5G Equipment Market Restraints:
-
Integration Challenges and Spectrum Disparities Hamper Seamless Global Deployment of 5G Equipment and Networks
The intricacies of network integration and interoperability among various suppliers and existing systems (one of the most important limiting factors in the 5G Equipment Market) The ability to sustain performance, signal handoffs, and continuity during a transition between 4G and 5G is a significant source of technical complexity for both. Moreover, discrepancies between international and local spectrum policies and procedures may lead to delays in deployment, especially in developing countries.
5G Equipment Market Opportunities:
-
Private 5G Networks Unlock Growth in Enterprises Across Emerging Markets Fueled by Digital Transformation Trends
There is considerable potential in private 5G networks among enterprise use cases, including private 5G networks for secure, near-instantaneous communication inside factories, logistics hubs, and healthcare facilities. Asia-Pacific, Latin America, and the Middle East are home to emerging markets ripe for growth with a combination of continuous digitalization and initial low levels of 5G penetration.
As of early 2025, over 2,500 enterprises worldwide have deployed or are piloting private 5G networks, particularly in manufacturing, ports, logistics, and healthcare
5G Equipment Market Segment Analysis:
By Communication Infrastructure
Radio Access Network (RAN) led the overall 5G infrastructure market with a large 60.4% share in 2025, thanks to the large-scale adoption of macro and small cells, massive MIMO, and beamforming solutions. RAN solutions are essential for facilitating seamless wireless communication and supporting the rapidly growing mobile data traffic. Telecom service providers gave high priority to RAN investments to ensure comprehensive 5G coverage and capacity, especially during the initial stages of 5G network deployment. The Core Network market is anticipated to experience the fastest growth rate from 2026 to 2035, driven by the migration from non-standalone to standalone 5G networks. This development will support innovative services like network slicing, ultra-low latency, and cloud-native networks, thereby creating new use cases in enterprise applications, autonomous systems, and real-time analytics.
By Equipment Type
Macro Cell Equipment accounted for the largest market share in the 5G equipment market with a share of 32.3% in 2025, mainly due to its contribution to ensuring wide area coverage and assisting in the initial process of 5G network deployment. The telecommunication companies were largely reliant on macro cells to enhance their existing infrastructure and increase their coverage areas in the urban, suburban, and rural regions. High-power base stations are necessary for ensuring reliable connectivity over a longer distance, especially in areas with lower population density. Massive MIMO (Multiple Input Multiple Output) is expected to register the highest growth rate during the period from 2026 to 2035, mainly due to its ability to ensure a significant improvement in network capacity and spectral efficiency. As there is a growing need for fast and dense connectivity, the Massive MIMO solution will be an essential component in meeting the performance needs in terms of latency, bandwidth, and reliability.
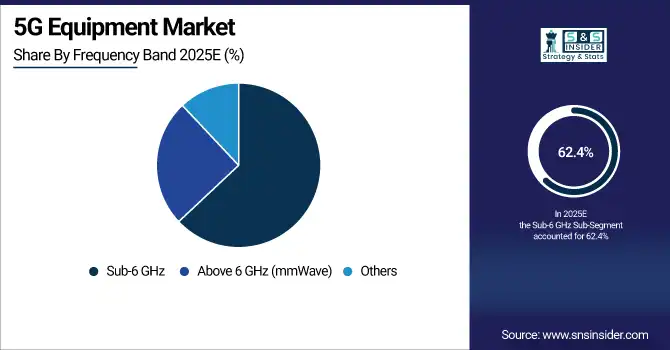
By Frequency Band
The Sub-6 GHz frequency band led the 5G equipment market with a 62.4% share in 2025, thanks to its well-rounded strengths in both coverage and capacity. The Sub-6 GHz frequency band is also well-suited for 5G network deployment in the initial phase due to its ability to provide wider coverage and easier signal penetration through obstacles such as walls and buildings. Telecommunications service providers worldwide gave utmost importance to the deployment of Sub-6 GHz frequency bands to provide a stable and nationwide 5G network in the initial phase of infrastructure development. The Above 6 GHz (mmWave) segment is anticipated to register the highest CAGR from 2026 to 2035, owing to the increasing need for ultra-fast and low-latency communication in high-density areas. The mmWave frequency band supports massive bandwidths and gigabit speeds, making it an essential component for use cases such as AR/VR, smart factories, and autonomous transportation systems.
By End-Use Industry
Telecom operators led the market with a share of 57.3% in 2025, owing to huge investments in the countrywide 5G network deployment. Telecom operators focused on improving the capabilities of base stations, small cells, and core networks to deliver seamless and fast connectivity services for consumers and enterprises. The key role of telecom operators in the deployment of 5G networks and the acquisition of spectrum has made them the backbone of the global 5G deployment, especially in the initial phase of its implementation. Enterprises, especially smart manufacturing and smart city solutions, are expected to achieve the fastest growth rate from 2026 to 2035, as they start to adopt private 5G networks to support real-time automation, intelligent monitoring, and IoT connectivity.
5G Equipment Market Regional Analysis:
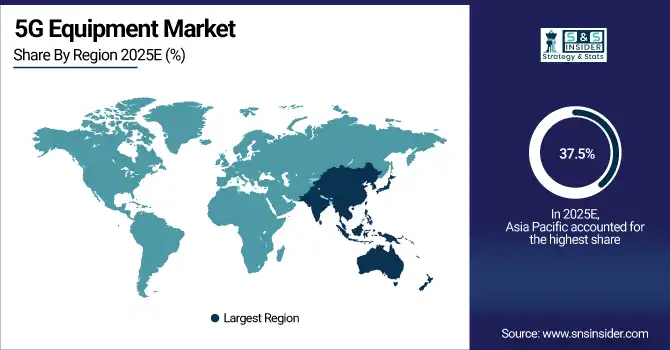
Asia Pacific 5G Equipment Market Insights
Asia Pacific was at the forefront in the global 5G equipment market with a share of 37.5% in 2025, due to the rapid development of infrastructure, huge investments, and the aggressive rollout of 5G networks by telcos. The region has a huge number of technology firms, and the government is also very supportive, in addition to the increasing demand for improved connectivity. Countries such as China, South Korea, and Japan have been at the forefront in the adoption of 5G technology, which has made it possible to develop smart cities, automation, and the growth of IoT.
China dominated the Asia Pacific market, due to its extensive 5G base station deployment and aggressive national rollout strategy.
Get Customized Report as per Your Business Requirement - Enquiry Now
North America 5G Equipment Market Insights
The 5G equipment market is expected to have the highest CAGR of 24.3% in North America from 2026 to 2035. This is driven by the accelerating rate of innovation in telecommunication infrastructure, adoption in the enterprise sector, and government initiatives for the availability of the spectrum. There is also significant investment by major telecommunication firms in the development of small cell networks, standalone 5G core networks, and private 5G networks for industrial use. The requirement for ultra-reliable low latency connectivity in the automotive, healthcare, and smart city sectors is also driving the adoption rate.
The United States dominated the North American market, fueled by extensive 5G rollouts, enterprise applications, and federal support for digital infrastructure expansion.
Europe 5G Equipment Market Insights
The European region is witnessing a constant increase in the 5G equipment market, thanks to the collaborative efforts of the regulatory bodies and the public-private partnerships. The region is also working on the development of new 5G use cases in the areas of smart manufacturing, transportation, and energy management. The European region is also witnessing the adoption of private 5G networks in the industrial sector, with countries such as Germany, the UK, and France leading the way. The European Union’s Digital Decade program is further accelerating the development of secure and high-performance 5G infrastructure in the European region.
Latin America (LATAM) and Middle East & Africa (MEA) 5G Equipment Market Insights
Latin America and Middle East & Africa are emerging markets in the 5G equipment industry, which are gaining momentum with the ongoing digital transformation. Governments and telcos are slowly starting the deployment of 5G networks to enable smart cities, industrial automation, and better connectivity. Brazil, Saudi Arabia, and the UAE are leading the charge in their respective regions with pilot programs and commercial launches. Despite the challenges of infrastructure and regulations, the growing mobile subscription base and global collaborations are opening up immense growth opportunities in both regions.
5G Equipment Companies are:
-
Huawei
-
Nokia
-
Samsung
-
ZTE
-
NEC
-
Fujitsu
-
Qualcomm
-
Intel
-
CommScope
-
Mavenir
-
Airspan
-
Casa Systems
-
Sercomm
-
Keysight
-
VIAVI
-
Analog Devices
-
Qorvo
-
Infovista
Competitive Landscape for 5G Equipment Market:
Huawei is a global leader in the 5G equipment market, providing end-to-end solutions including radio access networks, core networks, and transmission systems. The company plays a key role in large-scale 5G deployments worldwide, supporting high-speed connectivity, low latency communication, and advanced applications across consumer, enterprise, and industrial networks.
-
In 2024, Huawei announced plans to introduce a full suite of commercial 5.5G equipment in 2024, aiming for peak downlink speeds of 10 Gbps and support for up to 100 billion IoT connections.
Ericsson is a global leader in the supply of 5G equipment and network solutions, offering the latest radio access networks, core network solutions, and network management software. Ericsson helps telecom operators worldwide to create high-performance, secure, and flexible 5G networks to enable enhanced mobile broadband, ultra-low latency applications, and digital transformation.
-
In February 2025, Ericsson delivered 100,000 Massive MIMO 5G radios to Bharti Airtel across 12 Indian circles in just over 500 days, reinforcing its commitment to energy-efficient and scalable radio infrastructure.
| Report Attributes | Details |
|---|---|
| Market Size in 2025 | USD 31.79 Billion |
| Market Size by 2035 | USD 264.76 Billion |
| CAGR | CAGR of 23.61% From 2026 to 2035 |
| Base Year | 2025 |
| Forecast Period | 2026-2035 |
| Historical Data | 2022-2024 |
| Report Scope & Coverage | Market Size, Segments Analysis, Competitive Landscape, Regional Analysis, DROC & SWOT Analysis, Forecast Outlook |
| Key Segments | • By Communication Infrastructure (Radio Access Network (RAN), Core Network, and Backhaul & Transport) • By Equipment Type (Macro Cell Equipment, Small Cell Equipment, Distributed Antenna Systems (DAS), Massive MIMO, and Beamforming Equipment) • By Frequency Band (Sub-6 GHz, Above 6 GHz (mmWave), and Others (Unlicensed/Shared Spectrum)) • By End-Use Industry (Telecom Operators, Enterprises (Smart Manufacturing, Smart Cities), Defense & Government, Healthcare, Automotive, and Energy & Utilities) |
| Regional Analysis/Coverage | North America (US, Canada), Europe (Germany, UK, France, Italy, Spain, Russia, Poland, Rest of Europe), Asia Pacific (China, India, Japan, South Korea, Australia, ASEAN Countries, Rest of Asia Pacific), Middle East & Africa (UAE, Saudi Arabia, Qatar, South Africa, Rest of Middle East & Africa), Latin America (Brazil, Argentina, Mexico, Colombia, Rest of Latin America). |
| Company Profiles | Huawei, Ericsson, Nokia, Samsung, ZTE, Cisco, NEC, Fujitsu, Qualcomm, Intel, CommScope, Mavenir, Airspan, Casa Systems, Sercomm, Keysight, VIAVI, Analog Devices, Qorvo, and Infovista. |
Get in Touch
