Get PDF Sample Report on Rugged Electronics Market - Request Sample Report
The Rugged Electronics Market Size was valued at USD 14.01 Billion in 2023 and is expected to grow to USD 26.4 Billion by 2032 and grow at a CAGR of 7.32% over the forecast period of 2024-2032.
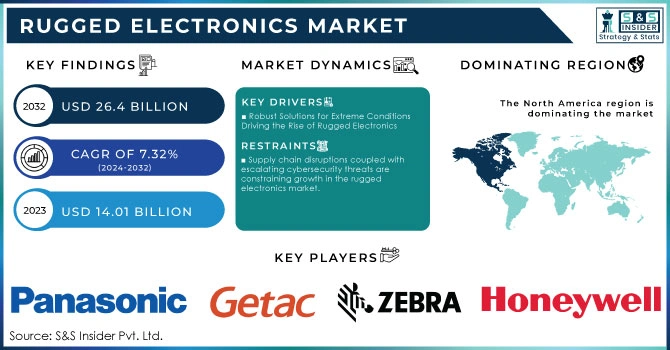
The rugged electronics market is witnessing robust growth, fueled by escalating demand across various sectors, notably military, construction, and outdoor activities. These devices are engineered to withstand extreme environmental conditions such as moisture, temperature variations, and physical impacts providing reliability where standard electronics often falter. Major players, including Saab, are at the forefront of this trend, focusing on advanced passive sensor technologies for electronic warfare, which facilitate stealthy signals intelligence (SIGINT) collection without detection. Consumer preferences further drive this market, as seen in the notable rise in demand for durable Bluetooth speakers and sound bars, with a 55% increase in popularity among outdoor enthusiasts. This trend is exemplified by products like the Bang & Olufsen Beosound A1, now available for USD 188 (down from USD 299), and the Bose Sound Link Revolve+, which is currently 41% off, highlighting the growing consumer interest in high-quality portable audio solutions. Moreover, advancements in wireless charging technology and the rising popularity of portable power banks are complementing the rugged electronics segment, enabling users to charge their devices conveniently in remote locations. Approximately 65% of college students have purchased portable power banks, underscoring the increasing demand for mobile charging solutions. The global rugged electronics market is projected to continue its upward trajectory, driven by ongoing technological innovations and rising investments in durable electronic devices. Industries are prioritizing safety and situational awareness, which amplifies the demand for rugged electronics that offer advanced features such as low size, weight, and power (SWaP) solutions. This unique blend of functionality and durability positions rugged electronics as essential tools for professionals and outdoor enthusiasts alike, marking a significant shift in today’s technology landscape.
Drivers
Robust Solutions for Extreme Conditions Driving the Rise of Rugged Electronics
One of the key drivers of growth in the rugged electronics market is the increasing demand for durable and reliable devices that can operate effectively in extreme environmental conditions. As industries such as military, transportation, and construction continue to expand, the need for equipment that can withstand harsh elements—such as moisture, temperature fluctuations, and physical impacts—has become critical. Rugged electronics, designed to meet these demanding requirements, play a vital role in enhancing operational efficiency and safety. For instance, devices like the MEN DC2 panel computer exemplify the latest advancements in rugged electronics. This panel computer features a capacitive touch system integrated into a fanless design, making it maintenance-free and ideal for mobile applications in tough environments. With a 10.4-inch LCD TFT display offering a resolution of 1,024px x 768px and a rapid response time of approximately 25ms, the DC2 is specifically designed for use in applications like train driver cabins and agricultural machinery. Powered by an Intel Atom XL Z520PT processor operating at 1.33GHz with a power consumption of only 12W, the DC2 highlights the trend toward low-power yet high-performance solutions. It offers connectivity options including fast Ethernet and USB ports, allowing for seamless integration with other systems. Built to endure extreme temperatures ranging from -40°C to +70°C and equipped with shock and vibration-resistant components, the DC2 adheres to strict industry standards, ensuring its reliability in critical applications. As the need for safety, efficiency, and robust performance continues to rise, the rugged electronics market is poised for sustained growth, driven by technological advancements and the evolving demands of various industries.
Restraints
Supply chain disruptions coupled with escalating cybersecurity threats are constraining growth in the rugged electronics market.
Supply chain vulnerabilities pose a significant restraint in the rugged electronics market, as disruptions often lead to production delays and increased costs. Factors such as geopolitical tensions, natural disasters, and health crises like pandemics complicate the sourcing and manufacturing of essential components. For example, U.S. regulations like CMMC 2.0 have forced companies to revamp compliance protocols, impacting the timely procurement of materials critical for rugged electronics. Logistical issues, including recent U.S. port strikes, further intensify delays and elevate transportation costs, affecting industries like electronics. Cybersecurity threats compound these challenges, as the frequency of ransomware attacks has surged, particularly those stemming from the software supply chain. Recent data show that nearly 40% of organizations have faced or are uncertain about ransomware attacks linked to supply chain partners. Among those affected, 62% report that ransomware incidents originated within their software supply chain, prompting 90% to increase collaboration with software vendors to enhance security practices. With 91% of companies now expressing concerns over ransomware risks from third-party partners, recent breaches by industry players like Change Healthcare and CDK Global have heightened awareness, leading 49% of companies to reconsider vendor relationships. To mitigate risks, companies are investing in cybersecurity, with 74% implementing formal assessments of supplier practices. Additionally, cloud security and regular security training have become priorities, as 62% of SMBs are increasing cloud security investments. These measures, while costly, are essential for protecting rugged electronics from supply chain disruptions, helping stabilize the market by addressing vulnerabilities that could otherwise impede growth.
by Type
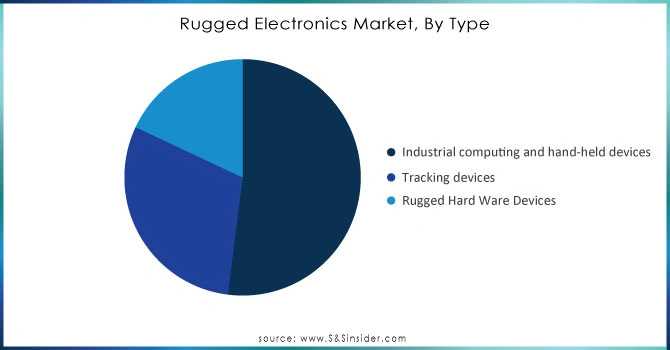
In 2023, the industrial computing and hand-held devices segment led the rugged electronics market, securing the largest revenue share in 60%. This growth can be attributed to the increasing adoption of durable computing solutions across various industries, including manufacturing, logistics, and field services. Designed to endure extreme temperatures, dust, moisture, and physical impacts, rugged tablets and laptops are essential for operations requiring reliability in harsh environments. Hand-held rugged devices are especially critical in sectors such as logistics, construction, and defense, where portability and resilience are paramount. Notable companies like Panasonic, with its Toughbook line, have played a key role in this segment, providing robust laptops and tablets that meet demanding specifications. Getac has also made significant advancements in rugged computing tailored for first responders and military applications. Furthermore, Zebra Technologies has introduced a range of hand-held mobile computers that enhance data capture and communication in logistics and retail settings. The demand for hand-held rugged devices has surged due to their advanced features, such as GPS, real-time data collection, and reliable connectivity, capable of withstanding shocks and drops.
Get Customized Report as per your Business Requirement - Request For Customized Report
by Application
In 2023, the defense sector emerged as the largest revenue generator in the rugged electronics market, capturing around 36% of the total share. This leading position is attributed to the essential requirement for reliable and durable technology in military operations, where rugged devices are crucial for effective communication, data collection, and situational awareness in harsh environments. Designed to endure extreme conditions such as severe temperatures, moisture, dust, and physical shocks, rugged electronics are particularly well suited for field deployments. Rugged computing solutions including handheld devices, laptops, and communication systems significantly enhance the operational efficiency and effectiveness of defense personnel. These devices boast advanced features like GPS, real-time data processing, and robust connectivity options, facilitating seamless communication and information sharing essential for mission success. Key players in this segment include General Dynamics, offering a variety of rugged laptops and tablets tailored for military applications, and Raytheon Technologies, known for its cutting-edge communication systems. Additionally, Panasonic and Getac provide reliable rugged computing solutions that meet the needs of defense forces in the field. As nations continue to modernize and integrate technology into military operations, the demand for rugged electronics in the defense sector is anticipated to grow, driven by an ongoing need for durability and performance in critical tasks.
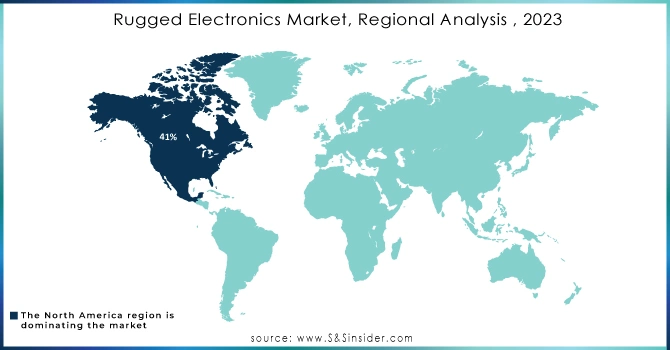
In 2023, North America maintained a leading position in the rugged electronics market, accounting for approximately 41% of total revenue. This robust performance is largely due to the region's sophisticated technological environment, significant defense expenditures, and an increasing focus on durable electronics across multiple industries. Key sectors driving demand include defense, manufacturing, logistics, and construction, where the reliability and performance of rugged devices are essential in harsh conditions. The United States plays a pivotal role in this dominance, with ongoing government investments aimed at modernizing military capabilities, which require rugged laptops, tablets, and communication systems for effective operations in the field. Meanwhile, Canada is experiencing growth in its rugged electronics sector, fueled by rising investments in infrastructure and industrial initiatives that enhance the need for durable solutions. Additionally, the growing emphasis on automation and the Internet of Things (IoT) in manufacturing and logistics is further boosting demand for rugged devices capable of withstanding challenging environments while enabling seamless connectivity and efficient data collection. The combination of established manufacturers, technological advancements, and heightened awareness of the necessity for durable electronics positions North America for sustained leadership in the rugged electronics market, ensuring continued investment in solutions that enhance operational efficiency and resilience.
In 2023, the Asia Pacific region emerged as the fastest-growing market for rugged electronics, fueled by rapid industrialization, heightened technology investments, and an increasing demand for durable devices across various industries. Leading countries like China, India, Japan, and Australia are pivotal to this growth as they work to enhance manufacturing capabilities and improve infrastructure. China’s drive for modernization and its role as a manufacturing powerhouse have significantly boosted the demand for rugged devices capable of withstanding harsh conditions. Government initiatives promoting smart manufacturing and technological advancements further stimulate the adoption of rugged electronics in logistics, construction, and defense sectors. India is also experiencing notable growth due to infrastructure projects and a push for digital transformation, with rising needs for rugged devices in agriculture, transportation, and defense. Local companies are investing in research and development to create tailored rugged solutions. Meanwhile, Japan and Australia are leveraging their advanced technology sectors, focusing on automation and connectivity, particularly in logistics and manufacturing. Recent launches of rugged laptops and handheld devices aim to improve operational efficiency in fields like emergency services. With the increasing integration of the Internet of Things (IoT), the rugged electronics market in Asia Pacific is poised for sustained growth, highlighting the region's potential in the global landscape
Key Players
Some of the major players in Rugged Electronics market with product:
Panasonic (Toughbook Series)
Getac (B300 Rugged Laptop)
Zebra Technologies (Zebra L10 Rugged Tablet)
Dell (Latitude Rugged Series)
Honeywell (RT10 Rugged Tablet)
ASUS (ZenBook 14 Rugged)
Xplore Technologies (XSLATE R12 Rugged Tablet)
Trimble (T10 Rugged Tablet)
JLT Mobile Computers (JLT1214P Rugged Computer)
Advantech (UNO-2271G Rugged Embedded System)
MobileDemand (X rugged Tablet)
Getac (F110 Rugged Tablet)
Acer (Enduro N3 Rugged Laptop)
Samsung (Galaxy Tab Active Series)
Robustel (R3000 Series Routers)
Sonim Technologies (XP8 Rugged Phone)
MilDef (MilDef RUGGED R2)
Datalogic (P/9200 Rugged Handheld)
L3Harris Technologies (Falcon III Radio)
Odin Technologies (Rugged Data Loggers)
List of suppliers that provide component parts for rugged electronics:
Molex
TE Connectivity
Schneider Electric
Amphenol
3M
Vishay
Honeywell
NXP Semiconductors
Texas Instruments
Analog Devices
STMicroelectronics
Infineon Technologies
Maxim Integrated
Murata Manufacturing
Eaton
Recent Development
August 05, 2024 Recent advancements in naval electronics focus on enhancing the durability and reliability of systems through improved ruggedization techniques, ensuring they can withstand extreme conditions such as high humidity, saltwater exposure, and significant vibrations during long deployments. This development aims to bolster operational readiness and effectiveness for modern naval vessels.
September 09, 2024 ATP Electronics has launched the Industrial Enterprise N651Sie Series SSDs, featuring NVMe PCIe Gen4x 4 technology, designed for rugged edge environments and available in M.2, U.2, and E1.S formats. These SSDs offer various endurance ratings, exceptional data retention capabilities, and high sequential read/write speeds, making them ideal for demanding industrial applications.
9th June 2024, Cinch Connectivity Solutions has launched a solderless 100Gbit/s optical transceiver, the H28-100G-SR4, designed for demanding environments such as aerospace, industrial, and military applications. This transceiver features four transmit and four receive channels, each rated at 25.78Gbit/s, and utilizes temperature-compensated 850nm VCSELs for transmission.
Report Attributes | Details |
---|---|
Market Size in 2023 | USD 14.01 Billion |
Market Size by 2032 | USD 26.4 Billion |
CAGR | CAGR of 7.32% From 2024 to 2032 |
Base Year | 2023 |
Forecast Period | 2024-2032 |
Historical Data | 2020-2022 |
Report Scope & Coverage | Market Size, Segments Analysis, Competitive Landscape, Regional Analysis, DROC & SWOT Analysis, Forecast Outlook |
Key Segments | • By Type (Industrial computing and hand-held devices, Tracking devices, Rugged Hard Ware Devices) • By Application (Mining and Metal, Power, Chemicals, Transportation, Healthcare, Defense, Adventure Sports) |
Regional Analysis/Coverage | North America (US, Canada, Mexico), Europe (Eastern Europe [Poland, Romania, Hungary, Turkey, Rest of Eastern Europe] Western Europe] Germany, France, UK, Italy, Spain, Netherlands, Switzerland, Austria, Rest of Western Europe]), Asia-Pacific (China, India, Japan, South Korea, Vietnam, Singapore, Australia, Rest of Asia-Pacific), Middle East & Africa (Middle East [UAE, Egypt, Saudi Arabia, Qatar, Rest of Middle East], Africa [Nigeria, South Africa, Rest of Africa], Latin America (Brazil, Argentina, Colombia, Rest of Latin America) |
Company Profiles | Panasonic, Getac, Zebra Technologies, Dell, Honeywell, ASUS, Xplore Technologies, Trimble, JLT Mobile Computers, Advantech, MobileDemand, Acer, Samsung, Robustel, Sonim Technologies, MilDef, Datalogic, L3Harris Technologies, and Odin Technologies. |
Key Drivers | • Robust Solutions for Extreme Conditions Driving the Rise of Rugged Electronics. |
RESTRAINTS | • Supply chain disruptions coupled with escalating cybersecurity threats are constraining growth in the rugged electronics market. |
Ans: The Rugged Electronics Market size was valued at USD 14.01billion in 2022 and is expected to grow to USD 26.4billion by 2032
Ans: North America is dominating the Rugged Electronics Market.
Ans: Rugged Electronics Market is to expand by 7.32% from 2024 to 2032.
Ans: The key market driver for the Rugged Electronics Market is the increasing demand for durable and reliable devices in harsh environments across various industries, including military, construction, and logistics.
Ans: Solution segment is dominating in Rugged Electronics Market
Table of Content
1. Introduction
1.1 Market Definition
1.2 Scope (Inclusion and Exclusions)
1.3 Research Assumptions
2. Executive Summary
2.1 Market Overview
2.2 Regional Synopsis
2.3 Competitive Summary
3. Research Methodology
3.1 Top-Down Approach
3.2 Bottom-up Approach
3.3. Data Validation
3.4 Primary Interviews
4. Market Dynamics Impact Analysis
4.1 Market Driving Factors Analysis
4.1.2 Drivers
4.1.2 Restraints
4.1.3 Opportunities
4.1.4 Challenges
4.2 PESTLE Analysis
4.3 Porter’s Five Forces Model
5. Statistical Insights and Trends Reporting
5.1 Production and Sales Volumes, 2020-2032, by Region
5.2 Price comparison with conventional counter parts
5.3 Technology Adoption, by Region
5.4 Consumer Preferences, by Region
5.5 Aftermarket Trends (Data on maintenance, parts, and services)
6. Competitive Landscape
6.1 List of Major Companies, by Region
6.2 Market Share Analysis, by Region
6.3 Product Benchmarking
6.3.1 Product specifications and features
6.3.2 Pricing
6.4 Strategic Initiatives
6.4.1 Marketing and promotional activities
6.4.2 Distribution and supply chain strategies
6.4.3 Expansion plans and new product launches
6.4.4 Strategic partnerships and collaborations
6.5 Technological Advancements
6.6 Market Positioning and Branding
7. Rugged Electronics Market Segmentation, by Type
7.1 Chapter Overview
7.2 Industrial computing and hand-held devices
7.2.1 Industrial computing and hand-held devices Market Trends Analysis (2020-2032)
7.2.2 Industrial computing and hand-held devices Market Size Estimates and Forecasts to 2032 (USD Billion)
7.3 Tracking devices
7.3.1 Tracking devices Market Trends Analysis (2020-2032)
7.3.2 Tracking devices Market Size Estimates and Forecasts to 2032 (USD Billion)
7.4 Rugged Hard Ware Devices
7.4.1 Rugged Hard Ware Devices Market Trends Analysis (2020-2032)
7.4.2 Rugged Hard Ware Devices Market Size Estimates and Forecasts to 2032 (USD Billion)
8. Rugged Electronics Market Segmentation, by Application
8.1 Chapter Overview
8.2 Mining and Metal
8.2.1 Mining and Metal Market Trends Analysis (2020-2032)
8.2.2 Mining and Metal Market Size Estimates and Forecasts to 2032 (USD Billion)
8.3 Power
8.3.1 Power Market Trends Analysis (2020-2032)
8.3.2 Power Market Size Estimates and Forecasts to 2032 (USD Billion)
8.4 Chemicals
8.4.1 Chemicals Market Trends Analysis (2020-2032)
8.4.2 Chemicals Market Size Estimates and Forecasts to 2032 (USD Billion)
8.5 Transportation
8.5.1 Transportation Market Trends Analysis (2020-2032)
8.5.2 Transportation Market Size Estimates and Forecasts to 2032 (USD Billion)
8.6 Healthcare
8.6.1 Healthcare Market Trends Analysis (2020-2032)
8.6.2 Healthcare Market Size Estimates and Forecasts to 2032 (USD Billion)
8.7 Defense
8.7.1 Defense Market Trends Analysis (2020-2032)
8.7.2 Defense Market Size Estimates and Forecasts to 2032 (USD Billion)
8.8 Adventure Sports
8.8.1 Adventure Sports Market Trends Analysis (2020-2032)
8.8.2 Adventure Sports Market Size Estimates and Forecasts to 2032 (USD Billion)
9. Regional Analysis
9.1 Chapter Overview
9.2 North America
9.2.1 Trends Analysis
9.2.2 North America Rugged Electronics Market Estimates and Forecasts, by Country (2020-2032) (USD Billion)
9.2.3 North America Rugged Electronics Market Estimates and Forecasts, by Type (2020-2032) (USD Billion)
9.2.4 North America Rugged Electronics Market Estimates and Forecasts, by Application (2020-2032) (USD Billion)
9.2.5 USA
9.2.5.1 USA Rugged Electronics Market Estimates and Forecasts, by Type (2020-2032) (USD Billion)
9.2.5.2 USA Rugged Electronics Market Estimates and Forecasts, by Application (2020-2032) (USD Billion)
9.2.6 Canada
9.2.6.1 Canada Rugged Electronics Market Estimates and Forecasts, by Type (2020-2032) (USD Billion)
9.2.6.2 Canada Rugged Electronics Market Estimates and Forecasts, by Application (2020-2032) (USD Billion)
9.2.7 Mexico
9.2.7.1 Mexico Rugged Electronics Market Estimates and Forecasts, by Type (2020-2032) (USD Billion)
9.2.7.2 Mexico Rugged Electronics Market Estimates and Forecasts, by Application (2020-2032) (USD Billion)
9.3 Europe
9.3.1 Eastern Europe
9.3.1.1 Trends Analysis
9.3.1.2 Eastern Europe Rugged Electronics Market Estimates and Forecasts, by Country (2020-2032) (USD Billion)
9.3.1.3 Eastern Europe Rugged Electronics Market Estimates and Forecasts, by Type (2020-2032) (USD Billion)
9.3.1.4 Eastern Europe Rugged Electronics Market Estimates and Forecasts, by Application (2020-2032) (USD Billion)
9.3.1.5 Poland
9.3.1.5.1 Poland Rugged Electronics Market Estimates and Forecasts, by Type (2020-2032) (USD Billion)
9.3.1.5.2 Poland Rugged Electronics Market Estimates and Forecasts, by Application (2020-2032) (USD Billion)
9.3.1.6 Romania
9.3.1.6.1 Romania Rugged Electronics Market Estimates and Forecasts, by Type (2020-2032) (USD Billion)
9.3.1.6.2 Romania Rugged Electronics Market Estimates and Forecasts, by Application (2020-2032) (USD Billion)
9.3.1.7 Hungary
9.3.1.7.1 Hungary Rugged Electronics Market Estimates and Forecasts, by Type (2020-2032) (USD Billion)
9.3.1.7.2 Hungary Rugged Electronics Market Estimates and Forecasts, by Application (2020-2032) (USD Billion)
9.3.1.8 Turkey
9.3.1.8.1 Turkey Rugged Electronics Market Estimates and Forecasts, by Type (2020-2032) (USD Billion)
9.3.1.8.2 Turkey Rugged Electronics Market Estimates and Forecasts, by Application (2020-2032) (USD Billion)
9.3.1.9 Rest of Eastern Europe
9.3.1.9.1 Rest of Eastern Europe Rugged Electronics Market Estimates and Forecasts, by Type (2020-2032) (USD Billion)
9.3.1.9.2 Rest of Eastern Europe Rugged Electronics Market Estimates and Forecasts, by Application (2020-2032) (USD Billion)
9.3.2 Western Europe
9.3.2.1 Trends Analysis
9.3.2.2 Western Europe Rugged Electronics Market Estimates and Forecasts, by Country (2020-2032) (USD Billion)
9.3.2.3 Western Europe Rugged Electronics Market Estimates and Forecasts, by Type (2020-2032) (USD Billion)
9.3.2.4 Western Europe Rugged Electronics Market Estimates and Forecasts, by Application (2020-2032) (USD Billion)
9.3.2.5 Germany
9.3.2.5.1 Germany Rugged Electronics Market Estimates and Forecasts, by Type (2020-2032) (USD Billion)
9.3.2.5.2 Germany Rugged Electronics Market Estimates and Forecasts, by Application (2020-2032) (USD Billion)
9.3.2.6 France
9.3.2.6.1 France Rugged Electronics Market Estimates and Forecasts, by Type (2020-2032) (USD Billion)
9.3.2.6.2 France Rugged Electronics Market Estimates and Forecasts, by Application (2020-2032) (USD Billion)
9.3.2.7 UK
9.3.2.7.1 UK Rugged Electronics Market Estimates and Forecasts, by Type (2020-2032) (USD Billion)
9.3.2.7.2 UK Rugged Electronics Market Estimates and Forecasts, by Application (2020-2032) (USD Billion)
9.3.2.8 Italy
9.3.2.8.1 Italy Rugged Electronics Market Estimates and Forecasts, by Type (2020-2032) (USD Billion)
9.3.2.8.2 Italy Rugged Electronics Market Estimates and Forecasts, by Application (2020-2032) (USD Billion)
9.3.2.9 Spain
9.3.2.9.1 Spain Rugged Electronics Market Estimates and Forecasts, by Type (2020-2032) (USD Billion)
9.3.2.9.2 Spain Rugged Electronics Market Estimates and Forecasts, by Application (2020-2032) (USD Billion)
9.3.2.10 Netherlands
9.3.2.10.1 Netherlands Rugged Electronics Market Estimates and Forecasts, by Type (2020-2032) (USD Billion)
9.3.2.10.2 Netherlands Rugged Electronics Market Estimates and Forecasts, by Application (2020-2032) (USD Billion)
9.3.2.11 Switzerland
9.3.2.11.1 Switzerland Rugged Electronics Market Estimates and Forecasts, by Type (2020-2032) (USD Billion)
9.3.2.11.2 Switzerland Rugged Electronics Market Estimates and Forecasts, by Application (2020-2032) (USD Billion)
9.3.2.12 Austria
9.3.2.12.1 Austria Rugged Electronics Market Estimates and Forecasts, by Type (2020-2032) (USD Billion)
9.3.2.12.2 Austria Rugged Electronics Market Estimates and Forecasts, by Application (2020-2032) (USD Billion)
9.3.2.13 Rest of Western Europe
9.3.2.13.1 Rest of Western Europe Rugged Electronics Market Estimates and Forecasts, by Type (2020-2032) (USD Billion)
9.3.2.13.2 Rest of Western Europe Rugged Electronics Market Estimates and Forecasts, by Application (2020-2032) (USD Billion)
9.4 Asia Pacific
9.4.1 Trends Analysis
9.4.2 Asia Pacific Rugged Electronics Market Estimates and Forecasts, by Country (2020-2032) (USD Billion)
9.4.3 Asia Pacific Rugged Electronics Market Estimates and Forecasts, by Type (2020-2032) (USD Billion)
9.4.4 Asia Pacific Rugged Electronics Market Estimates and Forecasts, by Application (2020-2032) (USD Billion)
9.4.5 China
9.4.5.1 China Rugged Electronics Market Estimates and Forecasts, by Type (2020-2032) (USD Billion)
9.4.5.2 China Rugged Electronics Market Estimates and Forecasts, by Application (2020-2032) (USD Billion)
9.4.6 India
9.4.5.1 India Rugged Electronics Market Estimates and Forecasts, by Type (2020-2032) (USD Billion)
9.4.5.2 India Rugged Electronics Market Estimates and Forecasts, by Application (2020-2032) (USD Billion)
9.4.5 Japan
9.4.5.1 Japan Rugged Electronics Market Estimates and Forecasts, by Type (2020-2032) (USD Billion)
9.4.5.2 Japan Rugged Electronics Market Estimates and Forecasts, by Application (2020-2032) (USD Billion)
9.4.6 South Korea
9.4.6.1 South Korea Rugged Electronics Market Estimates and Forecasts, by Type (2020-2032) (USD Billion)
9.4.6.2 South Korea Rugged Electronics Market Estimates and Forecasts, by Application (2020-2032) (USD Billion)
9.4.7 Vietnam
9.4.7.1 Vietnam Rugged Electronics Market Estimates and Forecasts, by Type (2020-2032) (USD Billion)
9.2.7.2 Vietnam Rugged Electronics Market Estimates and Forecasts, by Application (2020-2032) (USD Billion)
9.4.8 Singapore
9.4.8.1 Singapore Rugged Electronics Market Estimates and Forecasts, by Type (2020-2032) (USD Billion)
9.4.8.2 Singapore Rugged Electronics Market Estimates and Forecasts, by Application (2020-2032) (USD Billion)
9.4.9 Australia
9.4.9.1 Australia Rugged Electronics Market Estimates and Forecasts, by Type (2020-2032) (USD Billion)
9.4.9.2 Australia Rugged Electronics Market Estimates and Forecasts, by Application (2020-2032) (USD Billion)
9.4.10 Rest of Asia Pacific
9.4.10.1 Rest of Asia Pacific Rugged Electronics Market Estimates and Forecasts, by Type (2020-2032) (USD Billion)
9.4.10.2 Rest of Asia Pacific Rugged Electronics Market Estimates and Forecasts, by Application (2020-2032) (USD Billion)
9.5 Middle East and Africa
9.5.1 Middle East
9.5.1.1 Trends Analysis
9.5.1.2 Middle East Rugged Electronics Market Estimates and Forecasts, by Country (2020-2032) (USD Billion)
9.5.1.3 Middle East Rugged Electronics Market Estimates and Forecasts, by Type (2020-2032) (USD Billion)
9.5.1.4 Middle East Rugged Electronics Market Estimates and Forecasts, by Application (2020-2032) (USD Billion)
9.5.1.5 UAE
9.5.1.5.1 UAE Rugged Electronics Market Estimates and Forecasts, by Type (2020-2032) (USD Billion)
9.5.1.5.2 UAE Rugged Electronics Market Estimates and Forecasts, by Application (2020-2032) (USD Billion)
9.5.1.6 Egypt
9.5.1.6.1 Egypt Rugged Electronics Market Estimates and Forecasts, by Type (2020-2032) (USD Billion)
9.5.1.6.2 Egypt Rugged Electronics Market Estimates and Forecasts, by Application (2020-2032) (USD Billion)
9.5.1.7 Saudi Arabia
9.5.1.7.1 Saudi Arabia Rugged Electronics Market Estimates and Forecasts, by Type (2020-2032) (USD Billion)
9.5.1.7.2 Saudi Arabia Rugged Electronics Market Estimates and Forecasts, by Application (2020-2032) (USD Billion)
9.5.1.8 Qatar
9.5.1.8.1 Qatar Rugged Electronics Market Estimates and Forecasts, by Type (2020-2032) (USD Billion)
9.5.1.8.2 Qatar Rugged Electronics Market Estimates and Forecasts, by Application (2020-2032) (USD Billion)
9.5.1.9 Rest of Middle East
9.5.1.9.1 Rest of Middle East Rugged Electronics Market Estimates and Forecasts, by Type (2020-2032) (USD Billion)
9.5.1.9.2 Rest of Middle East Rugged Electronics Market Estimates and Forecasts, by Application (2020-2032) (USD Billion)
9.5.2 Africa
9.5.2.1 Trends Analysis
9.5.2.2 Africa Rugged Electronics Market Estimates and Forecasts, by Country (2020-2032) (USD Billion)
9.5.2.3 Africa Rugged Electronics Market Estimates and Forecasts, by Type (2020-2032) (USD Billion)
9.5.2.4 Africa Rugged Electronics Market Estimates and Forecasts, by Application (2020-2032) (USD Billion)
9.5.2.5 South Africa
9.5.2.5.1 South Africa Rugged Electronics Market Estimates and Forecasts, by Type (2020-2032) (USD Billion)
9.5.2.5.2 South Africa Rugged Electronics Market Estimates and Forecasts, by Application (2020-2032) (USD Billion)
9.5.2.6 Nigeria
9.5.2.6.1 Nigeria Rugged Electronics Market Estimates and Forecasts, by Type (2020-2032) (USD Billion)
9.5.2.6.2 Nigeria Rugged Electronics Market Estimates and Forecasts, by Application (2020-2032) (USD Billion)
9.5.2.7 Rest of Africa
9.5.2.7.1 Rest of Africa Rugged Electronics Market Estimates and Forecasts, by Type (2020-2032) (USD Billion)
9.5.2.7.2 Rest of Africa Rugged Electronics Market Estimates and Forecasts, by Application (2020-2032) (USD Billion)
9.6 Latin America
9.6.1 Trends Analysis
9.6.2 Latin America Rugged Electronics Market Estimates and Forecasts, by Country (2020-2032) (USD Billion)
9.6.3 Latin America Rugged Electronics Market Estimates and Forecasts, by Type (2020-2032) (USD Billion)
9.6.4 Latin America Rugged Electronics Market Estimates and Forecasts, by Application (2020-2032) (USD Billion)
9.6.5 Brazil
9.6.5.1 Brazil Rugged Electronics Market Estimates and Forecasts, by Type (2020-2032) (USD Billion)
9.6.5.2 Brazil Rugged Electronics Market Estimates and Forecasts, by Application (2020-2032) (USD Billion)
9.6.6 Argentina
9.6.6.1 Argentina Rugged Electronics Market Estimates and Forecasts, by Type (2020-2032) (USD Billion)
9.6.6.2 Argentina Rugged Electronics Market Estimates and Forecasts, by Application (2020-2032) (USD Billion)
9.6.7 Colombia
9.6.7.1 Colombia Rugged Electronics Market Estimates and Forecasts, by Type (2020-2032) (USD Billion)
9.6.7.2 Colombia Rugged Electronics Market Estimates and Forecasts, by Application (2020-2032) (USD Billion)
9.6.8 Rest of Latin America
9.6.8.1 Rest of Latin America Rugged Electronics Market Estimates and Forecasts, by Type (2020-2032) (USD Billion)
9.6.8.2 Rest of Latin America Rugged Electronics Market Estimates and Forecasts, by Application (2020-2032) (USD Billion)
10. Company Profiles
10.1 Panasonic
10.1.1 Company Overview
10.1.2 Financial
10.1.3 Products/ Services Offered
110.1.4 SWOT Analysis
10.2 Getac
10.2.1 Company Overview
10.2.2 Financial
10.2.3 Products/ Services Offered
10.2.4 SWOT Analysis
10.3 Zebra Technologies
10.3.1 Company Overview
10.3.2 Financial
10.3.3 Products/ Services Offered
10.3.4 SWOT Analysis
10.4 Dell
10.4.1 Company Overview
10.4.2 Financial
10.4.3 Products/ Services Offered
10.4.4 SWOT Analysis
10.5 Honeywell
10.5.1 Company Overview
10.5.2 Financial
10.5.3 Products/ Services Offered
10.5.4 SWOT Analysis
10.6 ASUS
10.6.1 Company Overview
10.6.2 Financial
10.6.3 Products/ Services Offered
10.6.4 SWOT Analysis
10.7 Xplore Technologies
10.7.1 Company Overview
10.7.2 Financial
10.7.3 Products/ Services Offered
10.7.4 SWOT Analysis
10.8 Trimble
10.8.1 Company Overview
10.8.2 Financial
10.8.3 Products/ Services Offered
10.8.4 SWOT Analysis
10.9 JLT Mobile Computers
10.9.1 Company Overview
10.9.2 Financial
10.9.3 Products/ Services Offered
10.9.4 SWOT Analysis
10.10 Advantech
10.10.1 Company Overview
10.102 Financial
10.10.3 Products/ Services Offered
10.10.4 SWOT Analysis
11. Use Cases and Best Practices
12. Conclusion
An accurate research report requires proper strategizing as well as implementation. There are multiple factors involved in the completion of good and accurate research report and selecting the best methodology to compete the research is the toughest part. Since the research reports we provide play a crucial role in any company’s decision-making process, therefore we at SNS Insider always believe that we should choose the best method which gives us results closer to reality. This allows us to reach at a stage wherein we can provide our clients best and accurate investment to output ratio.
Each report that we prepare takes a timeframe of 350-400 business hours for production. Starting from the selection of titles through a couple of in-depth brain storming session to the final QC process before uploading our titles on our website we dedicate around 350 working hours. The titles are selected based on their current market cap and the foreseen CAGR and growth.
The 5 steps process:
Step 1: Secondary Research:
Secondary Research or Desk Research is as the name suggests is a research process wherein, we collect data through the readily available information. In this process we use various paid and unpaid databases which our team has access to and gather data through the same. This includes examining of listed companies’ annual reports, Journals, SEC filling etc. Apart from this our team has access to various associations across the globe across different industries. Lastly, we have exchange relationships with various university as well as individual libraries.
Step 2: Primary Research
When we talk about primary research, it is a type of study in which the researchers collect relevant data samples directly, rather than relying on previously collected data. This type of research is focused on gaining content specific facts that can be sued to solve specific problems. Since the collected data is fresh and first hand therefore it makes the study more accurate and genuine.
We at SNS Insider have divided Primary Research into 2 parts.
Part 1 wherein we interview the KOLs of major players as well as the upcoming ones across various geographic regions. This allows us to have their view over the market scenario and acts as an important tool to come closer to the accurate market numbers. As many as 45 paid and unpaid primary interviews are taken from both the demand and supply side of the industry to make sure we land at an accurate judgement and analysis of the market.
This step involves the triangulation of data wherein our team analyses the interview transcripts, online survey responses and observation of on filed participants. The below mentioned chart should give a better understanding of the part 1 of the primary interview.
Part 2: In this part of primary research the data collected via secondary research and the part 1 of the primary research is validated with the interviews from individual consultants and subject matter experts.
Consultants are those set of people who have at least 12 years of experience and expertise within the industry whereas Subject Matter Experts are those with at least 15 years of experience behind their back within the same space. The data with the help of two main processes i.e., FGDs (Focused Group Discussions) and IDs (Individual Discussions). This gives us a 3rd party nonbiased primary view of the market scenario making it a more dependable one while collation of the data pointers.
Step 3: Data Bank Validation
Once all the information is collected via primary and secondary sources, we run that information for data validation. At our intelligence centre our research heads track a lot of information related to the market which includes the quarterly reports, the daily stock prices, and other relevant information. Our data bank server gets updated every fortnight and that is how the information which we collected using our primary and secondary information is revalidated in real time.
Step 4: QA/QC Process
After all the data collection and validation our team does a final level of quality check and quality assurance to get rid of any unwanted or undesired mistakes. This might include but not limited to getting rid of the any typos, duplication of numbers or missing of any important information. The people involved in this process include technical content writers, research heads and graphics people. Once this process is completed the title gets uploader on our platform for our clients to read it.
Step 5: Final QC/QA Process:
This is the last process and comes when the client has ordered the study. In this process a final QA/QC is done before the study is emailed to the client. Since we believe in giving our clients a good experience of our research studies, therefore, to make sure that we do not lack at our end in any way humanly possible we do a final round of quality check and then dispatch the study to the client.
Key Segments:
By Type
Industrial computing and hand-held devices
Tracking devices
Rugged Hard Ware Devices
By Application
Mining and Metal
Power
Chemicals
Transportation
Healthcare
Defense
Adventure Sports
Request for Segment Customization as per your Business Requirement: Segment Customization Request
REGIONAL COVERAGE:
North America
US
Canada
Mexico
Europe
Eastern Europe
Poland
Romania
Hungary
Turkey
Rest of Eastern Europe
Western Europe
Germany
France
UK
Italy
Spain
Netherlands
Switzerland
Austria
Rest of Western Europe
Asia-Pacific
China
India
Japan
South Korea
Vietnam
Singapore
Australia
Rest of Asia Pacific
Middle East & Africa
Middle East
UAE
Egypt
Saudi Arabia
Qatar
Rest of the Middle East
Africa
Nigeria
South Africa
Rest of Africa
Latin America
Brazil
Argentina
Colombia
Rest of Latin America
Request for Country Level Research Report: Country Level Customization Request
Available Customization
With the given market data, SNS Insider offers customization as per the company’s specific needs. The following customization options are available for the report:
Product Analysis
Criss-Cross segment analysis (e.g. Product X Application)
Product Matrix which gives a detailed comparison of the product portfolio of each company
Geographic Analysis
Additional countries in any of the regions
Company Information
Detailed analysis and profiling of additional market players (Up to five)
The Inkjet Printers Market Size was valued at USD 46.35 Billion in 2023 and is expected to reach USD 80.68 Billion by 2032 and grow at a CAGR of 6.38% over the forecast period 2024-2032.
The Interactive Tables Market was valued at USD 1.43 Billion in 2023 and is expected to reach USD 3.01 Billion by 2032 and grow at a CAGR of 8.66% over the forecast period 2024-2032.
The Microprocessor Market Size was valued at USD 62.67 billion in 2023 and is expected to reach USD 126.91 billion by 2032 and grow at a CAGR of 8.20% over the forecast period 2024-2032
The 3D Printing Materials Market Size USD 2.8 Billion in 2023 and is expected to reach USD 20.53 Billion by 2032 and grow at a CAGR of 24.81% by 2024-2032.
The Machine Condition Monitoring Market size was valued at USD 2.61 Billion in 2023. It is estimated to reach USD 5.27 Billion at a CAGR of 8.14% by 2032
The Smart Display Market Size will be valued at USD 40.50 billion by 2032, and it was valued at USD 3.09 billion in 2023, and grow at a CAGR of 33.1% over the forecast period 2024-2032.
Hi! Click one of our member below to chat on Phone