Biosimulation Market Size Analysis:
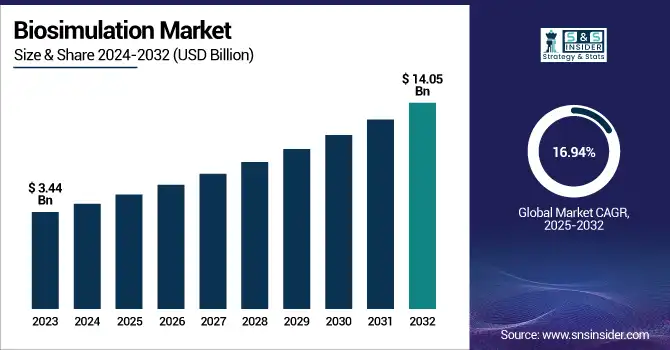
The Biosimulation Market size was valued at USD 3.44 Billion in 2023 and is expected to reach a valuation of USD 14.05 Billion by 2032 expanding at a CAGR of 16.94% over the forecast period.
To Get more information on Biosimulation Market - Request Free Sample Report
This report highlights several key statistical insights and emerging trends boosting the biosimulation market growth in the healthcare industry. The report also highlights disease prevalence data and its relativeness with the adoption of biosimulation tools across different sectors, including biotech, pharmaceutical, and CRO. The report studies incorporation of simulation in the clinical trial phases and the surging use of model-informed drug development (MIDD). The report covers the growing applications including PK/PD modeling and systems pharmacology, and drugs modelled using biosimulation. In addition, healthcare spending patterns on biosimulation are also analyzed in the report, along with the rising regulatory acceptance of submissions based on simulation, further highlighting a substantial shift toward efficient and data-driven drug development processes.
Biosimulation is the process that help in conducting efficient virtual clinical trials, decrease costs, and accelerate the drug development timelines that are important due to the rising prevalence of chronic diseases and high personalized medicine demand.
The increased healthcare spending and surging advancements in computational biology are driving the biosimulation market growth. The growth of the biosimulation market in the U.S. has showcased consistent growth, and the valuation is increased from USD 1.25 Billion to USD 5.08 Billion during the forecast period. The market is expected to grow at a CAGR of 16.83%, driven by the surging incorporation of simulation technologies in pharmaceutical R&D and increased government support for model-informed drug development. The U.S. continues to dominate the global adoption of biosimulation due to the high healthcare spending and strong collaborations between industries and academic institutions.
Biosimulation Market Dynamics
Drivers:
-
Rising Demand for Cost-Effective Drug Development Models Drives Biosimulation Technologies Adoption Globally
The market’s growth is largely driven by the surging demand for cost-effective drug development models, further augmenting the biosimulation technologies’ adoption among pharmaceutical and biotechnology giants globally. Biosimulation tools allow companies to simulate clinical trials, optimize dosage regimens, reduce time and cost for new drug developments, and predict pharmacokinetics. As the traditional clinical trials are expensive and time consuming, particularly in the later phases of trials, biosimulation provides a compelling alternative by supporting hypothesis testing and virtual experimentation. The rising amount of pressure on the pharmaceutical companies to introduce safer and more effective drugs into the market has propelled the investments in simulation tools. In addition, biosimulation decreases the dependency on the animal and human testing, further aligning with the regulatory encouragement and ethical standards. During to the rising recognition and acceptance of simulation-based data for drug approval by the regulatory bodies, the reliance on biosimulation is rapidly growing across the R&D pipelines. Many startups and established players are also integrating AI and machine learning with the biosimulation platforms, further improving the predictive accuracy. In a competitive market landscape, where reducing R&D risks and improving clinical outcomes is the main goal, biosimulation is proving to be one of the best strategic assets. The growing chronic and complex diseases prevalence globally is also making the drug developers to explore various therapeutic areas, where biosimulation can help in navigating the complexity efficiently.
Restraints:
-
Lack of Standardization across Biosimulation Platforms Hinders Market Growth
One of the major restraining actors impeding the market expansion is lack of standardization across different biosimulation platforms, which further hampers the outcomes and interoperability within the pharmaceutical research environments. Another significant barrier, which is limiting biosimulation tools’ widespread adoption is the lack of data integration frameworks and universally affected modeling standards. Each biosimulation vendor tends to use different model structures, interfaces, and simulation protocols, resulting in inconsistent outputs and limited compatibility with other systems. This fragmented environment creates difficulties for pharmaceutical researchers who need to validate simulation results across multiple platforms or integrate biosimulation data with clinical trial databases and regulatory reporting systems. The knowledge sharing and collaborative research has become inconvenient without standard format, further reducing innovation. The lack of standardization is also leading to higher training requirements, duplication of efforts in projects with multiple partners, and operational inefficiencies.
In addition, reproducibility, which is a key scientific requirement is compromised when models produce different predictions across different platforms. These challenges further raise trust issues among the stake holders and end-users and stakeholders, impeding the regulatory acceptance. Until standardized frameworks are widely adopted and enforced, biosimulation will face resistance, especially among the CROs and smaller pharmaceutical companies having limited technical resources. This limitation continues to restrict the biosimulation technologies’ scalability despite their immense potential benefits.
Opportunities:
-
Growing Personalized Medicines Can Bring New Opportunities for Biosimulation Market Growth
Growing expansion of the personalized medicine initiatives has now opened new avenues for biosimulation in tailoring the drug response models and patient-specific treatment. Due to the increasing shift of healthcare ecosystems toward more individualized approaches to treatment, biosimulation is now positioned to provide predictive models that highlight patient-specific biology. This includes simulations based on phenotypic, genetic, and lifestyle data for predicting how different patient segments is responding to a particular therapy. Many research institutions and pharmaceutical companies are hihly adopting biosimulation technologies to identify optimal drug combinations, along with precision dosing, and avoid adverse effects. This is particularly critical in oncology, immunotherapy, and rare disease treatments, where treatment variability is high and patient populations are small. Owing to the wide availability of genomic testing and companion diagnostics, the biosimulation platforms can now integrate this data to create virtual patient models for testing hypotheses in silico before proceeding with the clinical trials. The growing trend toward the value-based healthcare models also supports the adoption of personalized medicine, as biosimulation help the companies to minimize treatment failures and healthcare costs. In addition, the regulatory bodies have begun appreciating the patient-specific simulations relevancy in the treatment evaluation. The synergy between biosimulation and personalized medicine generates a fertile ground for partnership, innovation, and investment in the next-generation therapeutics, which are more safe, fast, and effective for the individual patients.
Challenges
-
Complexity of Biological Systems Limits the Reproducibility and Accuracy of Biosimulation Models
Complexity of biological systems limits the accuracy and reproducibility of biosimulation models across diverse therapeutic areas. Despite significant advancements in computational biology, simulating the intricate and dynamic nature of human biology remains a formidable task. Biological systems operate through interconnected pathways influenced by genetic, environmental, and lifestyle factors that are not always fully understood or easily modeled. This makes it difficult to create biosimulation platforms that can deliver consistently accurate predictions across varied therapeutic domains like neurology, oncology, or infectious diseases. Furthermore, incomplete or inconsistent data sets can lead to oversimplified models that may not reflect real-world patient responses. These inaccuracies can compromise confidence among drug developers and regulators, especially when the models are used for critical decision-making. Additionally, validating these models remains a challenge due to the absence of standardized benchmarks. In multi-organ or multi-scale simulations, the risk of error propagation increases, further impacting reliability. Even with powerful algorithms and high-performance computing, capturing the full scope of human physiology with all its interdependencies remains an ongoing challenge. Until these complexities are more effectively addressed via integrated biology, improved data fidelity, and collaborative validation efforts, the potential of biosimulation to revolutionize drug development will face critical limitations in execution and impact.
Biosimulation Market Segmentation Analysis:
By Product
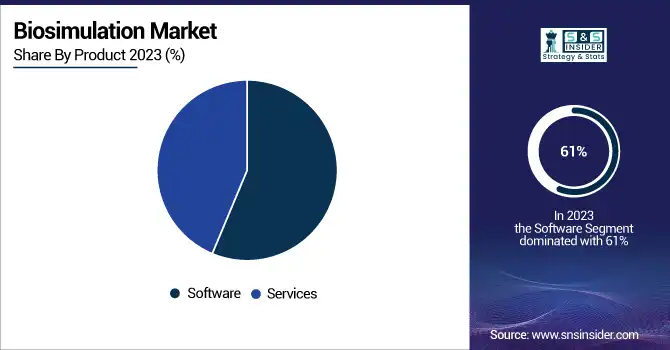
By product, the market is bifurcated into software and services. The software segment dominated the biosimulation market in 2023, with a revenue share of 61%. The segment’s dominance is driven by the ability of biosimulation software to model complex biological systems, treatment strategies optimization, and predicting drug efficacy. The increasing adoption of advanced software tools for pharmacokinetics (PK), pharmacodynamics (PD), and toxicokinetic modeling has significantly reduced drug development costs and timelines.
For instance, Certara's Phoenix software is widely used for PK/PD modeling, enabling researchers to simulate drug behavior with high precision.
The capabilities of biosimulation software are also improved due to the technological advancements in AI and computational biology. AI-driven models also allow for real-time data analysis, facilitate development of personalized medicine, and improve predictive accuracy. In addition, many government agencies, such as the FDA have incorporated biosimulation tools for drug approval processes and recognizing their value in virtual clinical trials. This regulatory support has boosted the adoption of biosimulation software across different pharmaceutical companies.
Rising deployment of cloud-based technology has also contributed to the segment's growth by providing accessibility and scalability and accessibility. Platforms including Optibrium's StarDrop offer cloud-based solutions, which enable remote collaboration and reduce infrastructure costs. Furthermore, the increase in the healthcare expenditure globally, including the U.S. spending USD 4.5 Trillion in 2022, has raised investments in the biosimulation technologies.
By Application
Based on application, the market is segmented into drug discovery & development, disease modeling, and others. The drug development segment held the largest market share of 54% in 2023. Biosimulation is an important process in streamlining the R&D processes by predicting drug efficacy and simulating disease progression during preclinical stages. This technology decreases the trial-and-error experiments, further reducing the costs and boosting timelines. The growing prevalence of chronic diseases has also raised the demand for faster drug development cycles.
For instance, according to a data from WHO, in 2023, the non-communicable diseases accounted for 74% of total deaths globally, which include 9.3 million cancer-related deaths. Biosimulation helps in understanding these complex diseases and develop targeted therapies to treat these diseases. Several government bodies have also recognized the potential of biosimulation in advancing drug approvals.
For instance, China's NMPA has approved over 100 new drugs in 2023, and many of these new drugs are used for biosimulation tools during drug development. Additionally, the advancements in patient stratification and pharmacodynamics modeling have significantly enhanced the clinical trial outcomes, which made biosimulation essential for pharmaceutical companies.
By Therapeutic Area
The market is led by the oncology segment in 2023, which held the largest revenue share owing to its complexity and growing need for precision medicine. Biosimulation is the process that enable tumor modeling and simulates therapeutic responses, further guiding the researchers to optimize cancer treatments. The global cancer burden highlights this need, and according to a report by WHO, more than 9 million fatalities were caused by cancer globally in 2023. Major innovations, such as individualized cancar vaccines and antibody-drug conjugates (ADCs) have been widely benefited from the utilization of biosimulation tools. For instance, Moderna's mRNA-4157 melanoma vaccine uses simulation models to predict dosage efficacy and refine dosing regimens.
Additionally, biosimulation combine clinical trial results with genomic data, opening many opportunities for personalized oncology treatments. Many government agencies have supported the oncology-focused biosimulation applications by streamlining innovative therapies’ approval processes. This has stimulated the pharmaceutical companies to heavily invest in the oncology research by using these biosimulation technologies.
By Deployment Model
The cloud-based deployment model segment led the market with a revenue share of over 42% in 2023. The segment’s expansion is driven by the flexibility and scalability of the cloud-based deployment model. These platforms enable researchers to access advanced biosimulation tools without any substantial investments in infrastructure.
For instance, cloud-based platform of Optibrium’s StarDrop provides improved accessibility while decreasing the operational costs. The cloud-based solutions enable remote partnership among researchers globally, making them ideal for several multinational pharmaceutical projects globally. These platforms also provide dynamic resource allocation, which are dependent on project needs, ensuring cost efficiency. The government bodies are also supported this transition via promotion of digital health technologies, which align with cloud-based models.
By Pricing Model
The market was dominated by the license-based pricing model segment owing to its cost-effectiveness and adaptability. This model offers access to several sophisticated tools without any requirement of infrastructure investments, making it appealing specifically to the life sciences companies having diverse needs. The range of licensing options from single-user agreements to enterprise-wide licenses, are also flexibility based on the budget constraints. The high popularity of the license-based pricing model is due to its ability to deliver high-quality simulation tools at reasonable costs. Companies, such as Certera provide tailored licensing packages, which cater small biotech firms and large pharmaceutical multinational companies.
By End-Use
Under end-use segmentation, the life science companies segment dominated the maret with a revenue share of 54%, due to the companies’ extensive use of biosimulation tools for innovative research. These companies heavily rely on simulation technologies to analyze physiological responses while developing drugs development. Large-scale adoption in the life sciences sectors is also rising owing to the high availability of capital investments globally. Partnerships between technology providers and life sciences companies has also enhanced their capabilities to produce a greater number of drugs. The surging diseases’ complexity has imposed advanced simulation tools, which further made the life sciences companies key drivers for market expansion.
For instance, collaborations between with AI-driven platforms have streamlined workflows and enhanced predictive accuracy.
Regional Insights
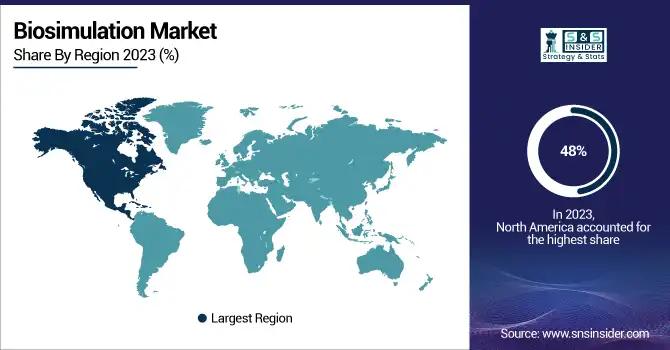
North America was the dominating region in the biosimulation market in 2023, and also held a share of 48%. This dominance is attributed to the significant healthcare spending, strong government support, and mature pharmaceutical industry. The U.S., in particular, plays a pivotal role, with healthcare expenditure reaching $4.8 trillion in 2023 a 7.5% increase from the previous year driven by Medicaid and private health insurance expansion. The insured population surged to 93%, according to the Centers for Medicare and Medicaid Services (CMS), creating a favourable environment for biosimulation adoption.
For instance, in 2023, the U.S. Food and Drug Administration (FDA) has accepted biosimulation as a tool to develop drugs by giving approval to 55 novel drugs in 2023, which is the second-highest number in three decades. In addition, North America boasts more than 5,000 pharmaceutical companies that are actively utilizing biosimulation software for improving drug safety and decrease R&D costs.
Asia Pacific is expected to be the fastest-growing region in the market and is projected to grow with a significant CAGR during the forecast period. This growth is driven by the surging investments in pharmaceutical and healthcare industries and favourable government policies that support innovation. Countries, such as India, China, and South Korea are the leading countries in Asia Pacific owing to their large patient pools and surging foreign direct investments (FDIs) from several multinational pharmaceutical companies.
For instance, the National Medical Products Administration (NMPA) of China has approved over 100 new drugs in 2023, highlighting the country’s commitment to boost the drug development using biosimulation tools.
Get Customized Report as per Your Business Requirement - Enquiry Now
Biosimulation Market Key Players
Key Service Providers/Manufacturers
-
Certara, Inc. (Simcyp Simulator, Phoenix WinNonlin)
-
Dassault Systèmes (BIOVIA Discovery Studio, BIOVIA Pipeline Pilot)
-
Schrödinger, Inc. (Maestro, LiveDesign)
-
Simulation Plus, Inc. (GastroPlus, ADMET Predictor)
-
Rosa & Co. LLC (PhysioPD Research Platform, Model-Based Drug Development Services)
-
Genedata AG (Genedata Screener, Genedata Profiler)
-
Insilico Medicine (PandaOmics, Chemistry42)
-
Chemical Computing Group (CCG) (MOE, PSILO)
-
ACD/Labs (Advanced Chemistry Development) (Percepta Platform, MetaSense)
-
Biomodels, LLC (Mechanistic Modeling Tools, QSP Platforms)
-
Leadscope Inc. (Leadscope Model Applier, Leadscope Enterprise)
-
DILIsym Services (a division of Simulations Plus) (DILIsym, NAFLDsym)
-
Evidera (Thermo Fisher Scientific) (Pharmacometric Modeling Tools, Meta-analysis Services)
-
Physiomics Plc (Virtual Tumour, Personalized Oncology Modeling)
-
Genentech (Roche Group) (QSP Models, PK/PD Modeling Tools)
-
Entelos, Inc. (PhysioLab Systems, Entelos PhysioLab Platform)
-
Immunetrics, Inc. (Disease Modeling Platform, QSP Modeling Services)
-
Applied BioMath, LLC (Applied BioMath QSP Platform, Applied BioMath Assess)
Recent Developments in the Biosimulation Market
-
In December 2023, Certara Inc. acquired Applied BioMath, enhancing its quantitative systems pharmacology capabilities.
-
In January 2023, Cellworks introduced a new division focused on precision oncology, utilizing advanced biosimulation models to enhance cancer treatment approaches.
-
In June 2024, Simulations Plus acquired Pro-ficiency, aiming to merge its technologies with Pro-ficiency's tools to improve efficiency in drug development.
| Report Attributes | Details |
|---|---|
| Market Size in 2023 | USD 3.44 Billion |
| Market Size by 2032 | USD 14.05 Billion |
| CAGR | CAGR of 16.94% From 2024 to 2032 |
| Base Year | 2023 |
| Forecast Period | 2024-2032 |
| Historical Data | 2020-2022 |
| Report Scope & Coverage | Market Size, Segments Analysis, Competitive Landscape, Regional Analysis, DROC & SWOT Analysis, Forecast Outlook |
| Key Segments | • By Product (Software, Services) • By Application (Drug Discovery & Development, Disease Modeling, Others) • By Pricing Model (License-based Model, Subscription-based Model, Service-based Model, Pay Per Use Model) • By Therapeutic Area (Oncology, Cardiovascular Disease, Infectious Disease Neurological Disorders, Others) • By Deployment Model (Cloud-based, On-premise, Hybrid Model) • By End Use (Life Sciences Companies, Academic Research Institutions, Others) |
| Regional Analysis/Coverage | North America (US, Canada, Mexico), Europe (Eastern Europe [Poland, Romania, Hungary, Turkey, Rest of Eastern Europe] Western Europe] Germany, France, UK, Italy, Spain, Netherlands, Switzerland, Austria, Rest of Western Europe]), Asia Pacific (China, India, Japan, South Korea, Vietnam, Singapore, Australia, Rest of Asia Pacific), Middle East & Africa (Middle East [UAE, Egypt, Saudi Arabia, Qatar, Rest of Middle East], Africa [Nigeria, South Africa, Rest of Africa], Latin America (Brazil, Argentina, Colombia, Rest of Latin America) |
| Company Profiles | Certara, Inc., Dassault Systèmes, Schrödinger, Inc., Simulation Plus, Inc., Certara USA, Inc., Rosa & Co. LLC, Genedata AG, Insilico Medicine, Chemical Computing Group (CCG), ACD/Labs (Advanced Chemistry Development), Biomodels, LLC, Leadscope Inc., DILIsym Services, Evidera, Physiomics Plc, Genentech, Entelos, Inc., Certara UK, Immunetrics, Inc., Applied BioMath, LLC |
Get in Touch
