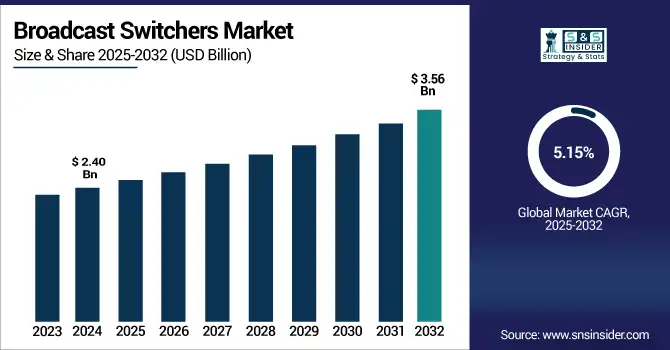
The Broadcast Switchers Market Size was valued at USD 2.40 billion in 2024 and is expected to reach USD 3.56 billion by 2032 and grow at a CAGR of 5.15% over the forecast period 2025-2032.
The global market for broadcast switchers is witnessing strong growth due to the rise in demand for high-definition content, live streaming, and the development of IP-based production. Advancements in video technologies that improve both transmission quality and real-time editing, including seamless multi-camera recording and broadcasting, are driving market growth. Furthermore, integration opportunities, fueled by a boost in modernizing television, sports and digital media broadcasting infrastructure, have acted as a market-driven catalyst to hasten switcher implementation. Furthermore, as content provides transition and viewers grow more discriminating, broadcasters use switcher technologies to improve real-time, high-quality production for multi-channel distribution systems.
According to research, A 2024 survey showed 78% of global viewers expect under 5 seconds of delay in live streams, pressuring broadcasters to upgrade equipment.
Multi-camera setups were used in over 65% of live broadcasts globally in 2024, emphasizing the need for complex switching systems.
The U.S. Broadcast Switchers Market size was USD 0.61 billion in 2024 and is expected to reach USD 0.79 billion by 2032, growing at a CAGR of 3.40% over the forecast period of 2025–2032.
The US broadcast switchers market growth is driven by the consumption of digital content, fast deployment of 4K/8K production workflows, and surging usage of cloud and remote-based broadcasting workflows. Moreover, the strong M&E industry and the steady investments being made for the modernization of broadcast studios will support the consumption of cutting-edge switcher technologies among the TV networks, streaming platforms, and production houses.
According to research, more than 58% of major U.S. broadcasters upgraded to 4K workflows, and over 12% piloted 8K production setups by late 2024.
U.S.-based OTT platforms accounted for over 55% of global streaming traffic in 2024, increasing demand for professional-grade switcher systems.
Key Drivers:
Increased demand for live production and real-time broadcasting in sports, news, and events accelerates the need for advanced switcher systems.
Live broadcasting requires fast, seamless transitions between multiple video sources, making broadcast switchers indispensable in real-time production environments. As sports events, live concerts, and breaking news coverage grow in frequency and viewer demand, broadcasters are prioritizing low-latency, high-performance switchers that ensure uninterrupted streaming. The switchers' capability to support multiple formats, resolutions, and simultaneous workflows further enhances their utility. Their integration with cloud systems, AI tools, and automation features is also expanding operational efficiency and creative flexibility across media platforms.
According to research, more than 55% of live broadcasters globally produced 4K content in 2024, with 8K adoption rising to 12% from just 6% in 2022.
Restrain:
Lack of technical expertise and integration challenges hinder smooth deployment of next-gen switcher systems.
Implementing modern broadcast switchers involves integrating them with existing systems like cameras, audio consoles, editing suites, and storage. This demands skilled technicians and engineers familiar with both legacy and new broadcast technologies. However, the talent gap in IP-based broadcasting, software-controlled routing, and automation tools creates barriers for seamless deployment. Many broadcasters face delays or disruptions due to configuration complexity and lack of vendor support. These issues can slow the pace of technology adoption across global and regional production centers, especially in resource-constrained or rapidly evolving broadcast environments.
Opportunities:
Rising demand for OTT platforms and digital streaming services creates lucrative prospects for switcher integration.
The surge in Over-The-Top (OTT) platforms and on-demand digital streaming content has fueled the need for advanced production tools that can manage complex live and pre-recorded feeds. Switchers enable content providers to streamline transitions, add visual effects, and manage multiple input sources efficiently. This makes them vital tools in creating professional-grade content for platforms like Netflix, YouTube Live, and Amazon Prime. As digital content consumption grows globally, so does the demand for innovative switchers tailored for web-based broadcast environments. Their ability to support multi-platform delivery and real-time analytics also enhances viewer engagement and monetization opportunities for content creators.
According to research, over 52% of OTT content providers adopted cloud-based production workflows in 2024, increasing switcher demand compatible with remote/cloud setups.
Challenges:
Ensuring seamless interoperability with legacy systems remains a technical barrier for broadcasters upgrading to new switchers.
Broadcasters that have invested heavily in traditional SDI equipment often find it challenging to integrate newer IP-based switchers into their existing setup. Compatibility issues with cables, interfaces, and control protocols create the need for converters or complete overhauls, both of which can be costly and time-consuming. This technical complexity can disrupt production workflows, discourage upgrades, and hinder full transition to next-gen switcher systems. As a result, seamless integration with existing infrastructure remains a key challenge for vendors and users alike, particularly in multi-location or hybrid production environments where consistent performance and reliability are critical.
By Product
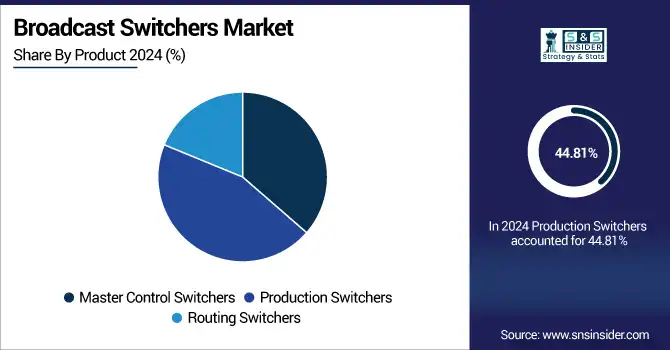
Production Switchers segment dominated the highest Broadcast Switchers Market revenue share of approximately 44.81% in 2024 due to their extensive application in real-time live broadcasting and multi-camera setups. These switchers are essential for producing live events, news shows, and sports programs, offering seamless switching between sources with minimal delay. Their widespread use in broadcast studios and outdoor event coverage makes them the backbone of traditional production workflows, leading to their dominant market share. Companies like Ross Video continue to refine these systems with features like automation, remote control, and UHD capabilities, enhancing their value and adoption across applications.
Routing Switchers segment is projected to grow at the fastest CAGR of about 6.13% from 2025 to 2032, driven by increasing demand for high-bandwidth, IP-compatible routing systems. Broadcast Switchers companies, such as Grass Valley, offer advanced routing solutions tailored for IP migration and hybrid workflows. As broadcasters transition to fully digital and cloud-based infrastructure, these switchers ensure efficient signal routing across complex production networks. Their role in managing video feeds from multiple input and output sources efficiently, combined with advancements in modular design, contributes to their accelerated growth in modern broadcasting environments, especially in remote and distributed production models.
By Application
Studio Production segment dominated the Broadcast Switchers Market share of about 31.75% in 2024, as traditional TV studios remain core users of switcher systems. These studios demand high reliability, flexibility, and visual enhancement tools for creating polished, real-time content. Ross Video has been instrumental in providing high-performance switchers for studio environments, enhancing operational efficiency and production quality. Broadcast switchers enable seamless scene transitions, effects layering, and multi-camera coordination in live studio settings, making them integral to newsrooms, talk shows, and daily programming schedules. Their growing integration with automation systems and cloud platforms is further strengthening studio workflows and content delivery.
Sports Production segment is expected to grow at the fastest CAGR of about 6.64% from 2025 to 2032 due to increasing demand for live sports coverage and immersive viewing experiences. Blackmagic Design, known for its cost-effective and high-quality broadcast solutions, plays a key role in enabling dynamic sports productions. Broadcasters need ultra-fast, low-latency switchers capable of handling multiple camera angles and graphics in real time. With global sports events expanding in scale and complexity, the need for specialized switchers optimized for dynamic, high-intensity live production is rapidly rising. Additionally, the rise of interactive sports streaming and mobile viewership is pushing demand for more agile switching systems.
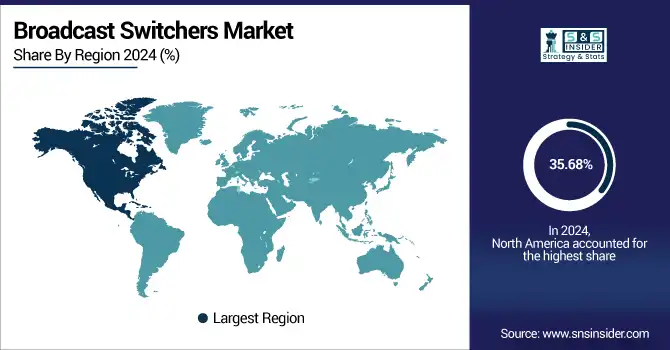
North America held the highest revenue share of about 35.68% in the Broadcast Switchers Market in 2024, owing to its advanced media infrastructure, high investment in 4K/8K content, and growing demand for live sports and entertainment broadcasts. Broadcasters and production companies across the region are continuously upgrading to IP-based switchers, driven by technological innovation and the shift toward remote production. The region’s mature television and digital streaming industries further support the adoption of advanced switching solutions. Additionally, the presence of leading broadcasters and strong regulatory support fuels continued investment in cutting-edge production technologies.
The U.S. dominates the North American broadcast switchers market due to its robust media ecosystem, high investments in 4K/8K production, rapid adoption of IP-based technologies, and continuous innovation across broadcasting infrastructure, particularly in sports, entertainment, and news production sectors.
Asia Pacific is forecast to grow at the fastest CAGR of about 6.09% from 2025 to 2032, fueled by rising investments in media and entertainment, increased demand for mobile broadcasting, and government-led digital transformation initiatives. Countries like China, India, and South Korea are experiencing a surge in regional content creation and the proliferation of OTT platforms, driving the need for cost-effective, scalable, and high-performance switching solutions. Growing sports broadcasting, live event coverage, and studio expansions are also contributing to switcher demand. The rapid adoption of IP-based workflows and cloud integration is further accelerating market growth in the region.
China leads the Asia Pacific region in the broadcast switchers market driven by its massive digital content demand, rapid expansion of 5G networks, state-backed media digitization efforts, and significant investments in advanced broadcasting equipment for national events and growing OTT platforms.
Europe’s broadcast switchers market shows steady growth, fueled by the increasing adoption of UHD broadcasting, demand for real-time production tools, and modernization of legacy infrastructure. Countries like the UK, Germany, and France are investing in cloud-enabled and IP-based workflows to improve production efficiency and content delivery. Additionally, rising sports broadcasting and event coverage further support market expansion across the region.
The United Kingdom dominates the European broadcast switchers market due to its advanced broadcasting infrastructure, early adoption of IP and cloud technologies, and strong demand from major TV networks, sports broadcasters, and live event producers seeking high-performance, real-time production and switching solutions.
In the Middle East & Africa, countries like the UAE and Saudi Arabia are leading the broadcast switchers market due to growing investments in digital broadcasting and live event coverage. In Latin America, Brazil dominates the market, driven by increasing demand for sports broadcasting, entertainment production, and expanding regional media networks.
Major Key Players in Broadcast Switchers Market are Grass Valley, Ross Video, Sony Corporation, Panasonic, Blackmagic Design, Evertz Microsystems, EVS Broadcast Equipment, FOR-A, NewTek, Broadcast Pix and others.
In September 2024, Grass Valley launched the K‑Frame VXP processing frame and Karrera V2 control panel at IBC 2024. These models enhance IP migration, offering compact 5RU chassis with UHD I/O, multiview support, and budget-friendly, high-performance options for small to mid-tier live productions
In September 2024, Blackmagic released ATEM Switchers v9.6.2, adding Visca-over-IP control for up to 100 PTZ cameras, audio mapping support, enhanced multi-view/ SuperSource features, and 30/60 fps compatibility for HD/UHD/8K Constellation models.
Report Attributes | Details |
---|---|
Market Size in 2024 | USD 2.40 Billion |
Market Size by 2032 | USD 3.56 Billion |
CAGR | CAGR of 5.15% From 2025 to 2032 |
Base Year | 2024 |
Forecast Period | 2025-2032 |
Historical Data | 2021-2023 |
Report Scope & Coverage | Market Size, Segments Analysis, Competitive Landscape, Regional Analysis, DROC & SWOT Analysis, Forecast Outlook |
Key Segments | • By Product (Master Control Switchers, Production Switchers, Routing Switchers) • By Application (News Production, Sports Production, Post Production, Production Trucks, Studio Production, Others) |
Regional Analysis/Coverage | North America (US, Canada, Mexico), Europe (Germany, France, UK, Italy, Spain, Poland, Turkey, Rest of Europe), Asia Pacific (China, India, Japan, South Korea, Singapore, Australia,Taiwan, Rest of Asia Pacific), Middle East & Africa (UAE, Saudi Arabia, Qatar, South Africa, Rest of Middle East & Africa), Latin America (Brazil, Argentina, Rest of Latin America) |
Company Profiles | Grass Valley, Ross Video, Sony Corporation, Panasonic, Blackmagic Design, Evertz Microsystems, EVS Broadcast Equipment, FOR-A, NewTek , Broadcast Pix |
Ans: The Broadcast Switchers Market is expected to grow at a CAGR of 5.15% from 2025-2032.
Ans: The Broadcast Switchers Market size was USD 2.40 billion in 2024 and is expected to reach USD 3.56 billion by 2032.
Ans: The major growth factor of the Broadcast Switchers Market is the increasing demand for live video production, 4K/8K broadcasting, and IP-based workflows.
Ans: Production Switchers segment dominated the Broadcast Switchers Market.
Ans: North America dominated the Broadcast Switchers Market in 2024.
Table of Content
1. Introduction
1.1 Market Definition
1.2 Scope (Inclusion and Exclusions)
1.3 Research Assumptions
2. Executive Summary
2.1 Market Overview
2.2 Regional Synopsis
2.3 Competitive Summary
3. Research Methodology
3.1 Top-Down Approach
3.2 Bottom-up Approach
3.3. Data Validation
3.4 Primary Interviews
4. Market Dynamics Impact Analysis
4.1 Market Driving Factors Analysis
4.1.2 Drivers
4.1.2 Restraints
4.1.3 Opportunities
4.1.4 Challenges
4.2 PESTLE Analysis
4.3 Porter’s Five Forces Model
5. Statistical Insights and Trends Reporting
5.1 Remote Operation Utilization
5.2 Visual Transition Complexity Index
5.3 Edge Computing Integration Rate
6. Competitive Landscape
6.1 List of Major Companies, By Region
6.2 Market Share Analysis, By Region
6.3 Product Benchmarking
6.3.1 Product specifications and features
6.3.2 Pricing
6.4 Strategic Initiatives
6.4.1 Marketing and promotional activities
6.4.2 Distribution and supply chain strategies
6.4.3 Expansion plans and new product launches
6.4.4 Strategic partnerships and collaborations
6.5 Technological Advancements
6.6 Market Positioning and Branding
7. Broadcast Switchers Market Segmentation, By Product
7.1 Chapter Overview
7.2 Master Control Switchers
7.2.1 Master Control Switchers Market Trends Analysis (2021-2032)
7.2.2 Master Control Switchers Market Size Estimates and Forecasts to 2032 (USD Billion)
7.3 Production Switchers
7.3.1 Production Switchers Market Trends Analysis (2021-2032)
7.3.2 Production Switchers Market Size Estimates and Forecasts to 2032 (USD Billion)
7.4 Routing Switchers
7.4.1 Routing Switchers Market Trends Analysis (2021-2032)
7.4.2 Routing Switchers Market Size Estimates and Forecasts to 2032 (USD Billion)
8. Broadcast Switchers Market Segmentation, By Application
8.1 Chapter Overview
8.2 News Production
8.2.1 News Production Market Trends Analysis (2021-2032)
8.2.2 News Production Market Size Estimates and Forecasts to 2032 (USD Billion)
8.3 Sports Production
8.3.1 Sports Production Market Trends Analysis (2021-2032)
8.3.2 Sports Production Market Size Estimates and Forecasts to 2032 (USD Billion)
8.4 Post Production
8.4.1 Post Production Market Trends Analysis (2021-2032)
8.4.2 Post Production Market Size Estimates and Forecasts to 2032 (USD Billion)
8.5 Production Trucks
8.5.1 Production Trucks Market Trends Analysis (2021-2032)
8.5.2 Production Trucks Market Size Estimates and Forecasts to 2032 (USD Billion)
8.6 Studio Production
8.6.1 Studio Production Market Trends Analysis (2021-2032)
8.6.2 Studio Production Market Size Estimates and Forecasts to 2032 (USD Billion)
8.7 Others
8.7.1 Others Market Trends Analysis (2021-2032)
8.7.2 Others Market Size Estimates and Forecasts to 2032 (USD Billion)
9. Regional Analysis
9.1 Chapter Overview
9.2 North America
9.2.1 Trends Analysis
9.2.2 North America Broadcast Switchers Market Estimates and Forecasts, by Country (2021-2032) (USD Billion)
9.2.3 North America Broadcast Switchers Market Estimates and Forecasts, By Product (2021-2032) (USD Billion)
9.2.4 North America Broadcast Switchers Market Estimates and Forecasts, By Application (2021-2032) (USD Billion)
9.2.5 USA
9.2.5.1 USA Broadcast Switchers Market Estimates and Forecasts, By Product (2021-2032) (USD Billion)
9.2.5.2 USA Broadcast Switchers Market Estimates and Forecasts, By Application (2021-2032) (USD Billion)
9.2.6 Canada
9.2.6.1 Canada Broadcast Switchers Market Estimates and Forecasts, By Product (2021-2032) (USD Billion)
9.2.6.2 Canada Broadcast Switchers Market Estimates and Forecasts, By Application (2021-2032) (USD Billion)
9.2.7 Mexico
9.2.7.1 Mexico Broadcast Switchers Market Estimates and Forecasts, By Product (2021-2032) (USD Billion)
9.2.7.2 Mexico Broadcast Switchers Market Estimates and Forecasts, By Application (2021-2032) (USD Billion)
9.3 Europe
9.3.1 Trends Analysis
9.3.2 Europe Broadcast Switchers Market Estimates and Forecasts, by Country (2021-2032) (USD Billion)
9.3.3 Europe Broadcast Switchers Market Estimates and Forecasts, By Product (2021-2032) (USD Billion)
9.3.4 Europe Broadcast Switchers Market Estimates and Forecasts, By Application (2021-2032) (USD Billion)
9.3.5 Germany
9.3.5.1 Germany Broadcast Switchers Market Estimates and Forecasts, By Product (2021-2032) (USD Billion)
9.3.5.2 Germany Broadcast Switchers Market Estimates and Forecasts, By Application (2021-2032) (USD Billion)
9.3.6 France
9.3.6.1 France Broadcast Switchers Market Estimates and Forecasts, By Product (2021-2032) (USD Billion)
9.3.6.2 France Broadcast Switchers Market Estimates and Forecasts, By Application (2021-2032) (USD Billion)
9.3.7 UK
9.3.7.1 UK Broadcast Switchers Market Estimates and Forecasts, By Product (2021-2032) (USD Billion)
9.3.7.2 UK Broadcast Switchers Market Estimates and Forecasts, By Application (2021-2032) (USD Billion)
9.3.8 Italy
9.3.8.1 Italy Broadcast Switchers Market Estimates and Forecasts, By Product (2021-2032) (USD Billion)
9.3.8.2 Italy Broadcast Switchers Market Estimates and Forecasts, By Application (2021-2032) (USD Billion)
9.3.9 Spain
9.3.9.1 Spain Broadcast Switchers Market Estimates and Forecasts, By Product (2021-2032) (USD Billion)
9.3.9.2 Spain Broadcast Switchers Market Estimates and Forecasts, By Application (2021-2032) (USD Billion)
9.3.10 Poland
9.3.10.1 Poland Broadcast Switchers Market Estimates and Forecasts, By Product (2021-2032) (USD Billion)
9.3.10.2 Poland Broadcast Switchers Market Estimates and Forecasts, By Application (2021-2032) (USD Billion)
9.3.11 Turkey
9.3.11.1 France Broadcast Switchers Market Estimates and Forecasts, By Product (2021-2032) (USD Billion)
9.3.11.2 France Broadcast Switchers Market Estimates and Forecasts, By Application (2021-2032) (USD Billion)
9.3.12 Rest of Europe
9.3.12.1 UK Broadcast Switchers Market Estimates and Forecasts, By Product (2021-2032) (USD Billion)
9.3.12.2 UK Broadcast Switchers Market Estimates and Forecasts, By Application (2021-2032) (USD Billion)
9.4 Asia-Pacific
9.4.1 Trends Analysis
9.4.2 Asia-Pacific Broadcast Switchers Market Estimates and Forecasts, by Country (2021-2032) (USD Billion)
9.4.3 Asia-Pacific Broadcast Switchers Market Estimates and Forecasts, By Product (2021-2032) (USD Billion)
9.4.4 Asia-Pacific Broadcast Switchers Market Estimates and Forecasts, By Application (2021-2032) (USD Billion)
9.4.5 China
9.4.5.1 China Broadcast Switchers Market Estimates and Forecasts, By Product (2021-2032) (USD Billion)
9.4.5.2 China Broadcast Switchers Market Estimates and Forecasts, By Application (2021-2032) (USD Billion)
9.4.6 India
9.4.5.1 India Broadcast Switchers Market Estimates and Forecasts, By Product (2021-2032) (USD Billion)
9.4.5.2 India Broadcast Switchers Market Estimates and Forecasts, By Application (2021-2032) (USD Billion)
9.4.7 Japan
9.4.7.1 Japan Broadcast Switchers Market Estimates and Forecasts, By Product (2021-2032) (USD Billion)
9.4.7.2 Japan Broadcast Switchers Market Estimates and Forecasts, By Application (2021-2032) (USD Billion)
9.4.8 South Korea
9.4.8.1 South Korea Broadcast Switchers Market Estimates and Forecasts, By Product (2021-2032) (USD Billion)
9.4.8.2 South Korea Broadcast Switchers Market Estimates and Forecasts, By Application (2021-2032) (USD Billion)
9.4.9 Singapore
9.4.9.1 Singapore Broadcast Switchers Market Estimates and Forecasts, By Product (2021-2032) (USD Billion)
9.4.9.2 Singapore Broadcast Switchers Market Estimates and Forecasts, By Application (2021-2032) (USD Billion)
9.4.10 Australia
9.4.10.1 Australia Broadcast Switchers Market Estimates and Forecasts, By Product (2021-2032) (USD Billion)
9.4.10.2 Australia Broadcast Switchers Market Estimates and Forecasts, By Application (2021-2032) (USD Billion)
9.4.11 Taiwan
9.4.11.1 Taiwan Broadcast Switchers Market Estimates and Forecasts, By Product (2021-2032) (USD Billion)
9.4.11.2 Taiwan Broadcast Switchers Market Estimates and Forecasts, By Application (2021-2032) (USD Billion)
9.4.12 Rest of Asia-Pacific
9.4.12.1 Rest of Asia-Pacific Broadcast Switchers Market Estimates and Forecasts, By Product (2021-2032) (USD Billion)
9.4.12.2 Rest of Asia-Pacific Broadcast Switchers Market Estimates and Forecasts, By Application (2021-2032) (USD Billion)
9.5 Middle East and Africa
9.5.1 Trends Analysis
9.5.2 Middle East and Africa Broadcast Switchers Market Estimates and Forecasts, by Country (2021-2032) (USD Billion)
9.5.3 Middle East and Africa Broadcast Switchers Market Estimates and Forecasts, By Product (2021-2032) (USD Billion)
9.5.4 Middle East and Africa Broadcast Switchers Market Estimates and Forecasts, By Application (2021-2032) (USD Billion)
9.5.5 UAE
9.5.5.1 UAE Broadcast Switchers Market Estimates and Forecasts, By Product (2021-2032) (USD Billion)
9.5.5.2 UAE Broadcast Switchers Market Estimates and Forecasts, By Application (2021-2032) (USD Billion)
9.5.6 Saudi Arabia
9.5.6.1 Saudi Arabia Broadcast Switchers Market Estimates and Forecasts, By Product (2021-2032) (USD Billion)
9.5.6.2 Saudi Arabia Broadcast Switchers Market Estimates and Forecasts, By Application (2021-2032) (USD Billion)
9.5.7 Qatar
9.5.7.1 Qatar Broadcast Switchers Market Estimates and Forecasts, By Product (2021-2032) (USD Billion)
9.5.7.2 Qatar Broadcast Switchers Market Estimates and Forecasts, By Application (2021-2032) (USD Billion)
9.5.8 South Africa
9.5.8.1 South Africa Broadcast Switchers Market Estimates and Forecasts, By Product (2021-2032) (USD Billion)
9.5.8.2 South Africa Broadcast Switchers Market Estimates and Forecasts, By Application (2021-2032) (USD Billion)
9.5.9 Rest of Middle East & Africa
9.5.9.1 Rest of Middle East & Africa Broadcast Switchers Market Estimates and Forecasts, By Product (2021-2032) (USD Billion)
9.5.9.2 Rest of Middle East & Africa Broadcast Switchers Market Estimates and Forecasts, By Application (2021-2032) (USD Billion)
9.6 Latin America
9.6.1 Trends Analysis
9.6.2 Latin America Broadcast Switchers Market Estimates and Forecasts, by Country (2021-2032) (USD Billion)
9.6.3 Latin America Broadcast Switchers Market Estimates and Forecasts, By Product (2021-2032) (USD Billion)
9.6.4 Latin America Broadcast Switchers Market Estimates and Forecasts, By Application (2021-2032) (USD Billion)
9.6.5 Brazil
9.6.5.1 Brazil Broadcast Switchers Market Estimates and Forecasts, By Product (2021-2032) (USD Billion)
9.6.5.2 Brazil Broadcast Switchers Market Estimates and Forecasts, By Application (2021-2032) (USD Billion)
9.6.6 Argentina
9.6.6.1 Argentina Broadcast Switchers Market Estimates and Forecasts, By Product (2021-2032) (USD Billion)
9.6.6.2 Argentina Broadcast Switchers Market Estimates and Forecasts, By Application (2021-2032) (USD Billion)
9.6.7 Rest of Latin America
9.6.7.1 Rest of Latin America Broadcast Switchers Market Estimates and Forecasts, By Product (2021-2032) (USD Billion)
9.6.7.2 Rest of Latin America Broadcast Switchers Market Estimates and Forecasts, By Application (2021-2032) (USD Billion)
10. Company Profiles
10.1 Grass Valley
10.1.1 Company Overview
10.1.2 Financial
10.1.3 Products/ Services Offered
10.1.4 SWOT Analysis
10.2 Ross Video
10.2.1 Company Overview
10.2.2 Financial
10.2.3 Products/ Services Offered
10.2.4 SWOT Analysis
10.3 Sony Corporation
10.3.1 Company Overview
10.3.2 Financial
10.3.3 Products/ Services Offered
10.3.4 SWOT Analysis
10.4 Panasonic
10.4.1 Company Overview
10.4.2 Financial
10.4.3 Products/ Services Offered
10.4.4 SWOT Analysis
10.5 Blackmagic Design
10.5.1 Company Overview
10.5.2 Financial
10.5.3 Products/ Services Offered
10.5.4 SWOT Analysis
10.6 Evertz Microsystems
10.6.1 Company Overview
10.6.2 Financial
10.6.3 Products/ Services Offered
10.6.4 SWOT Analysis
10.7 EVS Broadcast Equipment
10.7.1 Company Overview
10.7.2 Financial
10.7.3 Products/ Services Offered
10.7.4 SWOT Analysis
10.8 FOR-A
10.8.1 Company Overview
10.8.2 Financial
10.8.3 Products/ Services Offered
10.8.4 SWOT Analysis
10.9 NewTek
10.9.1 Company Overview
10.9.2 Financial
10.9.3 Products/ Services Offered
10.9.4 SWOT Analysis
10.10 Broadcast Pix
10.10.1 Company Overview
10.10.2 Financial
10.10.3 Products/ Services Offered
10.10.4 SWOT Analysis
11. Use Cases and Best Practices
12. Conclusion
An accurate research report requires proper strategizing as well as implementation. There are multiple factors involved in the completion of good and accurate research report and selecting the best methodology to compete the research is the toughest part. Since the research reports we provide play a crucial role in any company’s decision-making process, therefore we at SNS Insider always believe that we should choose the best method which gives us results closer to reality. This allows us to reach at a stage wherein we can provide our clients best and accurate investment to output ratio.
Each report that we prepare takes a timeframe of 350-400 business hours for production. Starting from the selection of titles through a couple of in-depth brain storming session to the final QC process before uploading our titles on our website we dedicate around 350 working hours. The titles are selected based on their current market cap and the foreseen CAGR and growth.
The 5 steps process:
Step 1: Secondary Research:
Secondary Research or Desk Research is as the name suggests is a research process wherein, we collect data through the readily available information. In this process we use various paid and unpaid databases which our team has access to and gather data through the same. This includes examining of listed companies’ annual reports, Journals, SEC filling etc. Apart from this our team has access to various associations across the globe across different industries. Lastly, we have exchange relationships with various university as well as individual libraries.
Step 2: Primary Research
When we talk about primary research, it is a type of study in which the researchers collect relevant data samples directly, rather than relying on previously collected data. This type of research is focused on gaining content specific facts that can be sued to solve specific problems. Since the collected data is fresh and first hand therefore it makes the study more accurate and genuine.
We at SNS Insider have divided Primary Research into 2 parts.
Part 1 wherein we interview the KOLs of major players as well as the upcoming ones across various geographic regions. This allows us to have their view over the market scenario and acts as an important tool to come closer to the accurate market numbers. As many as 45 paid and unpaid primary interviews are taken from both the demand and supply side of the industry to make sure we land at an accurate judgement and analysis of the market.
This step involves the triangulation of data wherein our team analyses the interview transcripts, online survey responses and observation of on filed participants. The below mentioned chart should give a better understanding of the part 1 of the primary interview.
Part 2: In this part of primary research the data collected via secondary research and the part 1 of the primary research is validated with the interviews from individual consultants and subject matter experts.
Consultants are those set of people who have at least 12 years of experience and expertise within the industry whereas Subject Matter Experts are those with at least 15 years of experience behind their back within the same space. The data with the help of two main processes i.e., FGDs (Focused Group Discussions) and IDs (Individual Discussions). This gives us a 3rd party nonbiased primary view of the market scenario making it a more dependable one while collation of the data pointers.
Step 3: Data Bank Validation
Once all the information is collected via primary and secondary sources, we run that information for data validation. At our intelligence centre our research heads track a lot of information related to the market which includes the quarterly reports, the daily stock prices, and other relevant information. Our data bank server gets updated every fortnight and that is how the information which we collected using our primary and secondary information is revalidated in real time.
Step 4: QA/QC Process
After all the data collection and validation our team does a final level of quality check and quality assurance to get rid of any unwanted or undesired mistakes. This might include but not limited to getting rid of the any typos, duplication of numbers or missing of any important information. The people involved in this process include technical content writers, research heads and graphics people. Once this process is completed the title gets uploader on our platform for our clients to read it.
Step 5: Final QC/QA Process:
This is the last process and comes when the client has ordered the study. In this process a final QA/QC is done before the study is emailed to the client. Since we believe in giving our clients a good experience of our research studies, therefore, to make sure that we do not lack at our end in any way humanly possible we do a final round of quality check and then dispatch the study to the client.
Key Segments:
By Product
Master Control Switchers
Production Switchers
Routing Switchers
By Application
News Production
Sports Production
Post Production
Production Trucks
Studio Production
Others
Request for Segment Customization as per your Business Requirement: Segment Customization Request
Regional Coverage:
North America
US
Canada
Mexico
Europe
Germany
France
UK
Italy
Spain
Poland
Turkey
Rest of Europe
Asia Pacific
China
India
Japan
South Korea
Singapore
Australia
Taiwan
Rest of Asia Pacific
Middle East & Africa
UAE
Saudi Arabia
Qatar
South Africa
Rest of Middle East & Africa
Latin America
Brazil
Argentina
Rest of Latin America
Request for Country Level Research Report: Country Level Customization Request
Available Customization
With the given market data, SNS Insider offers customization as per the company’s specific needs. The following customization options are available for the report:
Detailed Volume Analysis
Criss-Cross segment analysis (e.g. Product X Application)
Competitive Product Benchmarking
Geographic Analysis
Additional countries in any of the regions
Customized Data Representation
Detailed analysis and profiling of additional market players