Ceramic Feedthroughs Market Report Scope & Overview:
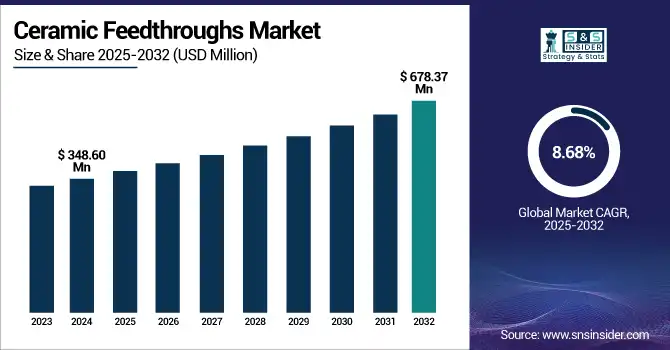
The Ceramic Feedthroughs Market size was valued at USD 348.60 Million in 2024 and is projected to reach USD 678.37 Million by 2032, growing at a CAGR of 8.68% during 2025-2032.
To Get more information on Ceramic Feedthroughs Market - Request Free Sample Report
Ceramic Feedthroughs are in demand for a variety of high-performance components, such as those used in semiconductor manufacturing, aerospace, defense and medical applications. Ceramic feedthroughs enables to Insulate both electrical and mechanical from one side through a panel or bulkhead with high performance in harsh conditions that require a reliable insulation with superior standard. Material science is also developing, in ceramics for example, with new products including alumina, zirconia, and titanate, each offering better properties (e.g. high dielectric strength, corrosive resistance). With the growth in the semiconductor industry and increasingly sophisticated medical devices, the ceramic feedthrough market is forecast to develop, especially in developing regions.
In 2024, CeramTec expanded its Ceramaseal feedthrough line with enhanced RF and high-voltage variants, offering improved performance in plasma and induction applications. The upgrades focus on greater thermal resistance and customizable interconnection solutions for demanding UHV environments.
The U.S. Ceramic Feedthroughs market size was valued at USD 64.17 Million in 2024 and projected to reach USD 109.14 Million by 2032 expanding at a CAGR of 6.86%, fueled by growing need for high-performance, robust equipment in end-use sectors including medical equipment, aerospace, and electronics. Technical progress such as the invention of sturdy, high-temperature ceramics, also drive the market's growth, making it possible for the products to be used in a variety of demanding conditions where the durable, reliable solutions are needed.
Ceramic Feedthroughs Market Dynamics:
Drivers:
-
Increasing Consumption of Renewable Energy Leads to Demand for Long-lasting Ceramic Feedthroughs
With demand for alternative energy sources like nuclear fusion and hydrogen power on the rise, there is an emerging need to develop advanced materials that can withstand harsh environments. Ceramic feedthroughs are reportedly the key element in these systems giving high strength, high insulation and corrosion resistance. These kind of components ensure reliable and safe operation of heating systems working under high temperature and chemically aggressive environment. They play a critical role in the development of the next generation of clean energy technology, requiring robustness and performance in challenging environments for effective long-term deployment.
Kyocera Fine Ceramics are integral enabling components for renewable energy in fusion and hydrogen power applications, as they provide the longest life and reliability in extreme environments. Its unique components including feedthroughs and RF windows, optimize next gen energy systems in power and standing wave.
Restraints:
-
Customization Complexity Leads to Increased Costs and Limits Market Scalability
The complexity of customization is a significant restraint in the ceramic feedthroughs market. Designing ceramic feedthroughs to meet the unique requirements of very end-use specific applications is a classic piece of engineering in that design, testing, prototyping and iterations are all usually involved. This adds to lead times and production costs, making scaling hard for makers. The variety feedthroughs in an array of markets like aerospace, medical and renewable energy only adds to the complexity, as custom designs are sometimes necessary to accurate specs. This can make it difficult for manufacturers to fulfill volume orders without pricing themselves out of the marketplace, thereby limiting the market’s growth potential.
Opportunities:
-
Technological Advancements in Aerospace and Medical Sectors Drive Demand for Customized Ceramic Feedthroughs
Increasing demand for customization in aerospace and medical device industries is a major opportunity for the ceramic feedthroughs market. Both industries require unique parts resistant to the harshest environments including heat, pressure and chemicals. Ceramic feedthroughs, custom the best ceramic feedthroughs are custom-made, providing just the right electrical, mechanical and thermal insulation needed for safe and efficient operation of new systems. In aviation, they assure reliable communication and power; medical function, performance and critical precision depend on their successful application. The market will grow and evolve in both sectors as we both react to the requirements of the advancing technology and the demand for custom ceramic feedthroughs will be on the rise.
Innovacera have taken Ceramic-to-Metal seal technology to a new level by brazing the ceramic & metal components using high purity alumina ceramics and precise metal alloys and helium leak testing the assemblies, that gives faultless performance in medical and aerospace applications. This development strengthens hermetic sealing and electrical isolation in increasingly demanding operational environments.
Challenges:
-
Customization Requirements Cause Delays in Deployment Due to Limited Design Flexibility in Ceramic Feedthroughs
The ceramic feedthroughs market faces a significant challenge due to limited design Such applications may typically require electrical connecting devices which can be designed to meet specific technical requirements set forth by the application, such as size limitations, electrical characteristics, and environmental capabilities. Nevertheless, the custom-made ceramic feedthroughs required substantial engineering work, several prototype iterations and compatibility tests between ceramic and metals. The down side of this level of customization is much longer development time and cost, resulting in longer lead times that can challenge quick deployment of important systems. Manufacturers may also find it difficult to support rapidly changing requirements of the market or address urgent customer needs, reducing competitiveness and the pace of adoption in rapidly-evolving, innovation-based sectors.
Ceramic Feedthroughs Market Segment Analysis:
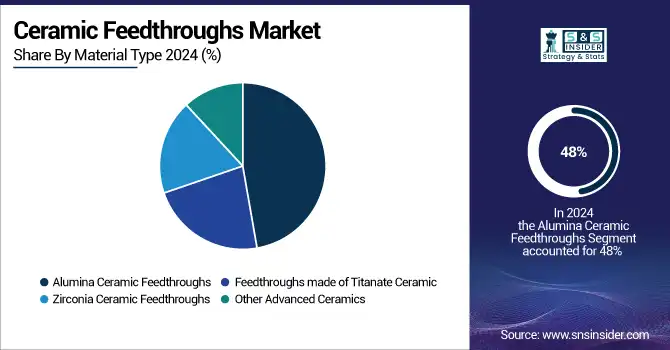
By Material Type
The alumina ceramic feedthroughs segment held a dominant ceramic feedthroughs market share of around 48% in 2024, due to better electrical insulation, high-temperature resistance and mechanical strength. Its widespread used is also being used in vacuum systems, semiconductors manufacturing, and medical equipment. This drives demand, when industries want more robust and reliable components in harsh service conditions.
The feedthroughs made of titanate ceramic segment is expected to witness the fastest growth in the ceramic feedthroughs market over 2025-2032, with a CAGR of 10.38%, due to its better dielectric properties, low cost and high operating frequencies. Growing applications in the telecom, aerospace, and energy industry drive the market as it is highly dependable in high voltages and extreme temperatures.
By Application
The medical devices segment held a dominant the ceramic feedthroughs market share of around 30% in 2024, driven by the increasing demand for biocompatible, durable, and hermetically sealed components in implantable devices and surgical equipment. Rising healthcare investments, aging populations, and technological advancements in medical electronics continue to propel segment growth.
The defense and aerospace segment is projected to grow fastest in the ceramic feedthroughs market from 2025 to 2032, with a CAGR of 10.25%, because of increased demand for precision optical measurement in advanced materials, coatings, and surveillance systems, demand for defense technologies and high investments in aerospace innovation.
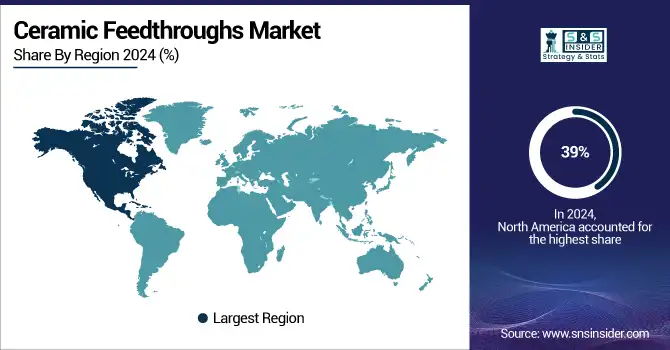
Ceramic Feedthroughs Market Regional Analysis:
In 2024, the Asia Pacific dominated the ceramic feedthroughs market and accounted for 39% of revenue share and is projected to experience fastest growth in the market during 2025-2032, at a CAGR of 10.30%., by the rapid industrialization, strong base of manufacturing, and growing demand for advanced electronics, medical devices, and automotive applications. Support of government projects for technology development and investments in defense and aerospace also drive the regional market growth.
In Asia Pacific region, China dominated ceramic feedthroughs market, owing to high production activities, technological developments, and increase in industrialization.
North America is projected to register the significant CAGR of 7.90% during 2025-2032, owing to rising demand for high-tech electronics, medical devices, aerospace technologies. A strong emphasis on innovation, high R&D investments, and increasing applications in the defense and automotive sectors in the region are driving the market. The U.S. owing to the country’s exposure to consumer and electronics and consumer goods markets and rapid advancements dominates US Ceramic Digital Ink market demand.
In 2024, Europe emerged as a promising region in the ceramic feedthroughs market, due to rising applications across the automotive, medical, and aerospace industry. The region’s emphasis on innovation and commitment to R&D and sustainable manufacturing is also accelerating the industry’s continual growth and industrial use.
LATAM and MEA is experiencing steady growth in the ceramic feedthroughs market, due to growing industrialization and rising demand for modern technologies in the electronics, automotive, and energy sectors. Increasing investments toward defense and healthcare, along with growing emphasis on infrastructural development are further contributing to the market expansion in these regions.
Get Customized Report as per Your Business Requirement - Enquiry Now
Ceramic Feedthroughs Companies are:
The ceramic feedthroughs market companies are CeramTec, Morgan Advanced Materials, Schott AG, Stellar Technology, Kyocera, Amphenol, Conax Technologies, Leoni AG, CoorsTek Inc., and Maxic Technologies and Others.
Recent Developments:
-
In October 2024, Morgan Advanced Materials introduced a charge-dissipative coating at ASNT 2024, reducing X-ray tube conditioning time from one week to two days, optimizing production efficiency. The company also emphasized its commitment to sustainability, showcasing products that help reduce energy consumption and support clean energy initiatives.
-
In July 2024, CoorsTek highlighted its semiconductor processing components at Semicon West 2024, offering custom ceramics to enhance yields, throughput, and device performance. Their solutions improve processes like deposition, etching, and wafer handling.
| Report Attributes | Details |
|---|---|
| Market Size in 2024 | USD 348.60 Million |
| Market Size by 2032 | USD 678.37 Million |
| CAGR | CAGR of 8.68% From 2025 to 2032 |
| Base Year | 2024 |
| Forecast Period | 2025-2032 |
| Historical Data | 2021-2023 |
| Report Scope & Coverage | Market Size, Segments Analysis, Competitive Landscape, Regional Analysis, DROC & SWOT Analysis, Forecast Outlook |
| Key Segments | • By Material Type(Alumina Ceramic Feedthroughs, Feedthroughs made of Titanate Ceramic, Zirconia Ceramic Feedthroughs and Other Advanced Ceramics) • By Application(Medical Devices, Defense and Aerospace, Semiconductor Manufacturing and Oil and Gas) |
| Regional Analysis/Coverage | North America (US, Canada, Mexico), Europe (Germany, France, UK, Italy, Spain, Poland, Turkey, Rest of Europe), Asia Pacific (China, India, Japan, South Korea, Singapore, Australia, Rest of Asia Pacific), Middle East & Africa (UAE, Saudi Arabia, Qatar, South Africa, Rest of Middle East & Africa), Latin America (Brazil, Argentina, Rest of Latin America) |
| Company Profiles | The ceramic feedthroughs market companies CeramTec, Morgan Advanced Materials, Schott AG, Stellar Technology, Kyocera, Amphenol, Conax Technologies, Leoni AG, CoorsTek Inc., and Maxic Technologies and Others. |
Frequently Asked Questions
Asia-Pacific dominated the Ceramic Feedthroughs Market in 2024.
The “Alumina Ceramic Feedthroughs” segment dominated the Ceramic Feedthroughs Market.
The Ceramic Feedthroughs Market is driven by demand in semiconductor manufacturing, aerospace, medical devices, and harsh environment applications like oil and gas.
The Ceramic Feedthroughs Market was USD 348.60 Million in 2024 and is expected to Reach USD 678.37 Million by 2032.
The Ceramic Feedthroughs Market is expected to grow at a CAGR of 8.68% during 2025-2032.
Get in Touch
