Get More Information on Chemicals Digitalization Market - Request Free Sample Report
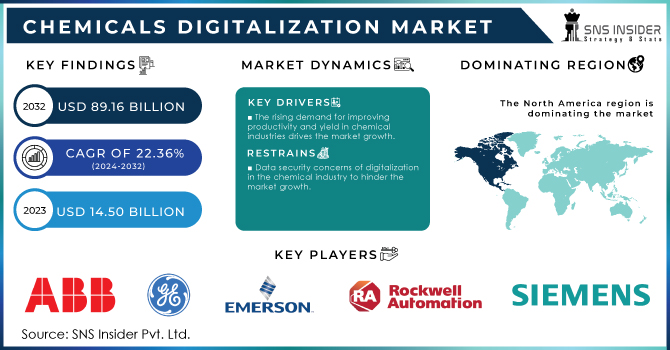
The Chemicals Digitalization Market Size was valued at USD 14.50 billion in 2023 and is expected to reach USD 89.16 billion by 2032 and grow at a CAGR of 22.36% over the forecast period 2024-2032.
Increasing adoption of data analytics, automation, and other technological advancements in business on a global scale has growing the demand for chemical digitalization market. Manufacturers in the chemicals sector benefit from increased digitalization in terms of customer satisfaction, manufacturing capacity, and competitiveness which drive the market growth.
In April 2024, Hitachi Energy announced to its increase its global transformer manufacturing by spending an USD 1.5 billion. This investment span across Europe, Asia, and North America.
Digital twin in chemicals can be a game-changer in this pursuit by optimizing resource usage, minimizing waste, and enhancing safety measures. With these driving forces and government support for research and development in digital manufacturing processes, the chemicals digitalization market is poised for a prosperous future.
The demand for more efficient and continuous manufacturing techniques, the use of cutting-edge digital technology, and improved batch production scheduling are some of the factors propelling the expansion of the digital chemicals market. Moreover, the demand for specialty chemical digitalization globally is forecasted to rise as a result of the substantial increase being seen by a number of end-user industries within the chemical digitalization industry in the region, including water treatment, cars, electronics, and personal care items.
In the chemical industry, digitalization is a revolution in progress such as, data and analytics are the key source, of uncovering opportunities for improvement. Manual tasks are on the endangered list as automation takes the wheel, supercharging productivity. Digitalization fosters a collaborative ecosystem with industry partners, suppliers, and customers. Sharing data, knowledge, and resources through digital platforms fuels innovation and ignites the engine of progress. The verdict is clear – digitalization is a transformative force for the chemical industry.
Drivers
The rising demand for improving productivity and yield in chemical industries drives the market growth.
Chemical companies are locked in a constant battle to maximize output and efficiency. This relentless pursuit of enhanced productivity and yield is a critical factor driving the surging growth of the chemical’s digitalization market. By deploying digital tools and technologies, chemical companies can unlock substantial gains in these areas. Data analytics and automation act as powerful weapons in this arsenal, identifying areas for improvement and streamlining operations. This translates to churning out more product in less time, or extracting a greater percentage of the desired product from a chemical reaction. In essence, digitalization empowers chemical companies to achieve greater output while optimizing resource consumption, fueling the market's impressive growth trajectory.
Rapidly increasing advanced digital technologies and innovation in the market has been drive the market growth.
The chemicals digitalization market is on a tear, propelled by the immediate pace of innovation in advanced new technologies in chemical and the relentless march of ingenuity within the industry. a constant stream of cutting-edge tools is flooding the market, empowering chemical companies with an ever-expanding toolkit to outmaneuver inefficiency. from the strategic deployment of artificial intelligence to the integration of machine learning and the internet of things (iot), these technologies are revolutionizing the way chemicals are produced. but the plot thickens. the market itself is a crucible of creativity, where companies are constantly forging new pathways to exploit the potential of these digital advancements. this symbiotic relationship between powerful instruments and ingenious applications is propelling the chemicals digitalization market towards a prosperous future.
Restrain
Data security concerns of digitalization in the chemical industry to hinder the market growth
Digital transformation in the chemical industry has opportunities but have lots of challenge. As chemical plants become data repositories overflowing with confidential formulas, intricate production processes, and potentially sensitive customer information, they morph into a tempting target for cybercriminals. These digital adversaries may launch cyberattacks to steal this valuable data, fueling industrial espionage and crippling a competitor's edge. In essence, the data that fuels the efficiency gains of digitalization also presents a security minefield that chemical as a service companies must skillfully disarm.
By Product
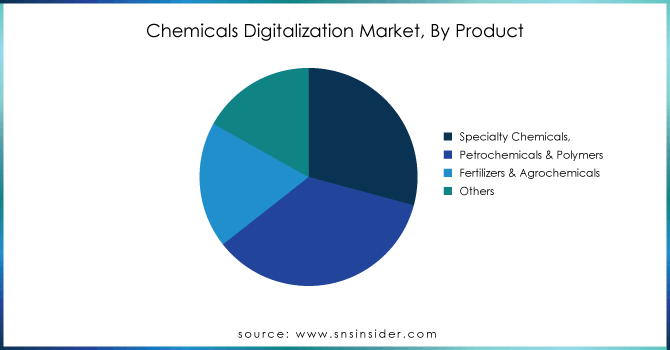
The petrochemicals & polymers held the largest market share approx. 35.20% in Product segment in 2023. Due to many industries including plastics, packaging, clothing, electronics, medical devices and detergents, rely heavily on these products. Most beverages and personal hygiene products are packaged in polyethylene terephthalate (PET) bottles, which are made from ethylene and paraxylene Also, the automotive industry relies heavily on polymers and plastics for lightweight, supply fuel efficiency and reduced emissions.
The specialty chemicals segment covers a wide range of products, including adhesives and coatings, agricultural chemicals, construction and electronic chemicals, flavours and fragrances, polymers, and catalysts, etc. These chemicals are used to provide durability, performance and excellent aesthetics. They are also used in a variety of applications to provide specific applications in infrastructure.
Get Customized Report as per your Business Requirement - Request For Customized Report
By Process
The manufacturing segment hold the largest revenue share in chemicals digitalization market in 2023. Digitalization is essential for increasing productivity, assuring product quality, and streamlining industrial processes. It may improve production parameters, cut waste, and boost overall productivity by implementing modern process control systems and real-time monitoring.
The R&D program segment of the global chemical labelling market focuses on innovation, product development and enhancement of existing chemical products. Digitization has transformed R&D through the use of virtual simulations, data analysis and machine learning algorithms. Computer-aided design and computer-aided engineering enable researchers to model and simulate chemical reactions, predict product performance, and optimize products before manufacturing physical testing.
North America dominated the market and held the largest market share approx. 35.00% and is forecasted to grow at the quickest CAGR of 22.50% throughout the course of the forecast period. The region is known for its advanced technological infrastructure, strong research and development and strong pharmaceutical industry. Companies in North America are leading digital efforts, using technologies such as AI, IoT and data analytics to streamline processes, improve manufacturing efficiencies and improve supply chain management. Moreover, adoption of digital solutions in areas such as precision agriculture where farmers are leveraging data-driven insights to optimize crop production and resource utilization.
Europe held the second largest market in the chemical digitalization market. The facility is known for its emphasis on sustainability and environmental standards, as well as a strong pharmaceutical industry. The digitization of Europe drives efficiency and innovation across a range of medicines. This is primarily due to digital advances in areas such as green technology and sustainable medicine, which use digital to improve sustainable development and reduce negative impacts on the environment do UK businesses use digital technologies to enhance productivity, streamline supply chains and improve product quality.
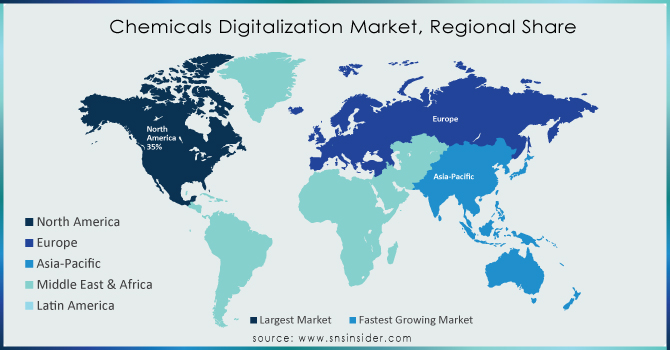
ABB Ltd., General Electric, Emerson Electric, Rockwell Automation, Siemens AG, Yokogawa Electric Corporation, Honeywell International, Mitsubishi Chemical Group Corporation, Solvay, Henkel Adhesives and others.
Recent Development:
In December 2023, Henkel Adhesives partnered with Tata Consultancy Services To boost efficiency, Henkel is standardizing ordering across subsidiaries and optimizing customer service processes.
In July 2023, Reliance Industries Limited signed the agreement with Brookfield Infrastructure and to invest in setting up and developing data centers around India.
Report Attributes | Details |
---|---|
Market Size in 2023 | US$ 14.50 billion |
Market Size by 2032 | US$ 89.16 Billion |
CAGR | CAGR of 22.36 % From 2024 to 2032 |
Base Year | 2023 |
Forecast Period | 2024-2032 |
Historical Data | 2020-2022 |
Report Scope & Coverage | Market Size, Segments Analysis, Competitive Landscape, Regional Analysis, DROC & SWOT Analysis, Forecast Outlook |
Key Segments | •By Product (Specialty Chemicals, Petrochemicals & Polymers, Fertilizers & Agrochemicals, and Others) •By Process (Manufacturing, R&D, Procurement, Supply Chain & Logistics, and Packaging) |
Regional Analysis/Coverage | North America (US, Canada, Mexico), Europe (Eastern Europe [Poland, Romania, Hungary, Turkey, Rest of Eastern Europe] Western Europe] Germany, France, UK, Italy, Spain, Netherlands, Switzerland, Austria, Rest of Western Europe]), Asia Pacific (China, India, Japan, South Korea, Vietnam, Singapore, Australia, Rest of Asia Pacific), Middle East & Africa (Middle East [UAE, Egypt, Saudi Arabia, Qatar, Rest of Middle East], Africa [Nigeria, South Africa, Rest of Africa], Latin America (Brazil, Argentina, Colombia, Rest of Latin America) |
Company Profiles | ABB Ltd., General Electric, Emerson Electric, Rockwell Automation, Siemens AG, Yokogawa Electric Corporation, Honeywell International, Mitsubishi Chemical Group Corporation, Solvay, Henkel Adhesives and others. |
Key Drivers | • The rising demand for improving productivity and yield in chemical industries drives the market growth |
RESTRAINTS | • Data security concerns of digitalization in the chemical industry to hinder the market growth |
Ans: The Chemicals Digitalization Market was valued at USD 14.50 billion in 2023.
Ans: The expected CAGR of the global Chemicals Digitalization Market during the forecast period is 22.36%.
Ans: The petrochemicals & polymers will grow rapidly in the Chemicals Digitalization Market from 2024-2032.
Ans: Factor such as, data security concerns of digitalization in the chemical industry to hinder the market growth
Ans: The U.S. led the Chemicals Digitalization Market in North America region with highest revenue share in 2023.
Table of Contents
1. Introduction
1.1 Market Definition
1.2 Scope
1.3 Research Assumptions
2. Industry Flowchart
3. Research Methodology
4. Market Dynamics
4.1 Drivers
4.2 Restraints
4.3 Opportunities
4.4 Challenges
5. Porter’s 5 Forces Model
6. Pest Analysis
7. Chemicals Digitalization Market Segmentation, By Product
7.1 Introduction
7.2 Specialty Chemicals,
7.3 Petrochemicals & Polymers,
7.4 Fertilizers & Agrochemicals
7.5 Others
8. Chemicals Digitalization Market Segmentation, By Process
8.1 Introduction
8.2 Manufacturing
8.3 R&D
8.4 Procurement
8.5 Supply Chain & Logistic
8.6 Packaging
9. Regional Analysis
9.1 Introduction
9.2 North America
9.2.1 Trend Analysis
9.2.2 North America Chemicals Digitalization Market by Country
9.2.3 North America Chemicals Digitalization Market By Product
9.2.4 North America Chemicals Digitalization Market By Process
9.2.5 USA
9.2.5.1 USA Chemicals Digitalization Market By Product
9.2.5.2 USA Chemicals Digitalization Market By Process
9.2.6 Canada
9.2.6.1 Canada Chemicals Digitalization Market By Product
9.2.6.2 Canada Chemicals Digitalization Market By Process
9.2.7 Mexico
9.2.7.1 Mexico Chemicals Digitalization Market By Product
9.2.7.2 Mexico Chemicals Digitalization Market By Process
9.3 Europe
9.3.1 Trend Analysis
9.3.2 Eastern Europe
9.3.2.1 Eastern Europe Chemicals Digitalization Market by Country
9.3.2.2 Eastern Europe Chemicals Digitalization Market By Product
9.3.2.3 Eastern Europe Chemicals Digitalization Market By Process
9.3.2.4 Poland
9.3.2.4.1 Poland Chemicals Digitalization Market By Product
9.3.2.4.2 Poland Chemicals Digitalization Market By Process
9.3.2.5 Romania
9.3.2.5.1 Romania Chemicals Digitalization Market By Product
9.3.2.5.2 Romania Chemicals Digitalization Market By Process
9.3.2.6 Hungary
9.3.2.6.1 Hungary Chemicals Digitalization Market By Product
9.3.2.6.2 Hungary Chemicals Digitalization Market By Process
9.3.2.7 Turkey
9.3.2.7.1 Turkey Chemicals Digitalization Market By Product
9.3.2.7.2 Turkey Chemicals Digitalization Market By Process
9.3.2.8 Rest of Eastern Europe
9.3.2.8.1 Rest of Eastern Europe Chemicals Digitalization Market By Product
9.3.2.8.2 Rest of Eastern Europe Chemicals Digitalization Market By Process
9.3.3 Western Europe
9.3.3.1 Western Europe Chemicals Digitalization Market by Country
9.3.3.2 Western Europe Chemicals Digitalization Market By Product
9.3.3.3 Western Europe Chemicals Digitalization Market By Process
9.3.3.4 Germany
9.3.3.4.1 Germany Chemicals Digitalization Market By Product
9.3.3.4.2 Germany Chemicals Digitalization Market By Process
9.3.3.5 France
9.3.3.5.1 France Chemicals Digitalization Market By Product
9.3.3.5.2 France Chemicals Digitalization Market By Process
9.3.3.6 UK
9.3.3.6.1 UK Chemicals Digitalization Market By Product
9.3.3.6.2 UK Chemicals Digitalization Market By Process
9.3.3.7 Italy
9.3.3.7.1 Italy Chemicals Digitalization Market By Product
9.3.3.7.2 Italy Chemicals Digitalization Market By Process
9.3.3.8 Spain
9.3.3.8.1 Spain Chemicals Digitalization Market By Product
9.3.3.8.2 Spain Chemicals Digitalization Market By Process
9.3.3.9 Netherlands
9.3.3.9.1 Netherlands Chemicals Digitalization Market By Product
9.3.3.9.2 Netherlands Chemicals Digitalization Market By Process
9.3.3.10 Switzerland
9.3.3.10.1 Switzerland Chemicals Digitalization Market By Product
9.3.3.10.2 Switzerland Chemicals Digitalization Market By Process
9.3.3.11 Austria
9.3.3.11.1 Austria Chemicals Digitalization Market By Product
9.3.3.11.2 Austria Chemicals Digitalization Market By Process
9.3.3.12 Rest of Western Europe
9.3.3.12.1 Rest of Western Europe Chemicals Digitalization Market By Product
9.3.2.12.2 Rest of Western Europe Chemicals Digitalization Market By Process
9.4 Asia-Pacific
9.4.1 Trend Analysis
9.4.2 Asia Pacific Chemicals Digitalization Market by Country
9.4.3 Asia Pacific Chemicals Digitalization Market By Product
9.4.4 Asia Pacific Chemicals Digitalization Market By Process
9.4.5 China
9.4.5.1 China Chemicals Digitalization Market By Product
9.4.5.2 China Chemicals Digitalization Market By Process
9.4.6 India
9.4.6.1 India Chemicals Digitalization Market By Product
9.4.6.2 India Chemicals Digitalization Market By Process
9.4.7 Japan
9.4.7.1 Japan Chemicals Digitalization Market By Product
9.4.7.2 Japan Chemicals Digitalization Market By Process
9.4.8 South Korea
9.4.8.1 South Korea Chemicals Digitalization Market By Product
9.4.8.2 South Korea Chemicals Digitalization Market By Process
9.4.9 Vietnam
9.4.9.1 Vietnam Chemicals Digitalization Market By Product
9.4.9.2 Vietnam Chemicals Digitalization Market By Process
9.4.10 Singapore
9.4.10.1 Singapore Chemicals Digitalization Market By Product
9.4.10.2 Singapore Chemicals Digitalization Market By Process
9.4.11 Australia
9.4.11.1 Australia Chemicals Digitalization Market By Product
9.4.11.2 Australia Chemicals Digitalization Market By Process
9.4.12 Rest of Asia-Pacific
9.4.12.1 Rest of Asia-Pacific Chemicals Digitalization Market By Product
9.4.12.2 Rest of Asia-Pacific Chemicals Digitalization Market By Process
9.5 Middle East & Africa
9.5.1 Trend Analysis
9.5.2 Middle East
9.5.2.1 Middle East Chemicals Digitalization Market by Country
9.5.2.2 Middle East Chemicals Digitalization Market By Product
9.5.2.3 Middle East Chemicals Digitalization Market By Process
9.5.2.4 UAE
9.5.2.4.1 UAE Chemicals Digitalization Market By Product
9.5.2.4.2 UAE Chemicals Digitalization Market By Process
9.5.2.5 Egypt
9.5.2.5.1 Egypt Chemicals Digitalization Market By Product
9.5.2.5.2 Egypt Chemicals Digitalization Market By Process
9.5.2.6 Saudi Arabia
9.5.2.6.1 Saudi Arabia Chemicals Digitalization Market By Product
9.5.2.6.2 Saudi Arabia Chemicals Digitalization Market By Process
9.5.2.7 Qatar
9.5.2.7.1 Qatar Chemicals Digitalization Market By Product
9.5.2.7.2 Qatar Chemicals Digitalization Market By Process
9.5.2.8 Rest of Middle East
9.5.2.8.1 Rest of Middle East Chemicals Digitalization Market By Product
9.5.2.8.2 Rest of Middle East Chemicals Digitalization Market By Process
9.5.3 Africa
9.5.3.1 Africa Chemicals Digitalization Market by Country
9.5.3.2 Africa Chemicals Digitalization Market By Product
9.5.3.3 Africa Chemicals Digitalization Market By Process
9.5.2.4 Nigeria
9.5.2.4.1 Nigeria Chemicals Digitalization Market By Product
9.5.2.4.2 Nigeria Chemicals Digitalization Market By Process
9.5.2.5 South Africa
9.5.2.5.1 South Africa Chemicals Digitalization Market By Product
9.5.2.5.2 South Africa Chemicals Digitalization Market By Process
9.5.2.6 Rest of Africa
9.5.2.6.1 Rest of Africa Chemicals Digitalization Market By Product
9.5.2.6.2 Rest of Africa Chemicals Digitalization Market By Process
9.6 Latin America
9.6.1 Trend Analysis
9.6.2 Latin America Chemicals Digitalization Market by Country
9.6.3 Latin America Chemicals Digitalization Market By Product
9.6.4 Latin America Chemicals Digitalization Market By Process
9.6.5 Brazil
9.6.5.1 Brazil Chemicals Digitalization Market By Product
9.6.5.2 Brazil Chemicals Digitalization Market By Process
9.6.6 Argentina
9.6.6.1 Argentina Chemicals Digitalization Market By Product
9.6.6.2 Argentina Chemicals Digitalization Market By Process
9.6.7 Colombia
9.6.7.1 Colombia Chemicals Digitalization Market By Product
9.6.7.2 Colombia Chemicals Digitalization Market By Process
9.6.8 Rest of Latin America
9.6.8.1 Rest of Latin America Chemicals Digitalization Market By Product
9.6.8.2 Rest of Latin America Chemicals Digitalization Market By Process
10. Company Profiles
10.1 ABB Ltd
10.1.1 Company Overview
10.1.2 Financial
10.1.3 Products/ Services Offered
10.1.4 The SNS View
10.2 General Electric
10.2.1 Company Overview
10.2.2 Financial
10.2.3 Products/ Services Offered
10.2.4 The SNS View
10.3 Emerson Electric
10.3.1 Company Overview
10.3.2 Financial
10.3.3 Products/ Services Offered
10.3.4 The SNS View
10.4 Rockwell Automation
10.4.1 Company Overview
10.4.2 Financial
10.4.3 Products/ Services Offered
10.4.4 The SNS View
10.5 Siemens AG
10.5.1 Company Overview
10.5.2 Financial
10.5.3 Products/ Services Offered
10.5.4 The SNS View
10.6 Yokogawa Electric Corporation
10.6.1 Company Overview
10.6.2 Financial
10.6.3 Products/ Services Offered
10.6.4 The SNS View
10.7 Honeywell International
10.7.1 Company Overview
10.7.2 Financial
10.7.3 Products/ Services Offered
10.7.4 The SNS View
10.8 Mitsubishi Chemical Group Corporation
10.8.1 Company Overview
10.8.2 Financial
10.8.3 Products/ Services Offered
10.8.4 The SNS View
10.9 Solvay
10.9.1 Company Overview
10.9.2 Financial
10.9.3 Products/ Services Offered
10.9.4 The SNS View
10.10 Henkel Adhesives
10.10.1 Company Overview
10.10.2 Financial
10.10.3 Products/ Services Offered
10.10.4 The SNS View
11. Competitive Landscape
11.1 Competitive Benchmarking
11.2 Market Share Analysis
11.3 Recent Developments
11.3.1 Industry News
11.3.2 Company News
11.3.3 Mergers & Acquisitions
12. USE Cases and Best Practices
13. Conclusion
An accurate research report requires proper strategizing as well as implementation. There are multiple factors involved in the completion of good and accurate research report and selecting the best methodology to compete the research is the toughest part. Since the research reports we provide play a crucial role in any company’s decision-making process, therefore we at SNS Insider always believe that we should choose the best method which gives us results closer to reality. This allows us to reach at a stage wherein we can provide our clients best and accurate investment to output ratio.
Each report that we prepare takes a timeframe of 350-400 business hours for production. Starting from the selection of titles through a couple of in-depth brain storming session to the final QC process before uploading our titles on our website we dedicate around 350 working hours. The titles are selected based on their current market cap and the foreseen CAGR and growth.
The 5 steps process:
Step 1: Secondary Research:
Secondary Research or Desk Research is as the name suggests is a research process wherein, we collect data through the readily available information. In this process we use various paid and unpaid databases which our team has access to and gather data through the same. This includes examining of listed companies’ annual reports, Journals, SEC filling etc. Apart from this our team has access to various associations across the globe across different industries. Lastly, we have exchange relationships with various university as well as individual libraries.
Step 2: Primary Research
When we talk about primary research, it is a type of study in which the researchers collect relevant data samples directly, rather than relying on previously collected data. This type of research is focused on gaining content specific facts that can be sued to solve specific problems. Since the collected data is fresh and first hand therefore it makes the study more accurate and genuine.
We at SNS Insider have divided Primary Research into 2 parts.
Part 1 wherein we interview the KOLs of major players as well as the upcoming ones across various geographic regions. This allows us to have their view over the market scenario and acts as an important tool to come closer to the accurate market numbers. As many as 45 paid and unpaid primary interviews are taken from both the demand and supply side of the industry to make sure we land at an accurate judgement and analysis of the market.
This step involves the triangulation of data wherein our team analyses the interview transcripts, online survey responses and observation of on filed participants. The below mentioned chart should give a better understanding of the part 1 of the primary interview.
Part 2: In this part of primary research the data collected via secondary research and the part 1 of the primary research is validated with the interviews from individual consultants and subject matter experts.
Consultants are those set of people who have at least 12 years of experience and expertise within the industry whereas Subject Matter Experts are those with at least 15 years of experience behind their back within the same space. The data with the help of two main processes i.e., FGDs (Focused Group Discussions) and IDs (Individual Discussions). This gives us a 3rd party nonbiased primary view of the market scenario making it a more dependable one while collation of the data pointers.
Step 3: Data Bank Validation
Once all the information is collected via primary and secondary sources, we run that information for data validation. At our intelligence centre our research heads track a lot of information related to the market which includes the quarterly reports, the daily stock prices, and other relevant information. Our data bank server gets updated every fortnight and that is how the information which we collected using our primary and secondary information is revalidated in real time.
Step 4: QA/QC Process
After all the data collection and validation our team does a final level of quality check and quality assurance to get rid of any unwanted or undesired mistakes. This might include but not limited to getting rid of the any typos, duplication of numbers or missing of any important information. The people involved in this process include technical content writers, research heads and graphics people. Once this process is completed the title gets uploader on our platform for our clients to read it.
Step 5: Final QC/QA Process:
This is the last process and comes when the client has ordered the study. In this process a final QA/QC is done before the study is emailed to the client. Since we believe in giving our clients a good experience of our research studies, therefore, to make sure that we do not lack at our end in any way humanly possible we do a final round of quality check and then dispatch the study to the client.
Key Segments:
By Product
• Specialty Chemicals,
• Petrochemicals & Polymers
• Fertilizers & Agrochemicals
• Others
By Process
• Manufacturing
• R&D
• Procurement
• Supply Chain & Logistic
• Packaging
Request for Segment Customization as per your Business Requirement: Segment Customization Request
Regional Coverage:
Regional Coverage
North America
US
Canada
Mexico
Europe
Eastern Europe
Poland
Romania
Hungary
Turkey
Rest of Eastern Europe
Western Europe
Germany
France
UK
Italy
Spain
Netherlands
Switzerland
Austria
Rest of Western Europe
Asia Pacific
China
India
Japan
South Korea
Vietnam
Singapore
Australia
Rest of Asia Pacific
Middle East & Africa
Middle East
UAE
Egypt
Saudi Arabia
Qatar
Rest of Middle East
Africa
Nigeria
South Africa
Rest of Africa
Latin America
Brazil
Argentina
Colombia
Rest of Latin America
Request for Country Level Research Report: Country Level Customization Request
Available Customization
With the given market data, SNS Insider offers customization as per the company’s specific needs. The following customization options are available for the report:
Product Analysis
Criss-Cross segment analysis (e.g. Product X Application)
Product Matrix which gives a detailed comparison of product portfolio of each company
Geographic Analysis
Additional countries in any of the regions
Company Information
Detailed analysis and profiling of additional market players (Up to five)
The Micro Injection Molded Plastic Market Size was valued at USD 1.19 billion in 2023, and is expected to reach USD 2.802 billion by 2031, and grow at a CAGR of 11.3% over the forecast period 2024-2031.
The Sodium Nitrite Market size was valued at 423 USD million in 2022 and is expected to grow to 574.46 USD million by 2030 and grow at a CAGR of 3.9% over the forecast period of 2023-2030.
The Palmitic Acid Market Size was valued at USD 301.7 million in 2023, and is expected to reach USD 384.6 million by 2032, and grow at a CAGR of 2.8% over the forecast period 2024-2032.
The Feed Mycotoxin Detoxifiers Market size was valued at USD 2.6 Billion in 2023. It is expected to grow to USD 3.8 Billion by 2032 and grow at a CAGR of 4.2% over the forecast period of 2024-2032.
The Maleic Anhydride Market Size was valued at expected to reach USD 4.30 billion by 2030, and USD 3.03 billion in 2022 and grow at a CAGR of 4.5% over the forecast period 2023-2030.
The Collagen Peptides Market size was valued at USD 2.23 Billion in 2023 and is expected to grow to USD 5.34 billion by 2031 and grow at a CAGR of 11.8% over the forecast period of 2024-2031.
Hi! Click one of our member below to chat on Phone