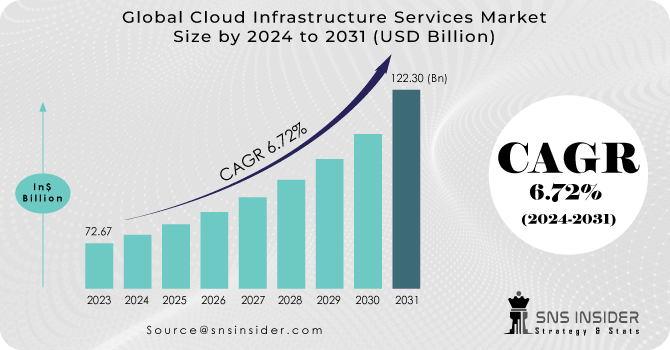
Cloud Infrastructure Services Market size was valued at USD 72.67 Bn in 2023 and is expected to reach USD 122.30 Bn by 2031, and grow at a CAGR of 6.72 % over the forecast period 2024-2031.
The Major drivers for the cloud infrastructure services market include cost-effectiveness, scalability, flexibility, and security, leading to accelerated Time-to-Market (TTM) and rapid application development. The growing need to reduce operational costs and IT infrastructure maintenance also drives organizations to adopt cloud services. the increase in global data volumes and the adoption of cloud technologies for improved security of data, integrity, and service delivery drives the market growth.
Get More Information on Cloud Infrastructure Services Market - Request Sample Report
The virtualization of infrastructure across a network or the internet is known as cloud infrastructure. Software as a service, platform as a service, infrastructure as a service, cloud business process as a service, content delivery network /application delivery network, and colocation hosting are examples of delivery methods used by cloud infrastructure. The Cloud Infrastructure Service Market benefits from urbanization and digitalization, the mainstreaming of edge computing, and increased investment.
Market Dynamics
Drivers:
Cloud infrastructure services offer cost savings through pay-as-you-go models, eliminating the need for upfront hardware investments.
Cloud services allow businesses to scale their infrastructure up or down based on demand, offering flexibility and agility.
Cloud infrastructure enables businesses to reach global markets without the need for physical infrastructure in every location.
Cloud providers often offer advanced technologies such as AI, machine learning, and big data analytics, enhancing overall system performance.
Cloud services provide robust disaster recovery solutions, ensuring business continuity in case of unexpected events.
Cloud infrastructure services function on a pay-as-you-go basis, meaning businesses are charged solely for the resources utilized, eliminating the necessity of upfront hardware investments. This method drastically cuts down initial capital costs and grants companies the ability to adjust resource allocation as required. The absence of physical hardware purchases and maintenance further drives cost savings and enhances resource allocation efficiency. Moreover, the pay-as-you-go model offers increased flexibility and adaptability to evolving business needs, avoiding rigid infrastructure commitments. In essence, it fosters a more economical and efficient approach to IT infrastructure management.
Restraints:
Data breaches and cyber threats remain a major concern for businesses considering cloud adoption.
Organizations may become overly dependent on cloud providers, leading to potential vendor lock-in and limited control over infrastructure.
Meeting regulatory and compliance requirements, especially in highly regulated industries, can be challenging in a cloud environment.
Dependence on internet connectivity and shared resources in a cloud environment can lead to performance variability issues.
Opportunities:
The adoption of hybrid cloud solutions presents opportunities for businesses to leverage the benefits of both public and private cloud infrastructures.
Cloud providers can develop industry-specific solutions tailored to the needs of sectors such as healthcare, finance, and retail.
The growth of IoT devices and edge computing creates opportunities for cloud providers to offer edge-based infrastructure services.
Integrating AI and automation into cloud infrastructure services can improve efficiency, security, and cost-effectiveness.
Challenges:
There is a shortage of skilled professionals with expertise in cloud technologies, leading to challenges in implementation and management.
Migrating legacy systems and applications to the cloud can be complex, requiring careful planning and execution.
Avoiding vendor lock-in and maintaining flexibility to switch between cloud providers without significant disruptions is a challenge for businesses.
Impact of Russia-Ukraine War:
The Russia-Ukraine war has led to increased concerns about cybersecurity and data sovereignty, prompting businesses to reassess their reliance on cloud infrastructure services. Supply chain disruptions, particularly in semiconductor manufacturing, may affect the availability and pricing of cloud hardware. Geopolitical tensions could also impact data center locations and data transfer regulations, potentially causing disruptions in service delivery and compliance requirements. Overall, the uncertainty and instability resulting from the conflict may lead to cautious investment decisions and strategic reevaluations within the cloud infrastructure services market.
Impact of Economic Downturn:
During an economic downturn, businesses often prioritize cost-cutting measures, leading to increased adoption of cloud infrastructure services due to their cost-effective nature. Companies seek to reduce capital expenditures by leveraging pay-as-you-go models and outsourcing IT infrastructure management to cloud providers. The downturn also drives demand for scalable solutions as businesses aim to efficiently manage fluctuating workloads without heavy upfront investments. However, the downturn may also result in delayed or reduced IT spending overall, impacting the pace of cloud adoption and expansion in some sectors. Overall, the cloud infrastructure services market experiences mixed effects during economic downturns, balancing increased demand for cost savings with potential constraints on overall IT budgets.
Market segmentation
By Service
Compute Service
Storage Service
Disaster Recovery and Backup Service
Networking Service
Desktop Service
Managed Hosting
On the basis of services market is divided into computing, storage, disaster recovery, networking, desktop, and managed hosting services. Organizations of all sizes and industries are adopting these services to boost efficiency, reduce server space costs, and ensure data accessibility. The disaster recovery and backup services are projected to have the highest growth rate during forecast period while, the storage services held the largest market share more than 28%. Cloud infrastructure services have become integral to business operations due to their user-friendly nature, cost-effectiveness, and adaptability.
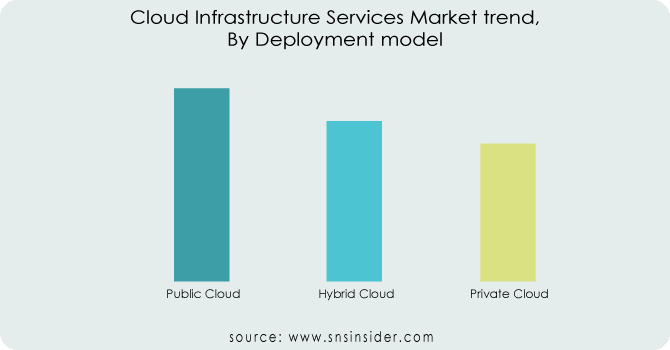
By Deployment model
Public Cloud
Private Cloud
Hybrid Cloud
On the basis of Deployment model the public cloud segment is dominates the market with holding revenue share of more than 39% projected to maintain the largest market share. Among deployment models, the public cloud is noted for its simplicity, easy deployment, and minimal initial investment. Users benefit from scalability, reliability, flexibility, utility-style costing, and location-independent services, without the burden of infrastructure management responsibilities.
Get Customized Report as per Your Business Requirement - Request For Customized Report
By Organization size
Small and Medium-sized Enterprises (SMEs)
Large Enterprises
By Vertical
Banking, Financial Services, and Insurance (BFSI)
IT and Telecommunications
Government and Public Sector
Retail and Consumer Goods
Manufacturing
Energy and Utilities
Media and Entertainment
Healthcare and Life Sciences
Others
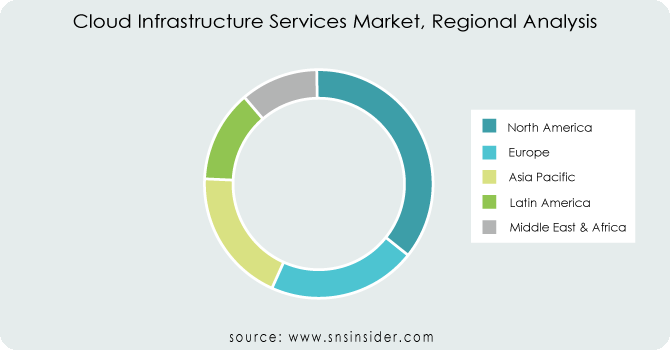
Regional Analysis
North America dominates the global cloud infrastructure services market, with holding Revenue share of more than 38%, driven by increasing widespread adoption of cloud-based IT services and substantial investments in IT infrastructure research and development. The U.S. dominates this industry, benefiting from key vendors' presence and a growing adoption rate of cloud services to cut data center costs and increase business continuity. Major players such as Google, Amazon, and Microsoft further Helps to drive market growth. The Asia Pacific (APAC) region is growing with a significant growth Rate with the highest expected compound annual growth rate (CAGR). The region's focus on rapid, cost-effective service delivery and security in cloud operations is Drive the global cloud infrastructure services market forward.
REGIONAL COVERAGE:
North America
US
Canada
Mexico
Europe
Eastern Europe
Poland
Romania
Hungary
Turkey
Rest of Eastern Europe
Western Europe
Germany
France
UK
Italy
Spain
Netherlands
Switzerland
Austria
Rest of Western Europe
Asia Pacific
China
India
Japan
South Korea
Vietnam
Singapore
Australia
Rest of Asia Pacific
Middle East & Africa
Middle East
UAE
Egypt
Saudi Arabia
Qatar
Rest of the Middle East
Africa
Nigeria
South Africa
Rest of Africa
Latin America
Brazil
Argentina
Colombia
Rest of Latin America
Key Players
The major key players are AWS, Microsoft, Google, IBM, Alibaba, Rackspace, Oracle, Fujitsu, Digitalocean, Vmware & Other Players and other key players mentioned in the final report.
| Report Attributes | Details |
| Market Size in 2022 | US$ 72.67 Bn |
| Market Size by 2030 | US$ 122.30 Bn |
| CAGR | CAGR of 6.72 % From 2023 to 2030 |
| Base Year | 2022 |
| Forecast Period | 2023-2030 |
| Historical Data | 2020-2021 |
| Report Scope & Coverage | Market Size, Segments Analysis, Competitive Landscape, Regional Analysis, DROC & SWOT Analysis, Forecast Outlook |
| Key Segments | • by Service (Compute Service, Storage Service, Disaster Recovery and Backup Service, Networking Service, Desktop Service, Managed Hosting) • by Deployment Model (Public Cloud, Private Cloud, Hybrid Cloud) • by Organization Size (Small and Medium-sized Enterprises (SMEs) and Large Enterprises) • by Industry Vertical (Banking, Financial Services, and Insurance (BFSI), IT and Telecommunications, Government and Public Sector, Retail and Consumer Goods, Manufacturing, Energy and Utilities, Media and Entertainment, Healthcare and Life Sciences, Others) |
| Regional Analysis/Coverage | North America (US, Canada, Mexico), Europe (Eastern Europe [Poland, Romania, Hungary, Turkey, Rest of Eastern Europe] Western Europe] Germany, France, UK, Italy, Spain, Netherlands, Switzerland, Austria, Rest of Western Europe]), Asia Pacific (China, India, Japan, South Korea, Vietnam, Singapore, Australia, Rest of Asia Pacific), Middle East & Africa (Middle East [UAE, Egypt, Saudi Arabia, Qatar, Rest of Middle East], Africa [Nigeria, South Africa, Rest of Africa], Latin America (Brazil, Argentina, Colombia, Rest of Latin America) |
| Company Profiles | AWS, Microsoft, Google, IBM, Alibaba, Rackspace, Oracle, Fujitsu, Digitalocean, and Vmware. |
| Key Drivers | • Cloud infrastructure services offer cost savings through pay-as-you-go models, eliminating the need for upfront hardware investments. • Cloud services allow businesses to scale their infrastructure up or down based on demand, offering flexibility and agility. |
| Market Challenges | • There is a shortage of skilled professionals with expertise in cloud technologies, leading to challenges in implementation and management. • Migrating legacy systems and applications to the cloud can be complex, requiring careful planning and execution. |
Ans. The Compound Annual Growth rate for the Cloud Infrastructure Services Market over the forecast period is 7.62 %.
Ans. The projected market size for the Cloud Infrastructure Services Market is USD 122.30 Bn by 2031.
Ans: The Public cloud Deployment segments dominated the Cloud Infrastructure Services Market with the highest revenue share.
Ans: Yes, you can ask for the customization as per your business requirement.
Ans:
TABLE OF CONTENTS
1. Introduction
1.1 Market Definition
1.2 Scope
1.3 Research Assumptions
2. Industry Flowchart
3. Research Methodology
4. Market Dynamics
4.1 Drivers
4.2 Restraints
4.3 Opportunities
4.4 Challenges
5. Impact Analysis
5.1 Impact of Russia-Ukraine Crisis
5.2 Impact of Economic Slowdown on Major Countries
5.2.1 Introduction
5.2.2 United States
5.2.3 Canada
5.2.4 Germany
5.2.5 France
5.2.6 UK
5.2.7 China
5.2.8 Japan
5.2.9 South Korea
5.2.9 India
6. Value Chain Analysis
7. Porter’s 5 Forces Model
8. Pest Analysis
9. Cloud Infrastructure Services Market, By Service
9.1 Introduction
9.2 Trend Analysis
9.3 Compute Service
9.4 Storage Service
9.5 Disaster Recovery and Backup Service
9.6 Networking Service
9.7 Desktop Service
9.8 Managed Hosting
10. Cloud Infrastructure Services Market, By Deployment model
10.1 Introduction
10.2 Trend Analysis
10.3 Public Cloud
10.4 Private Cloud
10.5 Hybrid Cloud
11. Cloud Infrastructure Services Market, By Organization size
11.1 Introduction
11.2 Trend Analysis
11.3 Small and Medium-sized Enterprises (SMEs)
11.4 Large Enterprises
12. Cloud Infrastructure Services Market, By Vertical
12.1 Introduction
12.2 Trend Analysis
12.3 Banking, Financial Services, and Insurance (BFSI)
12,4 IT and Telecommunications
12.5 Government and Public Sector
12.6 Retail and Consumer Goods
12.7 Manufacturing
12.8 Energy and Utilities
12.9 Media and Entertainment
12.10 Healthcare and Life Sciences
12.11 Others
13. Regional Analysis
13.1 Introduction
14.2 North America
14.2.1 USA
14.2.2 Canada
14.2.3 Mexico
14.3 Europe
14.3.1 Eastern Europe
14.3.1.1 Poland
14.3.1.2 Romania
14.3.1.3 Hungary
14.3.1.4 Turkey
14.3.1.5 Rest of Eastern Europe
14.3.2 Western Europe
14.3.2.1 Germany
14.3.2.2 France
14.3.2.3 UK
14.3.2.4 Italy
14.3.2.5 Spain
14.3.2.6 Netherlands
14.3.2.7 Switzerland
14.3.2.8 Austria
14.3.2.9 Rest of Western Europe
14.4 Asia-Pacific
14.4.1 China
14.4.2 India
14.4.3 Japan
14.4.4 South Korea
14.4.5 Vietnam
14.4.6 Singapore
14.4.7 Australia
14.4.8 Rest of Asia Pacific
14.5 The Middle East & Africa
14.5.1 Middle East
14.5.1.1 UAE
14.5.1.2 Egypt
14.5.1.3 Saudi Arabia
14.5.1.4 Qatar
14.5.1.5 Rest of the Middle East
14.5.2 Africa
14.5.2.1 Nigeria
14.5.2.2 South Africa
14.5.2.3 Rest of Africa
14.6 Latin America
14.6.1 Brazil
14.6.2 Argentina
14.6.3 Colombia
14.6.4 Rest of Latin America
15. Company Profiles
15.1 AWS
15.1.1 Company Overview
15.1.2 Financials
15.1.3 Products/ Services Offered
15.1.4 SWOT Analysis
15.1.5 The SNS View
15.2 Microsoft
15.2.1 Company Overview
15.2.2 Financials
15.2.3 Products/ Services Offered
15.2.4 SWOT Analysis
15.2.5 The SNS View
15.3 Google
15.3.1 Company Overview
15.3.2 Financials
15.3.3 Products/ Services Offered
15.3.4 SWOT Analysis
15.3.5 The SNS View
15.4 IBM
15.4 Company Overview
15.4.2 Financials
15.4.3 Products/ Services Offered
15.4.4 SWOT Analysis
15.4.5 The SNS View
15.5 Alibaba
15.5.1 Company Overview
15.5.2 Financials
15.5.3 Products/ Services Offered
15.5.4 SWOT Analysis
15.5.5 The SNS View
15.6 Rackspace
15.6.1 Company Overview
15.6.2 Financials
15.6.3 Products/ Services Offered
15.6.4 SWOT Analysis
15.6.5 The SNS View
15.7 Oracle
15.7.1 Company Overview
15.7.2 Financials
15.7.3 Products/ Services Offered
15.7.4 SWOT Analysis
15.7.5 The SNS View
15.8 Fujitsu
15.8.1 Company Overview
15.8.2 Financials
15.8.3 Products/ Services Offered
15.8.4 SWOT Analysis
15.8.5 The SNS View
15.9 Digitalocean
15.9.1 Company Overview
15.9.2 Financials
15.9.3 Products/ Services Offered
15.9.4 SWOT Analysis
15.9.5 The SNS View
15.10 Vmware
15.10.1 Company Overview
15.10.2 Financials
15.10.3 Products/ Services Offered
15.10.4 SWOT Analysis
15.10.5 The SNS View
16. Competitive Landscape
16.1 Competitive Benchmarking
16.2 Market Share Analysis
16.3 Recent Developments
16.3.1 Industry News
16.3.2 Company News
16.3.3 Mergers & Acquisitions
17. USE Cases and Best Practices
18. Conclusion
An accurate research report requires proper strategizing as well as implementation. There are multiple factors involved in the completion of good and accurate research report and selecting the best methodology to compete the research is the toughest part. Since the research reports we provide play a crucial role in any company’s decision-making process, therefore we at SNS Insider always believe that we should choose the best method which gives us results closer to reality. This allows us to reach at a stage wherein we can provide our clients best and accurate investment to output ratio.
Each report that we prepare takes a timeframe of 350-400 business hours for production. Starting from the selection of titles through a couple of in-depth brain storming session to the final QC process before uploading our titles on our website we dedicate around 350 working hours. The titles are selected based on their current market cap and the foreseen CAGR and growth.
The 5 steps process:
Step 1: Secondary Research:
Secondary Research or Desk Research is as the name suggests is a research process wherein, we collect data through the readily available information. In this process we use various paid and unpaid databases which our team has access to and gather data through the same. This includes examining of listed companies’ annual reports, Journals, SEC filling etc. Apart from this our team has access to various associations across the globe across different industries. Lastly, we have exchange relationships with various university as well as individual libraries.

Step 2: Primary Research
When we talk about primary research, it is a type of study in which the researchers collect relevant data samples directly, rather than relying on previously collected data. This type of research is focused on gaining content specific facts that can be sued to solve specific problems. Since the collected data is fresh and first hand therefore it makes the study more accurate and genuine.
We at SNS Insider have divided Primary Research into 2 parts.
Part 1 wherein we interview the KOLs of major players as well as the upcoming ones across various geographic regions. This allows us to have their view over the market scenario and acts as an important tool to come closer to the accurate market numbers. As many as 45 paid and unpaid primary interviews are taken from both the demand and supply side of the industry to make sure we land at an accurate judgement and analysis of the market.
This step involves the triangulation of data wherein our team analyses the interview transcripts, online survey responses and observation of on filed participants. The below mentioned chart should give a better understanding of the part 1 of the primary interview.

Part 2: In this part of primary research the data collected via secondary research and the part 1 of the primary research is validated with the interviews from individual consultants and subject matter experts.
Consultants are those set of people who have at least 12 years of experience and expertise within the industry whereas Subject Matter Experts are those with at least 15 years of experience behind their back within the same space. The data with the help of two main processes i.e., FGDs (Focused Group Discussions) and IDs (Individual Discussions). This gives us a 3rd party nonbiased primary view of the market scenario making it a more dependable one while collation of the data pointers.
Step 3: Data Bank Validation
Once all the information is collected via primary and secondary sources, we run that information for data validation. At our intelligence centre our research heads track a lot of information related to the market which includes the quarterly reports, the daily stock prices, and other relevant information. Our data bank server gets updated every fortnight and that is how the information which we collected using our primary and secondary information is revalidated in real time.

Step 4: QA/QC Process
After all the data collection and validation our team does a final level of quality check and quality assurance to get rid of any unwanted or undesired mistakes. This might include but not limited to getting rid of the any typos, duplication of numbers or missing of any important information. The people involved in this process include technical content writers, research heads and graphics people. Once this process is completed the title gets uploader on our platform for our clients to read it.
Step 5: Final QC/QA Process:
This is the last process and comes when the client has ordered the study. In this process a final QA/QC is done before the study is emailed to the client. Since we believe in giving our clients a good experience of our research studies, therefore, to make sure that we do not lack at our end in any way humanly possible we do a final round of quality check and then dispatch the study to the client.
The 5G Fixed Wireless Access (FWA) Market size was valued at USD 24.66 Bn in 2022 and is expected to reach USD 337.75 Bn by 2030, and grow at a CAGR of 38.7% over the forecast period 2023-2030.
The Serverless Security Market size was valued at USD 1.79 Bn in 2022 and is expected to reach USD 15.69 Bn by 2030, and grow at a CAGR of 31.12 % over the forecast period 2023-2030.
The Passive Authentication Market size was valued at USD 2.29 Bn in 2022 and is expected to reach USD 11.37 Bn by 2030, and grow at a CAGR of 22.14 % over the forecast period 2023-2030.
The Smart Space Market size was USD 39.2 billion in 2022 and is expected to Reach USD 108.7 billion by 2030 and grow at a CAGR of 13.6 % over the forecast period of 2023-2030.
The Trade Management Software Market size was valued at USD 1.25 billion in 2022 and is expected to grow to USD 2.70 billion by 2030 and grow at a CAGR of 10.12 % over the forecast period of 2023-2030.
The AI Orchestration Market size was USD 6.9 billion in 2022 and is expected to Reach USD 35.22 billion by 2030 and grow at a CAGR of 22.5 % over the forecast period of 2023-2030.

Hi! Click one of our member below to chat on Phone
© 2024 All Rights Reserved by SNS Insider Pvt Ltd